http://dx.doi.org/10.1590/198055272034 www.ie.ufrj.br/revista
www.scielo.br/rec
A REGIONAL PERSPECTIVE OF THE
CREATIVE ECONOMY IN BRAZIL
Jorge Nogueira de Paiva Brittoa
aProfessor of the Department of Economics at the Fluminense Federal University, Rio de Janeiro, Brazil.
Manuscript received on 2015/10/23 and accepted for publication on 2016/11/21.
ABSTRACT: In a knowledge‑based economy, initiatives based on the Creative Economy framework are supposed to promote regional economic diversification in developing countries. In Brazil, policy initiatives have focused on those activities with a view to design public policies oriented to reducing socio‑economic and regional inequalities, as well as spreading those activities throughout the territory, especially towards less favored regions. Based on the Brazilian experience, this article discusses whether the pre‑existing regional distribution of various types of creative activities favors or hinders the reduction of regional inequalities as a result of a policy focused on promoting creative activities and what actions could be adopted to achieve this result. Specifically, the paper discusses whether this expansion can promote an effective reduction of regional inequalities in terms of the number and quality of jobs and wage levels associated with those activities. The analysis suggests that the regional decentralization of creative activities towards less developed regions has been relatively limited in Brazil, as the more developed regions have remained more specialized in trades with higher digital and technological content, while the less developed regions have remained relatively more specialized in activities related to the cultural heritage. To reduce this imbalance, the support of local institutions and S&T infrastructure related to creative activities appears to be very important, which points out to the relevance of comprehensive policies well‑adapted to very diverse local realities. This effort should have the impact of new digital‑based technologies converge with the strengthening of economic potential of local and regional cultural heritage, by enhancing professional qualification of workers devoted to those activities.
KEYWORDS: creative economy; creativity and regional development; creative activities. JEL CODES: O17; R11; R12.
ECONOMIA CRIATIVA NO BRASIL:
UMA PERSPECTIVA REGIONAL
RESUMO: No contexto de uma economia baseada no conhecimento, as iniciativas baseadas no conceito de Economia Criativa podem promover um processo de diversi‑ ficação econômica regional dos países em desenvolvimento. No Brasil, políticas públi‑ cas focalizadas nessas atividades tem sido implementadas com o objetivo de reduzir desigualdades socioeconômicas e regionais, estimulando a disseminação dessas ativi‑ dades em todo o território, especialmente na direção das regiões menos favorecidas. O artigo procura discutir se essa expansão tem induzido uma redução efetiva dos dese‑ quilíbrios regionais em termos da quantidade e qualidade dos postos de trabalho cria‑ dos e do nível de remuneração gerada por essas atividades. A análise sugere que a descentralização regional das atividades criativas na direção de regiões menos desen‑ volvidas é relativamente limitada no Brasil, com as regiões mais desenvolvidas perma‑ necendo especializadas em áreas com maior conteúdo digital e tecnológico, enquanto que as regiões menos desenvolvidas se apresentando relativamente mais especializado em áreas relacionadas com o patrimônio cultural. Para reduzir este desequilíbrio, o apoio de instituições locais e da infraestrutura de C&T relacionadas com atividades criativas é particularmente importante, integrando o impacto das novas tecnologias de base digital com o reforço do potencial econômico do patrimônio cultural local e re‑ gional, através da melhoria da qualificação profissional dos trabalhadores nessas ativi‑ dades.
1. INTRODUCTION
For the United Nations Conference on Trade and Development (UNCTAD), the Creative economy is an evolving concept based on creative assets potentially generating economic growth and development (2008, 2010). In a broader definition, the Creative Economy consists of transactions that includes at the core creative people expressing a personal aesthetic in their work, comprising collaborative processes between creativity, technology and business. This economy comprises functional products and services, which encompass both formal and informal activities, as well as industrial and non‐ industrial sectors. Creative Industries are among the most dynamic sectors of the world economy, presenting a huge potential to boost national economies, generating jobs, income and development, due to crosscutting linkages at macro and micro levels of the economy, while promoting social inclusion, cultural diversity and human development. In the policy sphere, the Creative Economy includes as set of knowledge‑based economic activities with potential to induce a process of socio‑economic development, which constitutes a feasible development option for innovation, multidisciplinary policy responses and inter‑ministerial action.
Initiatives based on Creative Economy have promoted economic diversification, trade and innovation in various countries and regions, contributing to the revitalization of degraded urban areas, to the development and promotion of remote rural areas and to the conservation of cultural and natural heritage (UNCTAD, 2010). At the same time, evidence shows that countries with denser creative economies have recovered more quickly from the challenges posed by the increasing globalization (STOLARICK et al., 2010). To developing countries, creative activities also represent a catalyst for a more comprehensive, balanced and inclusive development, as they promote well‑being and strengthen resilient paths of economic growth. They can create jobs that are less susceptible to fluctuations of the global economy, which tend to be labor intensive instead of capital intensive, generating positive externalities and constituting a basis of a local, sustainable and all‑inclusive development, contributing to a better quality of life.
direction of less favored regions. In this perspective, a relevant issue refers to the effective potential of creative activities to contribute to the reduction of regional inequality, spreading the dissemination of those activities throughout the territory, especially in the direction of less favored regions. Based on the Brazilian experience, this article discusses whether the pre‑existing regional distribution of various types of creative activities favors or hinders the reduction of regional inequalities as a result of a policy focused on promoting creative activities and what actions could be adopted to achieve this result. Specifically, the paper discusses whether this expansion can promote an effective reduction of regional inequalities in terms of the number and quality of jobs and wage levels associated with those activities. This analysis associates the distribution and the pattern of specialization in creative activities at different territorial scales with a more detailed focus on the federative states, but also seeks evidence on the nature of the process at the level of more fragmented territorial units (“homogeneous micro‑regions”).
The article is organized into three blocks, as follows. The first section presents a synthesis of the main approaches that try to characterize creative activities and to develop sectoral classifications to them. The second section presents a general framework of the creative activities in the Brazilian economy, stressing the criteria applied by policy instances to classify those activities and presenting some results of studies and evaluations that have attempted to estimate the size of the Creative Economy in Brazil. The third section presents an attempt to identify inter‑sectoral trends related to the regional distribution of creative activities in Brazil, in terms of jobs and salaries paid. The discussion about regional imbalances related to the distribution of those activities also includes the analysis of concentration indexes and locational indexes defined to different territorial scales. A conclusive section summarizes a number of policy implications generated from the analysis.
2. DEFINING THE CREATIVE ECONOMY: GENERAL APPROACHES
Creative industries combine different dimensions of creativity (UNCTAD, 2010). Artistic creativity involves imagination and a capacity to generate original ideas and novel ways of interpreting the world, expressed in text, sound and image. Scientific creativity involves curiosity and a willingness to experiment and make new connections in problem solving. The broader concept of Economic creativity refers to a dynamic process leading towards innovation in technology, business practices, marketing, etc., with the aim of gaining competitive advantages in the economy. Another aspect refers to the relevance of some enabling factors for the development of the Creative Economy. Among these factors, we can mention the provision of infrastructure, particularly ICT and transportation, the availability of social and cultural spaces/amenities and the quality of educational systems, especially to the development of creative skills. An institutional framework that protects individuals’ rights and is tolerant towards cultural and social diversity seems also to be relevant, as well as the presence of intellectual property rights regimes that reward creativity and protect local creators in global markets. In the policy sphere, we can mention the support for small and medium sized enterprises to ensure that creative industries as an economic driver are wide‐spread, as well as the support to existing creative clusters, which could integrate smaller innovative and creative firms asa part of a larger industry. At the regulatory level, we can mention the relevance of instruments that promote access into the field of those industries by creative entrepreneurs.
The “Economic” Rationale of the Creative Economy remains in the hypothesis that creative industries are a major economic driver, generating faster economic growth, employment and job creation. Their growing relevance reflects a transformation from a manufacturing‐based economy to a knowledge‐based economy. Cultural/creative industries offer new responses and opportunities in a globalized context, not only driving growth through the creation of value, but also becoming key elements of the innovation system of the entire economy. In this context, their primary significance stems from the ways in which they stimulate the emergence of new ideas or technologies, and the processes of structural change.
and regional economies. This perspective stresses the possibility of associating the relevance of those activities with a creative index, including the computation of indices such as a bohemian index, gay index and so forth. It also stresses the “convergence of formats” as a defining feature of the creative economy, directing the focus to the media through which creative products are consumed, which are increasingly reliant upon a common digital platform, stimulating the amalgamation of arts, popular culture, telecommunications and broadcasting. Finally, the approach of “locational proclivities” emphasizes the spatial organization and geography of specific forms of cultural production in particular localities, reflecting a process of agglomeration, clustering or metropolitan primacy. This approach assumes that creativity and innovation in the modern cultural economy remains a social phenomenon rooted in a local production system and its geographic milieu. In this perspective, creative activities, at the same time, tend to be root and havethe capacity to transform urban locations.
Different models are elaborated and refined to characterize the creative economy. The original characterization elaborated by Howkins (2001) outlines 15 industries that contribute to the creative economy by generating creative products and services, ranging from the arts to science and technology, which results from creativity and has economic value. The UK DCMS model defines the creative industries as those requiring “creativity, skill and talent with the potential for wealth and job creation through the exploitation of their intellectual property” (DCMS, 1998). The Concentric Circles model developed by Throsby (2001) assumes that creative ideas originate in the core creative arts and that these ideas and influences diffuse outwards through a series of layers or concentric circles, with the proportion of cultural to commercial content decreasing as one moves outwards from the center. The UNESCO definition of Cultural Economy (2013) distinguishes six main cultural domains – Natural Heritage; Performance and Celebration; Visual Arts and Crafts; Books and Press; Audio‑visual and Interactive Media; Design and Creative Services – as well as two related domains – Tourism; Sports and Recreation. The WIPO copyright model (2003) stands the role industries played directly or indirectly in the creation, manufacture, production, broadcast and distribution of copyrighted material.
sites: archaeological sites, museums, libraries, exhibitions, etc. The group of Arts includes creative industries based purely on art and culture, comprising two large subgroups: (i) Visual arts: painting, sculpture, photography and antiques; (ii) Performing arts: live music, theatre, dance, opera, circus, puppetry, etc. The group of Media covers two subgroups that produce creative content with the purpose of communicating with large audiences (the “new media” is classified separately): (i) Publishing and printed media: books, press and other publications; (ii) Audiovisuals: film, television, radio and other broadcasting. The broader group of Functional creations comprises more demand‑driven and services‑oriented industries that create creative goods and services with functional purposes. It is divided into the following subgroups: (i) Design: interior, graphic, fashion, jewelry, toys; (ii) New media: architectural, advertising, cultural and recreational, creative research and development (R&D), digital and other related creative services; (iii) Creative services: architectural, advertising, cultural and recreational, creative research and development (R&D), digital and other related creative services. There is an ongoing debate about whether science and R&D are components of the creative economy, and whether creative experimentation activities can include R&D. Recent empirical research has strengthened the relevance of the interactions between research, science and the dynamics of the creative economy.
To the developing countries, the improvement of the Creative Economy has an economic potential for wealth creation as a source of jobs, revenues and currencies for exports, but also as a catalyst for a more comprehensive and balanced development, creating well‑being and reinforcing a process of inclusive development at local, regional and national levels. A study conducted by SELA (2011) argued that cultural industries might be particularly relevant to developing countries, with culture constituting an available resource in the fight against inequality and poverty, generating employment choices for indigenous people and to vulnerable or sidelined groups. In this perspective, culture not only represents a potential for creating jobs and revenues, but also for creating positive externalities, being flexible to be developed both in the rural and urban slums, benefiting the poorer groups of society. At the same time, culture plays an important role in recreating cities as safe living spaces that instill in their residents a sense of responsibility and belonging, contributing to reduce territorial inequalities.
3. CREATIVE ACTIVITIES IN THE BRAZILIAN ECONOMY
of price formation, and resulting in the production of cultural and economic wealth” (MINISTÉRIO DA CULTURA, 2011, p.22). This Secretariat also argues that
Creative Economy from the cultural, social and economic dynamics comprises the cycle of creation, production, distribution / circulation / dissemination and consumption / enjoyment of goods and services from the creative sectors characterized by the prevalence of its symbolic dimension. (2011, p. 23)
According to this perspective, the guiding principles to define creative activities comprise four main attributes. Innovation in creative activities comprises both improvements (incremental innovations) and the creation of something completely new (radical innovation), being related to the identification of relevant and workable solutions, especially in the creative sectors whose products are the result of the integration of new technologies and cultural content. The principle of Social Inclusion stresses the promotion of productive inclusion of the population through training and professional qualification and the generation of job opportunities and income, also assuming that the access to creative goods and services emerges as a premise for citizenship. The principle of Cultural Diversity assumes that the growth of the Brazilian creative economy must include the recovery, protection and promotion of the diversity of national cultural expressions in order to ensure their originality, their strength and their potential. The principle of Sustainability comprises a critical evaluation of the impacts of economic development, including a management of the stages of this development to ensure social, cultural, environmental and economic reproduction of traditional creative activities for future generations.
To orient a definition of an effective set of policies, the Brazilian Secretariat of the Creative Economy identifies six “core” Creative Sectors: 1) Natural and Cultural Heritage; 2) Spectacles and Celebrations; 3) Visual Arts and Crafts; 4) Books and Periodicals; 5) Audiovisual and Interactive Media; 6) Design and Creative Services. Additionally, we can consider two related creative sectors: Tourism and Sports/Leisure. It also mentions the relevance of preserving the Intangible Heritage (including oral traditions and expressions, rituals, languages and social practices), improving the general conditions of Education and Training and availability of equipment and support materials.
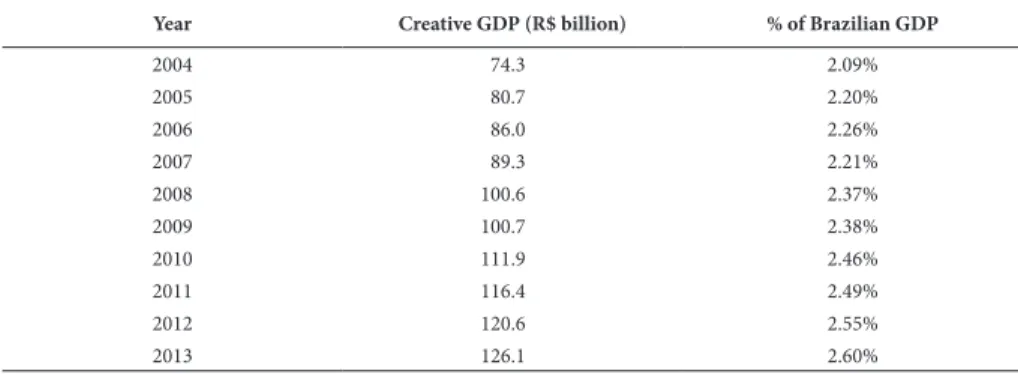
arts, Music, Performing arts); 3) Media (Editorial, Audiovisual); 4) Technology (R&D, ICT, Biotechnology). According to FIRJAN (2014), 251.000 companies formed the core of the Brazilian creative industry in 2013. Over the last decade, there was an increase of 69.1% since 2004, when they were 148.000 companies. Based on amount of salaries generated by those companies, it is estimated that the creative core activities generate a gross domestic product equivalent to R$ 126 billion, equivalent to 2.6% of the overall production in Brazil in 2013, compared to 2.1% in 2004. During this period, the GDP of Creative Industry advanced 69.8% in real terms, compared to an advance of 36.4% of the GDP in the same decade (Table 1).
Table 1 – Creative GDP Estimate and Its Contribution to Brazilian GDP Total (2004-2013)
Year Creative GDP (R$ billion) % of Brazilian GDP
2004 74.3 2.09%
2005 80.7 2.20%
2006 86.0 2.26%
2007 89.3 2.21%
2008 100.6 2.37%
2009 100.7 2.38%
2010 111.9 2.46%
2011 116.4 2.49%
2012 120.6 2.55%
2013 126.1 2.60%
Source: FIRJAN (2014).
professionals also had the highest average wages – Research & Development (R$ 9,990), Architecture (R$ 6,927), ICT (R$ 5,393) and Advertising (R$ 5,075). Already compared to 2004, the highest real wage increases occurred in the segments less paid: Fashion (42.1%), Music (33.3%), Audiovisual (32.7%) and Cultural Expressions (31.6%).
Table 2 – Jobs and Salaries in Brazilian Creative Industries (2004 and 2013)
Segments Jobs (Thousands) Salaries (R$ 1,000)
2004 2013 Growth 2004 2013 Growth
1) Consumption 211.5 422.9 100.0% 3,619 4,653 28.6%
Advertising 45.7 154.8 238.5% 5,354 6,927 29.4%
Architecture 62.7 124.5 98.5% 5,701 5,075 ‑11.0%
Design 42.6 87.0 104.3% 2,556 2,760 8.0%
Fashion 60.5 56.7 ‑6.3% 993 1,412 42.1%
2) Culture 43.3 62.1 43.6% 1,962 2,527 28.8%
Cultural expressions 18.3 22.5 22.7% 2,880 3,721 29.2%
Heritage and arts 10.2 16.4 60.9% 3,047 3,157 3.6%
Music 7.5 12.0 60.4% 1,662 2,216 33.3%
Performing arts 7.2 11.2 54.9% 1,146 1,508 31.6%
3) Media 64.2 101.4 58.0% 2,670 3,080 15.4%
Editorial 27.8 50.8 82.5% 3,829 3,794 ‑0.9%
Audio‑visual 36.3 50.6 39.1% 1,782 2,364 32.7%
4) Technology 150.9 306.1 102.8% 6,688 7,848 17.3%
R&D 82.2 166.3 102.3% 3,791 4,911 29.6%
ICT 55.5 112.9 103.6% 8,344 9,990 19.7%
Biotechnology 13.2 26.9 102.8% 4,926 5,393 9.5%
Creative industries 469.8 892.5 90.0% 4,323 5,422 25.4%
Source: FIRJAN (2014).
Another study elaborated by Oliveira, Araujo and Silva to IPEA (2013) presents an estimation of the Creative Economy size in Brazil, both to the formal and informal sectors. To measure this size, two dimensions are used and two approaches are developed. The two different dimensions comprise the productive sector – in which the focus is on the creative character of the economic activity – and the occupational dimension of the creative classes – in which the focus is on the occupation exercised by the employee. The approaches comprise the formal economy, based on data from the Annual Report of Social Information (RAIS) of the Ministry of Labor and Employment (MTE), and the formal and informal economy, based on data from the National Household Survey (PNAD), carried out by the Brazilian Institute of Geography and Statistics (IBGE). The identification of economic sectors that define the creative economy also comprises the use of data from the Annual Survey of Services (PAS) carried by IBGE, allowing for an estimation of the value added by enterprises in creative industries, in order to identify the participation of the creative economy in the Brazilian GDP.
creative economy would be around 2% according to both criteria: considering to the occupational criterion, the creative industry employed 575,000 workers in 2010, while considering the sectoral criterion it reaches 583,000 employees. According to the sectoral criterion, the more relevant sectors are publishing and print media, new media, creative services and audiovisual. According to the occupational criterion, creative and design services have concentrated most of the occupations. There are also several creative services workers (among which include, among others, architects and teaching professionals) as well as designers in companies whose core business is not exactly tied to the creative economy. In order to assess the extent of the creative economy, IPEA study used the data from PAS‑IBGE corrected by the proportionality of the creative occupations derived from the RAIS to estimate the Value Added (VA) generated by the creative industries in Brazil in 2009. According to this procedure, the VA of the Brazilian creative economy corresponded to 1.1% of GDP. When comparing the VA generated by the creative industries with the VA of whole economy in 2009, we get 1.2%. It should be noted that this comparison does not incorporate the informal dimension of creative activities in the Brazilian economy.
4. REGIONAL DISTRIBUTION OF CREATIVE ACTIVITIES IN BRAZIL
4.1. HYPOTHESIS AND METHODOLOGY
The analysis is mainly descriptive, without a concern to define quantitative correlations between the factors that could influence the process of regionalization in the creative industries. Initially, the analysis relies on traditional measures (indexes) of concentration to discuss to what extent the creative activities are dispersed throughout the territory. On the other hand, the analysis also seeks to assess the degree of sectoral concentration of these activities in each territory (regions and federal states). The differentiation of creative activity sectors permits to distinguish how those with higher content “digital” and those more directly associated with the artistic and cultural heritage are regionally distributed. The hypothesis is that the regional distribution of creative activities tends to be affected by the regional specialization of the territories in each one of these groups.
reinforces the value of creativity as a means to territorial differentiation. This discussion about the relevance of the generation and diffusion of knowledge to the process of territorial development may be associated with the territorial knowledge base classification into three ideal‑types proposed by Asheim et al. (2011) and Martin (2012): Synthetic (engineering based), Analytical (science based) and Symbolic (artistic based), forming the so‑called SAS model. This analytical model seeks to consider the three types of knowledge that prevail in a region. Combining theory and empirical observation provided by this model, we could infer certain expected characteristics and some typical examples of activities structured from these bases
The improvement of the Creative Economy has an economic potential to generate a more comprehensive and well‑balanced development to developing countries, reinforcing a process of inclusive development at local and regional levels. However, this process reflects the previous distribution of those activities in the territory and the previous patterns of productive specialization of the different regions in different sectors of them. In this perspective, a relevant issue refers to the effective potential of the strengthening of creative activities to contribute to the reduction of regional inequality, spreading the dissemination of those activities throughout the territory, especially in the direction of less favored regions.
In order to discuss these aspects, the following analysis presents an attempt to map of the regional distribution of jobs and remunerations in creative activities in Brazil. The basic source of information comprises data about formal jobs extracted from RAIS, the Annual Report of Social Information provided by the Brazilian Ministry of Labor and Employment. The methodology also considers a spatial criterion to locate economic activities in the territory based not only in an analysis with focus on federative states but also on the concept of “homogeneous micro‑regions”, defined by IBGE, the Brazilian Institute of Economic Statistics. The economic activities were distinguished according to a 4‑digit Brazilian industrial classification, which is compatible with the International Standard Industrial Classification (ISIC). Different groups of creative activities were identified, in order to establish specific criteria for the identification of matched pairs comprising those activities and the territorial concentration of the entrepreneurial activity. It should be noted that the criterion used to identify creative activities have been adapted to take into account the classification of economic activities provided by this database. Concerning the data from RAIS, which include information about formal jobs collected from business units, eleven activities were considered: 1) Publishing and Printing; 2) Film, video and music; 3) Radio and TV; 4) Software development; 5) Architectural services; 6) Advertising agencies; 7) Design and Interior decoration; 8) Photographic and similar activities; 9) Performing activities; 10) Activities related to cultural heritage; 11) Activities of membership organizations linked to culture and art.
4.2. THE REGIONAL DISTRIBUTION OF JOBS IN CREATIVE ACTIVITIES
jobs in creative activities), followed by Radio and TV (with 112,820 formal jobs, equivalent to 16.5% of the overall jobs in creative activities), Publishing and Printing (with 105,744, equivalent to 15.5% of the overall jobs in creative activities), Advertising agencies (with 31,574 formal jobs, equivalent to 4.6% of the overall jobs in creative activities) and Film, video and music (with 29,921 formal jobs, equivalent to 4.4% of the overall jobs in creative activities).
Rev
. Econ.
Contemp
., Rio de J
aneiro , v . 20, n. 3, p . 458-491, set-dez/2016 Total Publishing and Printing Film, video and music Radio and TV Software development Architectural services Advertising agencies Design and Interior decoration Photographic and similar activities Performing activities Activities related to cultural heritage Activities of membership organizations linked to culture and art
Sub-total creative activities Creative activities /total
Rondônia 0.8% 0.4% 0.9% 1.0% 0.1% 0.1% 0.2% 0.4% 0.5% 0.3% 0.4% 0.0% 0.3% 0.6%
Acre 0.3% 0.1% 0.2% 0.3% 0.0% 0.2% 0.1% 0.4% 0.1% 0.0% 3.3% 0.3% 0.1% 0.7%
Amazonas 1.3% 0.9% 1.5% 1.6% 0.3% 1.6% 1.0% 0.2% 0.1% 4.3% 0.3% 0.2% 0.8% 0.9%
Roraima 0.2% 0.1% 0.2% 0.3% 0.0% 0.0% 0.1% 0.0% 0.1% 0.0% 0.2% 0.0% 0.1% 0.7%
Pará 2.3% 1.2% 1.5% 1.9% 0.4% 1.3% 1.4% 1.7% 1.4% 1.4% 4.5% 2.2% 1.0% 0.6%
Amapá 0.3% 0.0% 0.2% 0.2% 0.0% 0.2% 0.2% 0.1% 0.0% 0.1% 0.1% 0.4% 0.1% 0.5%
Tocantins 0.5% 0.2% 0.4% 0.4% 0.1% 0.2% 0.1% 0.3% 0.4% 0.1% 0.0% 0.1% 0.2% 0.5%
North 5.6% 2.9% 4.8% 5.7% 0.9% 3.6% 3.2% 3.0% 2.7% 6.3% 8.8% 3.2% 2.7% 0.7%
Maranhão 1.5% 0.5% 1.2% 1.5% 0.2% 1.6% 1.0% 1.2% 0.4% 0.5% 1.1% 0.3% 0.6% 0.5%
Piauí 0.9% 0.4% 0.5% 0.7% 0.1% 1.6% 0.6% 0.2% 0.5% 0.4% 4.1% 3.4% 0.4% 0.7%
Ceará 3.1% 2.4% 2.4% 2.2% 2.1% 2.4% 1.8% 2.4% 2.0% 2.7% 0.2% 11.0% 2.4% 1.1%
Rio Grande do Norte 1.3% 0.6% 1.7% 1.2% 0.6% 1.2% 0.9% 0.8% 0.8% 2.1% 1.6% 0.6% 0.8% 0.9%
Paraíba 1.3% 0.9% 1.0% 1.5% 0.4% 0.2% 0.6% 0.3% 0.5% 2.2% 0.0% 0.4% 0.7% 0.8%
Pernambuco 3.6% 2.8% 2.7% 2.3% 2.2% 2.1% 3.0% 1.0% 3.3% 3.8% 2.3% 1.5% 2.4% 0.9%
Alagoas 1.0% 0.3% 0.7% 0.8% 0.3% 0.5% 0.6% 0.1% 0.8% 0.4% 0.1% 0.4% 0.4% 0.5%
Sergipe 0.8% 0.5% 0.5% 0.7% 0.2% 1.4% 0.9% 0.1% 0.6% 0.9% 0.2% 0.3% 0.4% 0.7%
Bahia 4.7% 1.8% 2.9% 2.9% 2.2% 3.9% 3.4% 3.6% 2.9% 8.0% 4.9% 2.4% 2.6% 0.8%
Northeast 18.2% 10.2% 13.6% 13.6% 8.2% 14.8% 12.8% 9.7% 11.8% 20.9% 14.5% 20.3% 10.8% 0.8%
Minas Gerais 10.3% 7.0% 6.2% 7.2% 7.9% 8.3% 6.4% 6.1% 10.9% 10.5% 11.2% 5.4% 7.6% 1.0%
Espírito Santo 2.0% 1.9% 1.2% 1.9% 1.5% 1.4% 1.5% 1.4% 2.2% 0.9% 0.3% 2.9% 1.6% 1.2%
Rio de Janeiro 9.4% 10.2% 15.9% 14.6% 10.9% 17.3% 8.4% 11.4% 8.6% 16.8% 15.6% 7.6% 11.6% 1.7%
São Paulo 28.7% 40.5% 37.0% 29.8% 45.2% 33.0% 48.9% 48.3% 35.2% 24.1% 23.5% 42.8% 40.4% 2.0%
Southeast 50.3% 59.6% 60.4% 53.4% 65.5% 59.9% 65.1% 67.2% 56.9% 52.3% 50.6% 58.7% 61.3% 1.7%
Paraná 6.4% 8.6% 5.0% 5.7% 5.5% 4.1% 3.7% 6.4% 6.8% 5.5% 14.7% 6.2% 6.0% 1.3%
Santa Catarina 4.5% 3.8% 3.2% 4.6% 5.3% 3.4% 3.7% 4.4% 6.4% 2.9% 0.3% 3.4% 4.6% 1.4%
Rio Grande do Sul 6.3% 9.4% 4.9% 8.0% 5.6% 7.3% 4.5% 3.0% 8.8% 4.5% 6.1% 3.8% 6.5% 1.4%
South 17.2% 21.7% 13.2% 18.4% 16.3% 14.8% 12.0% 13.8% 22.0% 13.0% 21.2% 13.4% 17.2% 1.4%
Mato Grosso do Sul 1.3% 1.0% 1.1% 1.4% 0.8% 1.0% 1.1% 0.3% 0.7% 1.9% 0.9% 0.6% 1.0% 1.1%
Mato Grosso 1.6% 0.6% 2.2% 1.4% 0.8% 0.8% 1.1% 1.3% 1.2% 0.6% 0.2% 0.4% 0.9% 0.8%
Goiás 3.1% 1.9% 2.3% 2.6% 1.7% 2.6% 1.5% 2.6% 2.4% 3.0% 0.9% 0.9% 1.9% 0.9%
Distrito Federal 2.7% 2.1% 2.5% 3.4% 5.8% 2.4% 3.3% 2.1% 2.2% 1.8% 2.9% 2.4% 4.2% 2.2%
Midwest 8.7% 5.6% 8.1% 8.9% 9.0% 6.9% 6.9% 6.2% 6.6% 7.4% 5.0% 4.4% 8.0% 1.3%
TOTAL 48,948,433 105,744 29,921 112,820 326,438 9,351 31,574 3,552 18,741 19,190 6,673 18,876 682,880 1.4%
% creative activities in
total 100.0% 0.2% 0.1% 0.2% 0.7% 0.0% 0.1% 0.0% 0.0% 0.0% 0.0% 0.0% 1.4%
% in creative activities 15.5% 4.4% 16.5% 47.8% 1.4% 4.6% 0.5% 2.7% 2.8% 1.0% 2.8% 100.0%
terms of distribution by federative states in that region, 1.0% of formal jobs in creative activities were concentrated in Pará and 0.8% in the Amazonas. In terms of relative share of the North, the most important activities were those of Activities related to cultural heritage (with 8.8% of formal jobs in the region) Performing activities (6.3%), Radio and TV (5.7%) and Film, video and music (4.8%).
A subsequent analysis comprises an effort to match the information about the distribution of jobs in creative activities extracted from RAIS and from the Census. The data from Census comprises a classification of activities in which the respondents were employed, while the data from RAIS refers to the classification of the sector of activity of the respondent companies. Matching those data, through a harmonization of the classification of activities, we tried to define an index of “formalization” of the labor market in creative activities, given by the relationship among the data (Table 4). According to the information collected for the set of creative activities, this ratio reached 36.2% in 2010, which is 29% lower than the ratio observed for the overall activities (51.0%), reflecting the lower level of formal employment in creative activities. Regionally, the “index of formalization” of the labor market in creative activities was highest in the Midwest region, reaching 40.5% because of the value observed in the Federal District (63.0%). In the Southeast, this index reached 39.6%, reflecting the high value observed in São Paulo (43.0%). In the South, the index reached 36.3%, reflecting the high value observed in Santa Catarina (39.6%). Contrastingly, the index presented significantly lower values in the North (23.0%) and in the Northeast (25.1%). We can also articulate the level of “formalization” of the labor market in creative activities to two additional aspects. The first involves the formal education level of employees in those activities, assessing the participation of workers with higher education level in creative activities and comparing this indicator with the indicator observed for the overall set of economic activities. Data presented in Table 4 indicate that the share of employees with higher education in creative activities is higher in the Southeast (46.4%), in the Midwest (40.3%) and in the South (35.5%), when compared to the Northeast (28.5%) and the North (22.5%). Besides that, when compared to the share of employees with higher education in the overall activities, the share in creative actives is higher in the Southeast (2.43) and in the South (2.08), particularly when compared to the Northeast (1.61) and the North (1.26). The second aspect involves the enrollment in higher level education in academic fields related to creative activities1,
1 The analysis selected the followed academic fields: Computer science, Information processing,
Rev
. Econ.
Contemp
., Rio de J
aneiro , v . 20, n. 3, p . 458-491, set-dez/2016
Index of formalization – Comparison between
Census (2010) and RAIS (2010) Share of Higher education Employees – RAI S (2013)
Enrollment in education of higher level education – Census MEC (2014)
Index of
formalization in – Total
Index of formalization in Sub-total creative activities Index of formalization in –Creative activities /total
Higher education – Creative Activities
Higher education – Overall Activities
Comparison – Creative Activities/
Overall Activities
Enrollment in education of higher
level –academic fields related to creative activities
Enrollment in education of higher
level – overall academic fields
% of Enrollment in education of higher level –academic fields related to creative activities
Rondônia 45.7% 25.7% 56.2% 11.5% 14.7% 0.78 2,816 47,915 5.9%
Acre 43.4% 24.2% 55.7% 16.3% 22.0% 0.74 1,862 25,166 7.4%
Amazonas 43.5% 23.9% 55.0% 23.4% 18.4% 1.27 8,038 138,407 5.8%
Roraima 43.3% 29.5% 68.1% 18.7% 27.5% 0.68 1,090 20,991 5.2%
Pará 32.8% 24.9% 76.0% 26.4% 17.0% 1.55 6,711 134,849 5.0%
Amapá 41.5% 14.4% 34.8% 23.5% 14.0% 1.68 2,624 31,165 8.4%
Tocantins 40.9% 11.8% 28.8% 22.1% 21.3% 1.04 1,909 49,119 3.9%
North 38.5% 23.0% 59.8% 22.5% 17.9% 1.26 25,050 447,612 5.6%
Maranhão 27.0% 15.0% 55.6% 18.1% 16.1% 1.13 5,908 119,697 4.9%
Piauí 31.1% 17.1% 55.2% 19.4% 22.9% 0.85 4,356 95,724 4.6%
Ceará 39.4% 29.4% 74.6% 26.9% 18.7% 1.44 18,209 225,460 8.1%
Rio Grande do Norte 46.4% 23.0% 49.5% 25.6% 18.8% 1.37 5,402 109,016 5.0%
Paraíba 39.2% 33.4% 85.1% 26.4% 19.5% 1.36 8,333 127,875 6.5%
Pernambuco 45.1% 26.5% 58.8% 37.4% 19.2% 1.95 15,456 225,993 6.8%
Alagoas 42.0% 21.3% 50.8% 20.1% 12.9% 1.56 4,350 81,914 5.3%
Sergipe 44.4% 30.0% 67.7% 24.0% 20.4% 1.18 3,767 68,472 5.5%
Bahia 36.6% 24.5% 66.9% 29.2% 15.3% 1.91 14,896 316,210 4.7%
Northeast 38.4% 25.1% 65.4% 28.5% 17.7% 1.61 80,677 1,370,361 5.9%
Minas Gerais 50.2% 32.0% 63.8% 37.8% 16.3% 2.32 44,775 661,585 6.8%
Espírito Santo 50.8% 33.3% 65.7% 37.7% 17.0% 2.22 8,496 118,693 7.2%
Rio de Janeiro 57.1% 36.6% 64.2% 43.9% 21.3% 2.07 40,086 544,605 7.4%
São Paulo 64.4% 43.0% 66.8% 49.1% 19.5% 2.51 158,749 1,702,174 9.3%
Southeast 58.9% 39.6% 67.3% 46.4% 19.1% 2.43 252,106 3,027,057 8.3%
Paraná 52.4% 35.0% 66.6% 36.9% 18.3% 2.02 30,217 374,501 8.1%
Santa Catarina 57.8% 39.6% 68.6% 39.7% 16.5% 2.41 24,496 227,099 10.8%
Rio Grande do Sul 50.7% 35.5% 70.1% 31.1% 16.1% 1.93 35,941 391,564 9.2%
South 53.0% 36.3% 68.5% 35.5% 17.0% 2.08 90,654 993,164 9.1%
Mato Grosso do Sul 47.5% 30.9% 65.0% 25.8% 16.9% 1.52 6,512 88,267 7.4%
Mato Grosso 45.3% 23.0% 50.8% 28.2% 15.9% 1.78 7,445 128,380 5.8%
Goiás 44.4% 30.6% 69.0% 29.3% 16.4% 1.79 12,534 210,215 6.0%
Distrito Federal 85.4% 63.0% 73.7% 51.6% 27.8% 1.86 16,935 183,811 9.2%
Midwest 52.8% 40.5% 76.6% 40.3% 19.9% 2.03 43,426 610,673 7.1%
TOTAL 51.0% 36.2% 71.0% 41.5% 18.5% 2.24 491,913 6,448,867 7.6%
compared to the enrollment in higher level education for the overall academic fields, reflecting the potential contribution of the universities to the improvement of the quality of employment in those activities. Data to elaborate this analysis were extracted from the Brazilian Census of Higher Education conducted by the Ministry of Education. The share of the enrollment in higher level education in academic fields related to creative activities is higher in the South (9.1%) and in the Southeast (8.3%), when compared to the Midwest (7.1%), the Northeast (5.9%) and the North (5.6%). Considering these evidences, we can postulate that the formalization” of the labor market in creative activities tend to be positively correlated with the level of education of the employees in those activities and, additionally, with the enrollment in higher level education for academic fields related to those activities, which could generate proper qualified people to be absorbed by the labor market.
4.3. THE REGIONAL DISTRIBUTION OF SALARIES IN CREATIVE ACTIVITIES
The RAIS database also provides information about the amount of monthly salaries paid in creative activities. According to data from RAIS, in 2013 approximately 2.2% of the overall monthly remuneration were concentrated in creative activities, totaling approximately R$ 2.2 billion per month in 2013 (Table 5). Of this total, the largest share was concentrated on Software development (with 55.8% of the monthly remuneration in creative activities), followed by Radio and TV (17.2%), Publishing and Printing (13.1%), Advertising agencies (5.2%) and Film, Video and Music (2.4%). In terms of the regional relevance of creative activities, their share in the overall monthly remuneration is higher to the Southeast (2.9%), being particularly high to São Paulo (3.3%) and Rio de Janeiro (2.9%), followed by the South (1.8%) and by the Midwest (1.6%).
Rev
. Econ.
Contemp
., Rio de J
aneiro , v . 20, n. 3, p . 458-491, set-dez/2016 Total Publishing and Printing Film, video and music Radio and TV Software development Architectural services Advertising agencies Design and Interior decoration Photographic and similar activities Performing activities Activities related to cultural heritage membership organizations linked to culture and art Sub-total creative activities Creative activities /total
Rondônia 0.7% 0.2% 0.6% 0.5% 0.0% 0.0% 0.1% 0.2% 0.3% 0.2% 0.2% 0.0% 0.1% 0.5%
Acre 0.3% 0.0% 0.1% 0.2% 0.0% 0.1% 0.0% 0.2% 0.1% 0.0% 2.1% 0.3% 0.1% 0.6%
Amazonas 1.3% 0.7% 0.9% 1.1% 0.1% 1.2% 0.6% 0.1% 0.1% 5.7% 0.1% 0.2% 0.5% 0.9%
Roraima 0.2% 0.0% 0.1% 0.2% 0.0% 0.0% 0.0% 0.0% 0.1% 0.0% 0.1% 0.0% 0.0% 0.5%
Pará 2.1% 0.8% 0.9% 0.9% 0.3% 0.8% 0.7% 1.0% 1.1% 0.9% 13.0% 1.9% 0.7% 0.7%
Amapá 0.3% 0.0% 0.1% 0.1% 0.0% 0.1% 0.1% 0.0% 0.0% 0.1% 0.0% 0.2% 0.0% 0.3%
Tocantins 0.5% 0.1% 0.2% 0.2% 0.0% 0.1% 0.1% 0.1% 0.3% 0.1% 0.0% 0.0% 0.1% 0.4%
North 5.3% 1.8% 3.1% 3.1% 0.5% 2.3% 1.5% 1.7% 2.1% 6.9% 15.5% 2.7% 1.6% 0.6%
Maranhão 1.2% 0.2% 0.7% 0.8% 0.1% 0.9% 0.4% 0.7% 0.3% 0.3% 0.5% 0.2% 0.3% 0.5%
Piauí 0.7% 0.2% 0.3% 0.4% 0.0% 0.7% 0.2% 0.1% 0.4% 0.2% 2.0% 2.4% 0.2% 0.6%
Ceará 2.3% 1.4% 1.5% 1.3% 1.3% 1.8% 0.7% 2.3% 1.4% 1.4% 0.0% 8.8% 1.4% 1.3%
Rio Grande do Norte 1.1% 0.3% 1.0% 0.7% 0.4% 1.1% 0.4% 0.4% 0.6% 1.4% 0.5% 0.4% 0.5% 0.9%
Paraíba 1.0% 0.4% 0.7% 0.8% 0.2% 0.1% 0.2% 0.1% 0.4% 1.3% 0.0% 0.2% 0.4% 0.8%
Pernambuco 3.0% 2.3% 1.6% 1.7% 1.7% 2.1% 1.6% 0.6% 2.3% 2.4% 1.1% 1.3% 1.8% 1.3%
Alagoas 0.8% 0.1% 0.4% 0.5% 0.1% 0.3% 0.2% 0.1% 0.6% 0.2% 0.0% 0.2% 0.2% 0.5%
Sergipe 0.8% 0.3% 0.3% 0.4% 0.1% 0.6% 0.3% 0.0% 0.5% 0.6% 0.0% 0.2% 0.2% 0.6%
Bahia 3.9% 1.2% 1.8% 2.2% 1.3% 4.0% 1.8% 2.8% 2.2% 8.4% 1.7% 2.3% 1.6% 0.9%
Northeast 14.6% 6.5% 8.3% 8.7% 5.2% 11.6% 5.6% 7.2% 8.5% 16.3% 5.9% 15.9% 6.5% 1.0%
Minas Gerais 8.8% 5.4% 4.1% 4.7% 6.5% 6.3% 2.8% 3.9% 8.6% 8.8% 8.9% 6.6% 5.9% 1.5%
Espírito Santo 1.7% 1.5% 0.8% 1.3% 1.2% 1.0% 0.9% 0.9% 1.8% 0.5% 0.2% 2.9% 1.3% 1.6%
Rio de Janeiro 11.2% 11.6% 18.9% 29.1% 11.4% 18.5% 8.7% 11.7% 8.6% 18.6% 29.4% 8.9% 14.8% 2.9%
São Paulo 32.2% 51.9% 48.8% 33.0% 53.3% 45.5% 68.6% 53.5% 43.3% 29.5% 20.7% 48.5% 49.3% 3.3%
Southeast 53.8% 70.4% 72.6% 68.1% 72.4% 71.2% 80.9% 70.0% 62.3% 57.4% 59.1% 67.0% 71.3% 2.9%
Paraná 5.9% 7.7% 3.7% 4.3% 3.6% 3.4% 2.4% 7.1% 7.0% 8.1% 9.7% 4.9% 4.4% 1.6%
Santa Catarina 4.1% 2.4% 2.5% 2.6% 4.4% 2.5% 1.9% 6.6% 6.5% 2.1% 0.1% 2.5% 3.5% 1.9%
Rio Grande do Sul 6.0% 6.2% 3.8% 4.5% 5.7% 4.7% 2.8% 2.7% 7.9% 3.3% 5.3% 2.6% 5.3% 1.9%
South 16.0% 16.4% 10.1% 11.4% 13.6% 10.6% 7.1% 16.5% 21.3% 13.5% 15.2% 10.0% 13.2% 1.8%
Mato Grosso do Sul 1.2% 0.5% 0.8% 0.8% 0.4% 0.7% 0.4% 0.2% 0.6% 1.7% 0.6% 0.4% 0.5% 0.9%
Mato Grosso 1.5% 0.3% 1.4% 0.8% 0.6% 0.4% 0.4% 0.8% 0.9% 0.4% 0.1% 0.4% 0.6% 0.9%
Goiás 2.7% 1.4% 1.8% 1.6% 0.9% 1.5% 0.7% 2.1% 2.0% 2.3% 0.3% 0.6% 1.1% 0.9%
Distrito Federal 4.9% 2.8% 1.9% 5.5% 6.4% 1.7% 3.4% 1.6% 2.3% 1.6% 3.2% 3.0% 5.2% 2.3%
Midwest 10.2% 4.9% 5.9% 8.7% 8.3% 4.2% 4.8% 4.6% 5.8% 6.0% 4.3% 4.4% 7.5% 1.6%
TOTAL 101,491,948 288,125 53,630 378,568 1,224,553 19,631 114,788 6,188 22,308 34,441 22,032 31,970 2,196,234 2.2%
% creative activities in total 100.0% 0.3% 0.1% 0.4% 1.2% 0.0% 0.1% 0.0% 0.0% 0.0% 0.0% 0.0% 2.2%
% in creative activities 13.1% 2.4% 17.2% 55.8% 0.9% 5.2% 0.3% 1.0% 1.6% 1.0% 1.5% 100.0%
terms of the distribution by federative states in the region, 5.3% of the monthly remunerations in creative activities were concentrated in Rio Grande do Sul, 4.4% in Paraná and 3.5% in Santa Catarina. In terms of the relative share of the South, the most important activities were those of Photographic and similar activities (with 21.3% of the monthly remuneration concentrated in that region), Design and Interior decoration (16.5%) and Publishing and Printing (16.4 %). The Midwest region concentrated 7.5% of the monthly remunerations in creative activities, compared to 10.2% for the overall monthly salaries, making the participation of creative activities in that region reach 1.6%. In terms of the distribution by federative states in the region, 5.2% of monthly remunerations in creative activities were concentrated in the Federal District (Brasília) and 1.1% in Goiás. In terms of the relative share of the Midwest, the most important activities were those of Radio and TV (with 8.7% of the monthly remuneration concentrated in that region), Software development (8.3%), and Performing activities (6.0%). The Northeast region concentrated 6.5% of the monthly remunerations in creative activities, compared to 14.6% for the overall monthly salaries, making the participation of creative activities in that region reach 1.0%. In terms of distribution by federative states in the region, 1.8% of the monthly remuneration in creative activities was concentrated in Pernambuco, 1.6% in Bahia and 1.4% in Ceará. In terms of the relative participation of the Northeast, the most important activities were those of Performing activities (with 16.3% of the monthly remuneration concentrated in that region), Activities of membership organizations linked to culture and arts (15.9%), Architectural services (11.6%), Radio and TV (8.7%), and Film, video and music (8.3%). The North region concentrated 1.6% of the monthly remunerations in creative activities, compared to 5.3% for the overall monthly salaries, making the participation of creative activities in that region to reach 0.6%. In terms of distribution by federative states in the region, 0.7% of the monthly remuneration for creative activities was concentrated in Pará and 0.5% in the Amazonas. In terms of the relative share of the North, the most important activities were those of Activities related to cultural heritage (with 15.1% of the monthly remuneration concentrated in that region) and Performing activities (6.9%).
Rev
. Econ.
Contemp
., Rio de J
aneiro , v . 20, n. 3, p . 458-491, set-dez/2016 Total Publishing and Printing Film, video and music Radio and TV Software develop- ment Architec- tural services Advert- ising agencies Design and Interior decoration Photo- graphic and similar activities Perfor- ming activities Activities related to cultural heritage membership organizations linked to culture and art
Sub-total creative activities Creative activities /total Comp reg total Comp reg creative activities
Rondônia 1,903 1,276 1,292 1,595 1,533 968 1,399 909 891 942 1,962 687 1,437 75.5% 91.8% 44.7%
Acre 2,041 1,281 1,273 1,826 1,716 1,175 1,462 897 802 2,214 2,111 1,491 1,723 84.4% 98.4% 53.6%
Amazonas 2,020 1,974 1,147 2,152 1,817 1,570 1,980 1,009 914 2,383 968 1,568 1,977 97.9% 97.4% 61.5%
Roraima 2,186 1,044 951 1,824 1,949 798 1,041 881 679 1,326 1,910 1,513 69.2% 105.4% 47.0%
Pará 1,900 1,755 1,110 1,621 2,764 1,355 1,729 1,028 952 1,065 9,516 1,520 2,096 110.4% 91.6% 65.2%
Amapá 2,480 960 884 1,937 1,615 764 1,315 621 925 924 941 1,033 1,454 58.6% 119.6% 45.2%
Tocantins 1,883 1,932 1,202 1,943 1,745 1,097 1,350 732 854 925 1,108 674 1,679 89.2% 90.8% 52.2%
North 1,970 1,718 1,149 1,826 2,179 1,373 1,717 958 914 1,945 5,840 1,436 1,888 95.9% 95.0% 58.7%
Maranhão 1,654 1,341 1,062 1,726 1,724 1,142 1,514 1,051 798 963 1,562 1,162 1,525 92.2% 79.8% 47.4%
Piauí 1,630 1,253 997 1,954 1,436 916 1,123 786 922 896 1,577 1,196 1,399 85.8% 78.6% 43.5%
Ceará 1,542 1,574 1,117 2,043 2,300 1,628 1,508 1,664 836 936 698 1,365 1,864 120.9% 74.4% 57.9%
Rio Grande do Norte 1,736 1,545 1,071 1,852 2,426 1,894 1,366 866 839 1,210 1,014 936 1,798 103.6% 83.7% 55.9%
Paraíba 1,520 1,245 1,215 1,768 2,020 897 1,224 763 867 1,066 979 1,583 104.1% 73.3% 49.2%
Pernambuco 1,703 2,251 1,090 2,531 2,943 2,078 1,917 1,009 816 1,157 1,615 1,396 2,390 140.3% 82.1% 74.3%
Alagoas 1,548 1,095 1,002 1,990 1,545 1,157 924 1,061 867 886 745 877 1,475 95.3% 74.7% 45.9%
Sergipe 1,885 1,504 920 2,120 1,714 936 1,116 489 892 1,288 767 1,160 1,580 83.8% 90.9% 49.1%
Bahia 1,731 1,764 1,152 2,514 2,090 2,180 1,888 1,370 893 1,897 1,126 1,599 1,989 114.9% 83.5% 61.8%
Northeast 1,664 1,723 1,099 2,140 2,348 1,643 1,607 1,284 854 1,396 1,342 1,330 1,923 115.6% 80.2% 59.8%
Minas Gerais 1,762 2,098 1,170 2,211 3,107 1,587 1,589 1,118 942 1,506 2,608 2,068 2,489 141.2% 85.0% 77.4%
Espírito Santo 1,851 2,250 1,230 2,359 3,059 1,482 2,153 1,061 983 997 1,596 1,693 2,484 134.2% 89.3% 77.2%
Rio de Janeiro 2,467 3,089 2,136 6,703 3,906 2,245 3,799 1,782 1,187 1,989 6,233 2,003 4,083 165.5% 119.0% 126.9%
São Paulo 2,328 3,490 2,360 3,717 4,422 2,899 5,096 1,932 1,465 2,190 2,913 1,919 3,925 168.6% 112.3% 122.0%
Southeast 2,219 3,218 2,156 4,281 4,146 2,495 4,521 1,814 1,304 1,968 3,859 1,932 3,738 168.4% 107.0% 116.2%
Paraná 1,927 2,453 1,332 2,498 2,474 1,758 2,371 1,958 1,223 2,643 2,180 1,338 2,345 121.7% 92.9% 72.9%
Santa Catarina 1,865 1,758 1,406 1,882 3,100 1,541 1,806 2,630 1,191 1,259 1,483 1,235 2,463 132.1% 89.9% 76.6%
Rio Grande do Sul 1,982 1,816 1,398 1,884 3,789 1,365 2,275 1,568 1,073 1,301 2,868 1,138 2,595 130.9% 95.6% 80.7%
South 1,931 2,058 1,375 2,075 3,127 1,514 2,159 2,086 1,154 1,861 2,370 1,255 2,472 128.0% 93.1% 76.9%
Mato Grosso do Sul 1,897 1,432 1,340 1,926 1,639 1,336 1,246 1,136 984 1,551 2,196 1,158 1,617 85.2% 91.5% 50.3%
Mato Grosso 1,895 1,333 1,169 1,824 3,078 1,014 1,184 1,129 942 1,105 1,778 1,382 2,092 110.4% 91.4% 65.0%
Goiás 1,791 1,898 1,346 2,129 2,105 1,168 1,676 1,393 961 1,369 1,153 1,232 1,912 106.8% 86.4% 59.5%
Distrito Federal 3,783 3,681 1,385 5,336 4,146 1,445 3,734 1,318 1,222 1,599 3,653 2,081 4,046 106.9% 182.4% 125.8%
Midwest 2,438 2,411 1,309 3,290 3,447 1,271 2,503 1,302 1,047 1,453 2,846 1,715 3,004 123.2% 117.6% 93.4%
TOTAL 2,073 2,725 1,792 3,356 3,751 2,099 3,636 1,742 1,190 1,795 3,302 1,694 3,216 155.1% 100.0% 100.0%
% creative activities
in total 100.0% 131.4% 86.4% 161.8% 180.9% 101.2% 175.3% 84.0% 57.4% 86.6% 159.2% 81.7% 155.1%
% in creative activities 84.7% 55.7% 104.3% 116.6% 65.3% 113.0% 54.2% 37.0% 55.8% 102.7% 52.7% 100.0%
Concerning the regional distribution, a higher monthly salary (R$ 3,738) was observed in the Southeast, where we can also observe a high positive differential between the remuneration in creative activities and in the overall activities, which reached 68.4%. This trend also occurred in the Midwest, where the remuneration in creative activities reached R$ 3,004, a figure 23.2% higher than in the overall activities in the region. In the South, the remuneration in creative activities reached R$ 2,472, a figure 28.0% higher than in the overall activities. In the Northeast, these values reached R$ 1,923 and 15.6%, respectively. Contrasting to the other regions, in the North the remuneration generated in creative activities reached R$ 1,888, a figure 4.1% lower than that observed in the overall activities.
Among the selected activities, the higher average monthly salaries were observed in the case of Radio and TV, in Rio de Janeiro (R$ 6,703) and in the Federal District (R$ 5,336). In Advertising agencies, higher salaries levels were observed in São Paulo (R$ 5,096). In Software development, higher salaries were observed in São Paulo (R$ 4,422) and in the Federal District (R$ 4,146). In contrast, those salaries were particularly low for the sectors of Design and Interior decoration and for Photographic and similar activities in the Northeast and in the North. In the Northeast, the salaries paid in Design and Interior decoration reached R$ 1,284, while in the Photographic and similar activities they reached R$ 854. In the North region, the salaries paid in the sector of Design and Interior decoration reached R$ 958 while in the Photographic and similar activities they reached R$ 914.
4.4. SECTORAL AND REGIONAL CONCENTRATION INDEXES IN CREATIVE ACTIVITIES
Rev
. Econ.
Contemp
., Rio de J
aneiro
, v
. 20,
n.
3,
p
. 458-491,
set-dez/2016
Year 2006 2010 2013 Var 2006 2010 2013 Var 2006 2010 2013 Var
Publishing and Printing 109,362 114,910 105,744 -3% 180,808 250,311 288,125 59% 1,653 2,178 2,725 65%
Film, video and music 21,056 24,528 29,921 42% 22,560 34,090 53,630 138% 1,071 1,390 1,792 67%
Radio and TV 82,490 108,177 112,820 37% 168,725 284,142 378,568 124% 2,045 2,627 3,356 64%
Software development 158,747 255,876 326,438 106% 345,763 740,993 1,224,553 254% 2,178 2,896 3,751 72%
Architectural services 9,066 12,132 9,351 3% 12,905 23,991 19,631 52% 1,423 1,977 2,099 48%
Advertising agencies 26,877 30,896 31,574 17% 49,115 79,980 114,788 134% 1,827 2,589 3,636 99%
Design and Interior decoration 1,862 2,354 3,552 91% 1,286 3,047 6,188 381% 691 1,294 1,742 152%
Photographic and similar activities 12,601 17,931 18,741 49% 8,872 16,884 22,308 151% 704 942 1,190 69%
Performing activities 11,740 15,486 19,190 63% 11,809 21,200 34,441 192% 1,006 1,369 1,795 78%
Activities related to cultural heritage 6,158 6,832 6,673 8% 10,172 18,016 22,032 117% 1,652 2,637 3,302 100%
Organizations linked to culture and art 12,426 17,516 18,876 52% 12,181 23,105 31,970 162% 980 1,319 1,694 73%
Creative Activities 452,385 606,638 682,880 51% 824,197 1,495,760 2,196,234 166% 1,822 2,466 3,216 77%
Manufacture sectors 7,122,536 8,499,202 8,998,796 26% 8,869,054 14,151,537 19,717,026 122% 1,245 1,665 2,191 76%
Services sectors 18,951,696 23,268,395 26,066,422 38% 25,415,751 42,504,082 61,505,731 142% 1,341 1,827 2,360 76%
Total 35,155,249 44,068,355 48,948,433 39% 41,116,759 69,999,187 101,491,948 147% 1,170 1,588 2,073 77%
% of Creative activities 1.29% 1.38% 1.40% 9% 2.00% 2.14% 2.16% 8% 1.56 1.55 1.55 -1%
salaries were the Design and Interior Decoration (152.2%), Activities related to cultural heritage (99.9%), Advertising agencies (98.9 %) and Performing activities (78.4%). In this case, creative activities showed a similar growth in the period 2006‑2013, when compared to the overall activities.
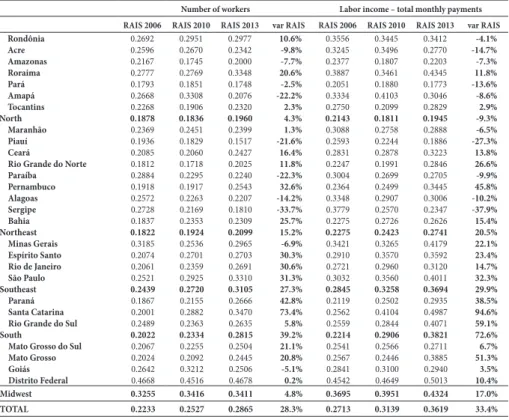
Table 8 – Index of regional concentration of creative activities based on distribution among federative states – Herfindhal Index (HHI) (2006, 2010 and 2013)
Number of workers Labor income – total monthly payments.
2006 2010 2013 Var 2006 2010 2013 Var
Publishing and Printing 0.2096 0.2048 0.2003 ‑4.5% 0.3087 0.2982 0.2979 ‑3.5%
Film, video and music 0.1971 0.1848 0.1774 ‑10.0% 0.3002 0.2770 0.2811 ‑6.3%
Radio and TV 0.1323 0.1426 0.1328 0.4% 0.2154 0.2196 0.2051 ‑4.8%
Software development 0.2167 0.2481 0.2368 9.3% 0.3158 0.3340 0.3125 ‑1.0%
Architectural services 0.1636 0.1732 0.1590 ‑2.8% 0.2217 0.2197 0.2528 14.0%
Advertising agencies 0.2213 0.2509 0.2599 17.5% 0.4225 0.4620 0.4823 14.2%
Design and Interior decoration 0.3118 0.2040 0.2605 ‑16.4% 0.3444 0.2746 0.3142 ‑8.8%
Photographic and similar activities 0.1336 0.2148 0.1639 22.7% 0.2052 0.2849 0.2202 7.3%
Performing activities 0.1500 0.1329 0.1169 ‑22.1% 0.1830 0.1623 0.1501 ‑18.0%
Activities related to cultural heritage 0.1771 0.1424 0.1266 ‑28.5% 0.2885 0.1606 0.1687 ‑41.5%
Organizations linked to culture and art 0.0987 0.1560 0.2146 117.5% 0.1276 0.1943 0.2627 105.9%
Sub-total creative activities 0.1781 0.2014 0.1977 11.0% 0.2699 0.2851 0.2788 3.3%
Sub-total manufacture 0.1607 0.1567 0.1493 -7.1% 0.2297 0.2131 0.1943 -15.4%
Sub-total services 0.1153 0.1167 0.1156 0.3% 0.1339 0.1290 0.1259 -6.0%
Total 0.1250 0.1234 0.1202 -3.9% 0.1552 0.1468 0.1403 -9.6%
Source: Author’s elaboration based on data from RAIS (2006, 2010, 2013).
and similar activities and Advertising agencies. In contrast, to other activities occurred a decrease in the territorial concentration, as in the case of Film, video and music, Publishing and Printing, Performing activities and Activities related to cultural heritage.
Table 9 – Index of sectoral concentration among creative activities – Herfindhal Index (HHI) – 2006, 2010 and 2013
Number of workers Labor income – total monthly payments
RAIS 2006 RAIS 2010 RAIS 2013 var RAIS RAIS 2006 RAIS 2010 RAIS 2013 var RAIS
Rondônia 0.2692 0.2951 0.2977 10.6% 0.3556 0.3445 0.3412 -4.1%
Acre 0.2596 0.2670 0.2342 -9.8% 0.3245 0.3496 0.2770 -14.7%
Amazonas 0.2167 0.1745 0.2000 -7.7% 0.2377 0.1807 0.2203 -7.3%
Roraima 0.2777 0.2769 0.3348 20.6% 0.3887 0.3461 0.4345 11.8%
Pará 0.1793 0.1851 0.1748 -2.5% 0.2051 0.1880 0.1773 -13.6%
Amapá 0.2668 0.3308 0.2076 -22.2% 0.3334 0.4103 0.3046 -8.6%
Tocantins 0.2268 0.1906 0.2320 2.3% 0.2750 0.2099 0.2829 2.9%
North 0.1878 0.1836 0.1960 4.3% 0.2143 0.1811 0.1945 -9.3%
Maranhão 0.2369 0.2451 0.2399 1.3% 0.3088 0.2758 0.2888 -6.5%
Piauí 0.1936 0.1829 0.1517 -21.6% 0.2593 0.2244 0.1886 -27.3%
Ceará 0.2085 0.2060 0.2427 16.4% 0.2831 0.2878 0.3223 13.8%
Rio Grande do Norte 0.1812 0.1718 0.2025 11.8% 0.2247 0.1991 0.2846 26.6%
Paraíba 0.2884 0.2295 0.2240 -22.3% 0.3004 0.2699 0.2705 -9.9%
Pernambuco 0.1918 0.1917 0.2543 32.6% 0.2364 0.2499 0.3445 45.8%
Alagoas 0.2572 0.2263 0.2207 -14.2% 0.3348 0.2907 0.3006 -10.2%
Sergipe 0.2728 0.2169 0.1810 -33.7% 0.3779 0.2570 0.2347 -37.9%
Bahia 0.1837 0.2353 0.2309 25.7% 0.2275 0.2726 0.2626 15.4%
Northeast 0.1822 0.1924 0.2099 15.2% 0.2275 0.2423 0.2741 20.5%
Minas Gerais 0.3185 0.2536 0.2965 -6.9% 0.3421 0.3265 0.4179 22.1%
Espírito Santo 0.2074 0.2701 0.2703 30.3% 0.2910 0.3570 0.3592 23.4%
Rio de Janeiro 0.2061 0.2359 0.2691 30.6% 0.2721 0.2960 0.3120 14.7%
São Paulo 0.2521 0.2925 0.3310 31.3% 0.3032 0.3560 0.4011 32.3%
Southeast 0.2439 0.2720 0.3105 27.3% 0.2845 0.3258 0.3694 29.9%
Paraná 0.1867 0.2155 0.2666 42.8% 0.2119 0.2502 0.2935 38.5%
Santa Catarina 0.2001 0.2882 0.3470 73.4% 0.2562 0.4104 0.4987 94.6%
Rio Grande do Sul 0.2489 0.2363 0.2635 5.8% 0.2559 0.2844 0.4071 59.1%
South 0.2022 0.2334 0.2815 39.2% 0.2214 0.2906 0.3821 72.6%
Mato Grosso do Sul 0.2067 0.2255 0.2504 21.1% 0.2541 0.2566 0.2711 6.7%
Mato Grosso 0.2024 0.2092 0.2445 20.8% 0.2567 0.2446 0.3885 51.3%
Goiás 0.2642 0.3212 0.2506 -5.1% 0.2841 0.3100 0.2940 3.5%
Distrito Federal 0.4668 0.4516 0.4678 0.2% 0.4542 0.4649 0.5013 10.4%
Midwest 0.3255 0.3416 0.3411 4.8% 0.3695 0.3951 0.4324 17.0%
TOTAL 0.2233 0.2527 0.2865 28.3% 0.2713 0.3139 0.3619 33.4%
Source: Author’s elaboration based on data from Census (2010) and RAIS (2006, 2010, 2013).
regions. The South region is where these rates have risen more, with the sectoral concentration index increasing 39.2% for the jobs and 72.6% for the remunerations between 2006 and 2013. In the Southeast also occurred a significant increase of those indexes, which reached 27.3% for jobs and 29.9% for the remunerations between 2006 and 2013. In those regions, those rates have risen for all federative states over that period. In contrast, in the Northeast, North and Midwest regions the indexes of sectoral concentration to jobs and remunerations had a much lower growth over the period considered, and some federative states experienced a decrease of those indexes.
4.4. RELATIVE PRODUCTIVE SPECIALIZATION IN CREATIVE ACTIVITIES
We can also articulate the analysis of the sectoral concentration among cultural activities in regions and federative states to an analysis of their productive specialization in different groups of creative activities. To develop this analysis, we opted to group the creative activities in three blocks: 1) General Media, including Publishing and Printing; Film, video and music; Radio and TV; Advertising agencies; Photographic and similar activities; 2) Information Technologies, including the Software development; 3) Architecture, Design and Arts, including Architectural services; Design and Interior decoration; Performing activities; Activities related to cultural heritage; Activities of membership organizations linked to culture and art. The identification of productive specialization uses data collected from the RAIS for the years 2006 and 2013, covering the number of employees and the total amount of remuneration received in each one of those blocks of creative activities, presented in Table 10. The existence of a process of productive specialization in the blocks of creative activities for regions and federative states were evaluated recurring to a traditional tool applied to regional economic studies, based on the calculus of a Relative Specialization Index (QL) that try to consider the relative weight of the indicator (number of employees or amount of remuneration received) in each field of economic activity for the regions and federative states, when compared to the same weight for the whole country.