352
Kunz et al. Nitrogen removal from swine wastewater
Scientia Agricola
ABSTRACT: Effluents from swine raising can be harmful to the environment if not correctly managed. Nitrogen (N) is usually the main element present at high concentrations in the effluent. Since the use as biofertilizer is not always a feasible alternative, the treatment of swine wastewater is necessary. Variations in N species and water solubility make the treatment difficult and expensive. Additional N removal at low cost via denitrification may be possible by recirculating nitrified effluent in the barns. In this study, raw manure (RM) was homogenized with treated effluent (TE) at RM/(RM + TE) ratios of 1.0, 0.9, 0.8, 0.7, 0.6, 0.5 and 0 in order to simulate the effect of reused water on swine wastewater nitrogen removal. Samples were collected daily during four days and analyzed for pH, oxidation-reduction potential, NH4-N, NO2-N, NO3-N and chemical oxidation demand. The oxidized nitrogen (NOx-N) half-life degradation was estimated using linear regression. NOx-N
species half-life less than one day was obtained when treated effluent was combined and thoroughly homogenized with raw manure. It is suggested that combining raw manure with treated effluent (e.g. water reuse) can be a simple and cost-effective strategy to remove nitrogen from swine wastewaters.
Keywords: nutrient removal, swine effluent, treatment, water reuse
Introduction
Swine raising has changed considerably in the last 30 years with an increase in intensive production sys-tems. Whereas intensive systems minimize production costs, the high animal densities can pose impacts to en-vironments that have low soil absorption capacity (Kunz et al., 2009a; Vanotti et al., 2009). Thus, confined animal feeding operations (CAFOs) while reducing the produc-tion costs can increase the use of water and the environ-mental impacts associated with the residues generated during production (Bradford et al., 2008).
The need for swine manure treatment is usually dependent on factors such as soil/plant nutrient absorp-tion capacity and land availability. Nitrogen is usually the most critical compound that needs to be removed due to its relatively high concentrations, treatability limitations and high costs of removal (Vanotti and Szogi, 2008).
Conventional nitrogen removal technologies are commonly based on aerobic autotrophic nitrification (i.e., nitrification) followed by anoxic heterotrophic pro-cess (i.e., denitrification). The reactions involved in both steps are shown in Equations 1 to 4. These processes are generally performed using separate reactors and the car-bon for denitrification is obtained from the organic mat-ter in the swine effluent (Ahn, 2006; Zhu et al., 2008).
NH4+ + 1.5O
2→ NO2
- + 2H+ + H
2O (1)
NO2 - + 0.5O
2→ NO3
- (2)
2NO3- + 10H+ + 10e-→ N
2 + 2HO
- + 4H
2O (3)
2NO2- + 6H+ + 6e-→ N
2 + 2HO
- + 2H
2O (4)
Received June 01, 2011 Accepted April 27, 2012
1Embrapa Suínos e Aves, Rod. 153, km 110,
C.P. 21 – 89700-000 – Concórdia, SC – Brasil.
2UNIOESTE/RHESA, R. Universitária, 2069 – 85819-110
– Cascavel, PR – Brasil.
*Corresponding author <[email protected]>
Edited by: José Euclides Stipp Paterniani
Nitrogen removal from swine wastewater by combining treated effluent with raw manure
Airton Kunz1*, Ricardo Steinmetz1, Simone Damasceno2, Arlei Coldebela1
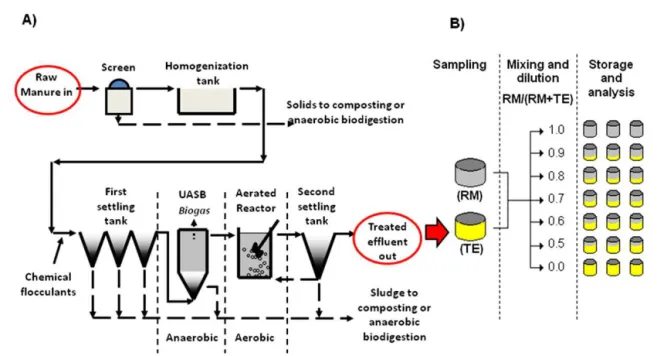
Treatment technologies should rely on the pos-sibility of water reuse to minimize high quality water demand for barns washing and manure flush. A possibil-ity that can be considered is to have the denitrification process occurring directly in the pits using the organic carbon present in raw manure. This strategy can reduce the costs of treatment facilities and clean water input for swine production (O´Connor et al., 2008; Vanotti et al., 2009). It avoids the use of high quality water for manure management, observing the biosecurity criteria, reduc-ing the demand of water for swine production (Vanotti et al., 2005).
This study aimed to evaluate the potential for wa-ter reuse at swine barns as a strategy for denitrification enhancement and to study the effectiveness of nitrogen removal from swine wastewaters in swine facilities by simulating pit conditions and combining treated effluent with raw manure.
Materials and Methods
Sampling and storage
The raw swine manure used in this study was collected from an experimental swine production sys-tem located in Concórdia, Santa Catarina State,
Bra-zil (27º18’ S, 51º59’ W). Raw manure produced in the
Experimental design
To mimic the pit storage processes and investi-gate the denitrification potential after adding the nitri-fied effluent to raw manure, raw manure was mixed with treated effluent at different ratios [raw manure/ (raw manure + treated effluent)] of 1.0, 0.9, 0.8, 0.7, 0.6, 0.5 and 0 to simulate different reuse conditions. The mixed effluent was stored in triplicate in 20 L polyethylene buckets (Figure 1B) at room temperature during five days. From these stored buckets, 100 mL of the homogenized samples were collected every 24 hours and analyzed for pH, oxidation-reduction poten-tial (ORP), ammonia (NH3-N), nitrite (NO2-N), nitrate
(NO3-N) and chemical oxygen demand (COD). All
anal-yses were performed according to APHA (1995). NOx-N
concentration was obtained by adding up NO2-N and
NO3-N concentrations.
Results obtained at different mixing ratios of raw manure with treated effluent are important to help un-derstand what will happen with the treated effluent when reused in the barns, especially for the fate of ni-trogen. For instance, when reused to wash the swine facilities and flush the manure. In this study, raw ma-nure was combined to treated effluent at different ratios varying from 0 to 50 % (v v–1). These dilution ratios are
consistent with wastewater reuse, especially in Brazilian CAFOs, when considering the water demand for manag-ing manure in the houses (Perdomo et al., 2003).
Data analysis
Nitrogen removal rates were estimated using lin-ear regression of the raw manure/(raw manure + treated effluent) ratios according to Equation 5:
y = a+bt +e (5)
Where y is the observed value from the variables
of interest (NO2-N and ∑NOx-N) transformed into
natu-ral logarithm; α is the day zero concentration logarithm;
β represents the degradation constant, t the time; e is the random error distributed independently and identi-fied. The effect of β was tested by the F-test.The above model estimates the half-life of each effl uent concentra-the half-life of each effluent concentra-tion from exponential first-order regression analyses as demonstrated in Equation 6 (Pedersen, 2009) and its con-fidence interval by t distribution. Data values equal to zero were neglected.
(6)
Results and Discussion
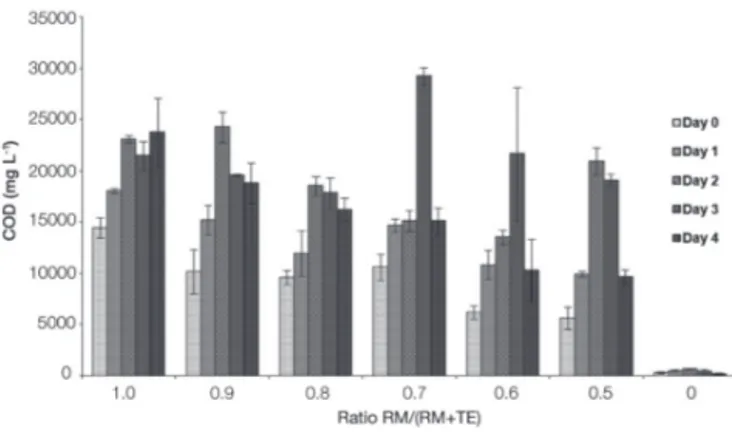
Variations in COD (Figure 2) and NH3-N (Figure 3) concentrations were high for all mixture ratios tested. These variations were likely due to hydrolysis and dis-solution caused by biodegradation of carbon-rich fresh manure (Kunz et al., 2009b, Markevich et al., 2010). In-creasing ammonium concentrations lead to ammonifica-tion (free amino acids are produced by enzymatic pro-tein hydrolysis) that is favored in reducing conditions (low ORP) (Figure 4) typically observed in swine efflu-ents (Cantrell et al., 2008; Garcia and Angenent, 2009). Except for treated effluent (ratio 0), pH decreased in all mixture ratios (Figure 5), probably due to sub-strate hydrolysis and formation of volatile fatty acids as byproducts from bacterial metabolism (Kashyap et al., 2003). For treated effluent, the content of organic matter is very low (Figure 2) favoring autotrophic processes like algae proliferation, which can be the responsible for pH increasing (Zanotelli et al., 2002).
354
Kunz et al. Nitrogen removal from swine wastewater
NOx-N depletion was found when fresh manure was combined with the nitrified treated swine effluent (Figure 6). NOx-N species (NO3-N + NO2-N) reduction was observed (p < 0.0001) for all tested mixture ratios,
except for ratios 0.9 and 1.0. Thus, NOx-N was not
ob-served in the samples after 48 h of experiment for ratios between 0.6 and 0.8. NOx-N concentrations were not detected at all times at the 1.0 ratio. NO2-N and NOx-N concentrations in raw manure were negligible due to the reducing conditions (Figure 4) that prevent generation of these oxidized species. For the 0.9 ratio the NOx-N con-centrations were close to the detection limit of chemi-cal analysis for zero and one day and not detected for sequential times.
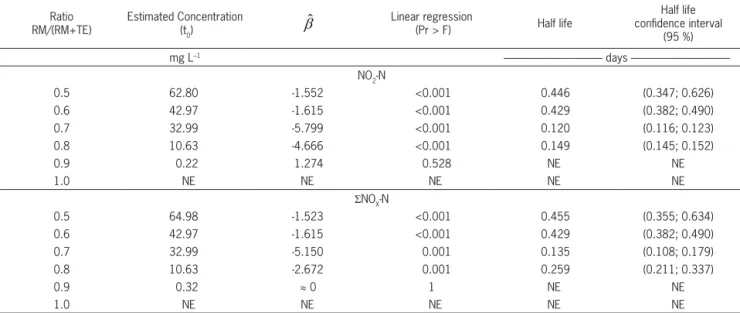
Table 1 shows the half-life for different raw ma-nure and treated effluent ratios. Similar concentrations of NO2-N and NOx-N were estimated using α from Equation 5. Although NOx-N was detected at the first days in the 0.9 treatment, the very low concentration did not allow for half-life estimation (p > 0.05). NO2
-N and -NOx-N half-life, resulting from slope ( ), were
lower than 0.5 days for the treatments between 0.5 and 0.8 ratios.
Figure 2 – Chemical Oxigen Demand (COD) concentration for ratios of raw manure (RM) and treated effluent (TE), during four days. Bars represent the average and lines represent the standard deviation of 3 samples.
Figure 3 – Ammonia (NH3 -N) concentration for ratios of raw manure (RM) and treated effluent (TE), during four days. Bars represent the average and lines represent the standard deviation (n = 3).
Figure 5 – pH variation for different ratios of raw manure (RM) and treated effluent (TE), during four days. Bars represent the average and lines represent the standard deviation (n = 3).
Figure 6 – Nitrogen oxidized species concentration (NOx-N) observed for ratios of raw manure (RM) and treated effluent (TE), during four days. Points represent the average and vertical lines represent the standard deviation (n = 3).
Figure 4 – Oxidation-reduction potential (ORP) variation for ratios of raw manure (RM) and treated effluent (TE), during four days. Bars represent the average and lines represent the standard deviation (n = 3).
day) was observed, allowing conditions for NOx-N ex-tinction in approximately 2 days.
The heterotrophic medium in raw manure offered good conditions for quick nitrogen removal under anoxic conditions. The chemical reducing conditions in raw ma-nure, shown as negative ORP values in Figure 4, ben-efited NOx-N removal when mixed with nitrified effluent due to the oxidation of the organic carbon using nitrogen oxidized species as an electron acceptor (Gilbert et al., 2008; Vanotti and Szogi, 2008). Heterotrophic micro-organisms have a very high growing rate which favors denitrification processes (Potter et al., 1998; Ahn, 2006). The specific growth rate (µmax) for NO3– and NO
2 –
re-duction are 2.6 d–1 and 1.5 d–1, respectively. These are
significantly higher than µmax for nitrification (µmaxNH4
oxidation = 0.77 d
–1 and µmax NO2
–
oxidation = 1.08 d
–1)
(Wies-mann, 1994).
Another factor that influences denitrification is the C/N ratio. For a good nitrogen removal efficiency, the C/N ratio must be higher than 3.5 (Grady Jr. et al., 1999; Ahn, 2006; Ginige et al., 2009). In this study (Table 2),
the COD/NOx-N was extremely high for all mixtures and
dates; they ranged from 89 to 43,514.
High C/N ratios can also hinder the generation of
N2O, an important greenhouse gas (Ravishankara et al.,
2009) that is produced in low C/N ratio environments. Bernet et al. (1996) studied the denitrification of piggery wastewater and concluded that when TOC/N was
be-tween 1.6 and 2.4 (COD/N bebe-tween 4.26 and 6.4), N2O
emission was observed, but when TOC/N was higher than 2.4, N2O was not emitted. Itokawa et al. (2001) investigating the nitrous oxide production under low COD/N ratios conditions concluded that 20-30 % of the total influent nitrogen was emitted as N2O with influent COD/N less than 3.5.
Table 1 – Nitrogen concentration as NO2-N and NOX-N in the RM/(RM+TE) ratios, ( b) estimative of the degradation half life and half life confidence interval.
Ratio RM/(RM+TE)
Estimated Concentration (t0)
Linear regression
(Pr > F) Half life
Half life confidence interval
(95 %) mg L–1 days
NO2-N
0.5 62.80 -1.552 <0.001 0.446 (0.347; 0.626)
0.6 42.97 -1.615 <0.001 0.429 (0.382; 0.490)
0.7 32.99 -5.799 <0.001 0.120 (0.116; 0.123)
0.8 10.63 -4.666 <0.001 0.149 (0.145; 0.152)
0.9 0.22 1.274 0.528 NE NE
1.0 NE NE NE NE NE
ΣNOX-N
0.5 64.98 -1.523 <0.001 0.455 (0.355; 0.634)
0.6 42.97 -1.615 <0.001 0.429 (0.382; 0.490)
0.7 32.99 -5.150 0.001 0.135 (0.108; 0.179)
0.8 10.63 -2.672 0.001 0.259 (0.211; 0.337)
0.9 0.32 ≈ 0 1 NE NE
1.0 NE NE NE NE NE
RM: Raw manure, TE: Treated effluent, NE: Not estimated, ≈ 0: Approximately zero.
Conclusions
NOx-N can easily and quickly be removed from
swine effluents by mixing raw manure with treated
ef-fluent. High NOx depletion due to denitrification was
observed for all RM/(RM+TE) ratios tested with half-life less than 12 h which is within a reasonable time considering the manure management in the swine production facilities.
It is possible to remove nitrogen by carbon-rich manure degrading bacteria during denitrifica-tion. This can minimize the input of treated water in CAFOs by reusing the nitrified effluent at different ratios back in the barns for cleaning and flush the manure.
Acknowledgements
To Dr. Marcio L.B. da Silva, for his comments on an early draft. Airton Kunz and Simone Dasma-sceno were financially supported by the Brazilian National Council for Scientific and Technological De-velopment (CNPq).
Table 2 – Observed Chemical Oxidation Demand (COD) and Oxidized Nitrogen (NOX-N) ratios at different experimental conditions.
Ratio
RM/(RM+TE) Day 0 Day 1 Day 2 Day 3 Day 4
0.9 43514 41455 24253 19548 18807
0.8 902 14917 18540 17833 16240
0.7 318 48867 15127 29227 15100
0.6 144 1255 13507 21680 10303
0.5 89 404 10292 13946 9650
356
Kunz et al. Nitrogen removal from swine wastewater
References
Ahn, Y. 2006. Sustainable nitrogen elimination biotechnologies: a review. Process Biochemistry 41: 1709–1721.
American Public Health Association [APHA]. 1995. Standard Methods for the Examination of Water and Wastewater. 19ed. American Public Health Association, Washington, DC, USA. Bernet, N.; Delgenes, N.; Moletta, R. 1996. Denitrification
by anaerobic sludge in piggery wastewater. Environmental Technology 17: 293–300.
Bradford, S.A.; Segal, E.; Zheng, W.; Wang, Q.; Hutchins, S.R. 2008. Reuse of concentrated animal feeding operation wastewater on agricultural lands. Journal of Environmental Quality 37 (supplement): S-97–S-115.
Cantrell, K.B.; Ducey, T.; Ro, K.S.; Hunt, P.G. 2008. Livestock waste-to-bioenergy generation opportunities. Bioresource Technology 99: 7941–7953.
Kashyap, D.R.; Dadhich, K.S.; Sharma, S.K. 2003. Biomethanation under psychrophilic conditions: a review. Bioresource Technology 87: 147–153.
Kunz, A.; Miele, M.; Steinmetz, R.L.R. 2009a. Advanced swine manure treatment and utilization in Brazil. Bioresource Technology 100: 5485–5489.
Kunz, A.; Steinmentz, R.L.R.; Ramme, M.; Coldebela, A. 2009b. Effect of storage time on swine manure solid separation efficiency by screening. Bioresource Technology 100: 1815– 1818.
Garcia, M.L.; Angenent, L.T. 2009. Interaction between temperature and ammonia in mesophilic digesters for animal waste treatment. Water Research 43: 2373–2382.
Gilbert, Y.; Bihan, Y.L.; Aubry, G.; Veillette, M.; Duchaine, C.; Lessard, P. 2008. Microbiological and molecular characterization of denitrification in biofilters treating pig manure. Bioresource Technology 99: 4495–4502.
Ginige, M.P.; Bowyer, J.C.; Foley, L.; Keller, J.; Yuan, Z. 2009. A comparative study of methanol as a supplementary carbon source for enhancing denitrification in primary and secondary anoxic zones. Biodegradation 20: 221–234.
Grady Jr., C.P.L.; Daigger, G.T.; Lim, H.C. 1999. Biological wastewater treatment. 2ed. Marcel Dekker, New York, NY, USA.
Itokawa, H.; Hanaki, K.; Matsuo, T. 2001. Nitrous oxide production in high-loading biological nitrogen removal process under low COD/N ratio condition. Water Research 20: 657–664.
Markevich, H.A.; Pell, A.N.; Mbugua, D.M.; Cherney, D.J.R.; Van Es, H.M.; Lehmann, M.; Robertson, J.B. 2010. Effects of storage methods on chemical composition of manure and manure decomposition in soil in small-scale Kenyan systems. Agriculture, Ecosystems & Environmental 139: 134–141. O’Connor, G.A.; Elliot, H.A.; Bastian, R.K. 2008. Degraded water
reuse: an overview. Journal of Environmental Quality 37 (supplement): S-157–S-169.
Pedersen, L.; Pedersen, P.B.; Nielsen, J.L.; Nielsen, P.H. 2009. Peracetic acid degradation and effects on nitrification in recirculating aquaculture systems. Aquaculture 296: 246–254. Perdomo, C.C.; Oliveira, P.A.V.; Kunz, A. 2003. Suggested
methodology to estimate volume and pollutant load in a swine production farm. Embrapa Suínos e Aves, Concórdia, SC, Brazil. 6p. (Comunicado Técnico, 332) (in Portuguese). Potter, T.G.; Tseng, C.; Koopman, B. 1998. Nitrogen removal in
a partial nitrification/complete denitrification process. Water Environmental Research 70: 334–341.
Ravishankara, A.R.; Daniel, J.S.; Portmann, R.W. 2009. Nitrous oxide (N2O): the dominant ozone-depleting substance emitted in 21st century. Science 326: 123–125.
Vanotti, M.B.; Millner, P.D.; Hunt, P.G.; Ellison, A.Q. 2005. Removal of pathogen and indicator microorganisms from liquid swine manure in multi-step biological and chemical treatment. Bioresource Technology 96: 209–214.
Vanotti, M.; Szogi, A.; Bernal, M.P.; Martinez, J. 2009. Livestock waste treatment systems of the future: A challenge to environmental quality, food safety, and sustainability. Bioresource Technology 100: 5371–5373.
Vanotti, M.; Szogi, A. 2008. Water quality improvements of wastewater from confined animal feeding operations after advanced treatment. Journal of Environmental Quality 37: S86–S96.
Wiesmann, U. 1994. Biological nitrogen removal from wastewater. Advances in Biochemical Engineering/Biotechnology. Springer, Berlin, Germany.
Zanotelli, C.T.; Medri, W.; Belli Filho, P.; Perdomo, C.C.; Mulinari, M.R.; Costa, R.H.R. 2002. Performance of a baffled facultative pond treating piggery wastes. Water Science and Technology 45: 49–53.