Engenharia Agrícola
ISSN: 1809-4430 (on-line)
www.engenhariaagricola.org.br
2Federal University of Technology - Paraná, UTFPR/PPGEA/ Francisco Beltrão - PR, Brazil. 3 Federal University of Technology - Paraná, UTFPR/ Dois Vizinhos - PR, Brazil.
4 University of the Contestado/ Concórdia - SC, Brazil. 5 Embrapa Suínos e Aves/ Concórdia - SC, Brazil.
Doi: http://dx.doi.org/10.1590/1809-4430-Eng.Agric.v38n6p968-977/2018
SWINE WASTEWATER NITROGEN REMOVAL AT DIFFERENT C/N RATIOS USING THE
MODIFIED LUDZACK-ETTINGER PROCESS
Adelcio Giongo
1*, Marcelo Bortoli
2, Marina Celant De Prá
3, Marcos Veruck
4, Airton Kunz
51*Corresponding author. State University of Paraná, University Garden - Development Prototypes Building/ Cascavel - PR, Brazil.
E-mail: [email protected]
KEYWORDS
nitritation/denitritation,
nitrification/denitrification,
biological nitrogen
removal, total organic
carbon consumption,
animal production
wastewater
ABSTRACT
The swine industry has been presented strong growth and thus is producing large
volumes of effluents that must be correctly management. Nitritation/denitritation
process can be used to improve system performance, saving the energy cost with
aeration and with the external source of carbon due to the lower C/N
requirement.
The aim of this study was to evaluate swine wastewater Nitrification/Denitrification
(NDF) and Nitritation/denitritation (NDT) processes at different C/N ratios, using the
Modified Ludzack-Ettinger (MLE) process, in order to obtain a system with efficient
nitrogen removal and low oxygen and carbon consumption. Four phases were
conducted during the experiment: Phase I) DO between 2.0-3.0 mg L
-1of O
2
and C/N
1.5 (NDF); Phase II) DO between 0.6-0.7 mg L
-1of O
2
and C/N 1.5 (NDT); Phase III)
DO between 0.6-0.7 mg L
-1of O
2, C / N ratios of1.5, 0.9, 0.75 and 0.6 (NDT); Phase
IV) DO between 2.0-3.0 mg L
-1of O
2
, C/N ratios of 1.5, 0.9, 0.75, and 0.6 (NDF).
The best operational condition was found in the C / N ratio of 0.9 (Phase III)
obtaining an optimum N removal of 86.3%. In this condition, the system saved
around 26.8% in total organic carbon consumption and operated at conditions of 74%
lower dissolved oxygen when compared to conventional process for N-removal. This
strategy can be very useful for nitrogen removal for low carbon swine wastewater as
digestate from anaerobic processes.
INTRODUCTION
Worldwide increasing demand for meat has caused the establishment of large concentrated animal feeding operations (CAFOs) for livestock production in order to reduce animal production costs and soil demanded for effluent disposal. Usually intensive breeding farms confine large numbers of animals in an area of land proportionally small, breaking the relationship between crops and animal production. Thus, large amounts of manure are applied to the soil without undergoing any kind of treatment or stabilization, and without considering agronomic and legal criteria (Kunz et al., 2005). According to Williams (2008), much of the environmental impact generated by swine farming is a result of the lack of adequate management of solid and liquid waste. The waste produced in CAFOs
often exceeds the amount that can be used as biofertilizer due to land requirement limitations (Kinyua et al., 2014). Nutrient removal, mainly nitrogen and phosphorus from different wastewaters, has become the most important concern for the wastewater treatment plants in the past three decades. Nitrogen can be removed from wastewater by biological and physical chemical processes (Kunz & Mukhtar, 2016).
The biological Nitrification/Denitrification (NDF) process (Equation 1 and 2) is worldwide used for effluent nitrogen removal when an available carbon source is not a problem. In this process, during the aerobic and
autotrophic step (nitrification) NH4+ is oxidized to NO3
-followed by the anoxic and heterotrophic step
nitrogen (N2) (Lan et al., 2011). Nitrogen removal via nitrite Nitritation/denitritation (NDT) (Eq. 3 and 4) was reported to be technically feasible and economically favorable, especially when treating wastewater with high nitrogen concentrations and low C/N ratios (Yang et al., 2007). According to Peng & Zhu (2006), the methods used to accumulate nitrite are based on the appropriate regulation of temperature, pH, dissolved oxygen, cell retention time and initial nitrogen concentration.
NH + 1.5O ⎯⎯⎯⎯⎯⎯⎯⎯⎯ NO + H O + H → NO + 0.5O ⎯⎯⎯⎯⎯⎯⎯ NO (1)
NO → NO → NO → N O → N (2)
NH + 1.5O ⎯⎯⎯⎯⎯⎯⎯⎯⎯ NO + H O + H (3)
NO → NO → N O → N (4)
Nitrogen removal via NDT can be achieved by
Nitrite Oxidizing Bacteria (NOB) inhibition (e.g.. DO
restriction, sludge wash out), due to different physiological characteristics and responses to operating conditions in order to restrict nitrite oxidation to nitrate (Ge et al., 2015). For anoxic phase (denitrification or denitritation) the availability of biodegradable organic carbon becomes critical in wastewater with high ammonia concentration and low C/N ratio. An alternative to solve this problem is the use of NDT process saving carbon during denitritation
step.For this, a possible alternative is the DO reduction,
for NOB activity restriction. This process has attracted attention in recent years, especially for treatment of
wastewater with low C/N ratio (Gujer, 2010; Ge et al.,
2015). In this way, nitritation can be obtained and
maintained at low DO concentration.
The present study aims the NDT establishment by DO restriction evaluating the influence of different C/N ratios on TOC (Total Organic Carbon) consumption and N removal efficiency comparing NDF and NDT for swine wastewater nitrogen removal.
MATERIAL AND METHODS
Wastewater Sampling and Characterization
The wastewater samples were collected from a swine manure treatment system (SMTS) at Embrapa Swine and Poultry, located in Concordia, Santa Catarina, Brazil. For the experiments, were used the primary settling tank effluent (STE), and the UASB reactor effluent (URE), in order to have samples at different C/N ratios (Table1). Experimental design
A schematic representation of the experimental MLE (modified Ludzak-Etinger) process configuration, that was under operation at laboratory scale in Embrapa Swine and Poultry, is presented in Figure 1. The aeration was provided using an air pump (Big Air, A420) and controlled by a dissolved oxygen controller (Hach, SC200). The anoxic reactor was continuously fed (Qin =
1.5 mL min-1) for a nitrogen loading rate of 0.35±0.07 kg
m-3d-1 of N), the recirculation rate was equivalent to
5.5*Qin and the sludge recirculation rate was 1*Qin using peristaltic pumps (Masterflex, 7518-60). The anoxic and oxic reactors were maintained under continuous stirring (IKA-RW90) at 15 rpm and 200 rpm, respectively.
TABLE 1. Characterization of swine wastewater samples collected at a swine manure treatment process used to feed the MLE process configuration.
STE URE
NH3 - N (mg L-1) 770 ± 99.3 767 ± 47.3
TOC (mg L-1) 1200 ± 380 235 ± 111
Alkalinity (mg L-1) 4000 ± 536 4000 ± 541
C/N Ratio 1.5 0.3
Where: STE: settling tank effluent, URE: UASB reactor effluent and TOC: Total Organic carbon
The study was conducted in four different phases: Phase I (presence of AOB and NOB at high DO concentration, NDF process), between days 1 - 37, DO
concentration in the oxic reactor between 2.0 - 3.0 mg L-1
of O2. The system influent was composed by the STE presenting a TOC and NH3–N concentration of 1,100 mg
L-1 of N and 719 mg L-1 of N respectively, C/N ratio of 1.5.
Phase II (DO concentration reduction favoring inhibition of NOB, NDT process) was conducted between days 38-101. At the first 20 days (38-53) the DO concentration in oxic tank was kept between 0.5 to 0.6 mg
L-1 of O2, from day 54 to 67, the DO concentrations ranged
from 0.4 to 0.5 mg L-1 of O2, and between days 68-101
with DO concentration between 0.6 to 0.7 mg L-1 of O2.
The system influent was fed with SMTS STE with TOC
and NH3-N concentration of 1,097 mg L-1 and 734 mg L-1
of N respectively, resulting in a C/N ratio of 1.5.
Phase III (reduction of DO concentration favoring inhibition of NOB, NDT process), days 139 - 170, DO concentration in the nitrifying reactor between 0.6 - 0.7 mg
L-1 of O2. The system influent was fed with the SMTS
URE and STE mixture. The mixtures were prepared to provide different C/N ratios, 1.5 (101 - 115 days), 0.9 (116 - 135 days), 0.75 (136 - 149 days), and 0.6 (150 - 170 days).
Phase IV (presence of AOB and NOB at high DO concentration, NDF process) was conducted between days 171 - 226 with oxic reactor DO concentration setted
between 2.0 - 3.0 mg L-1 of O2. The oxic reactor was fed
FIGURE 1. Schematic representation of the modified Ludzak-Etinger (MLE) process configuration for swine wastewater treatment. Oxic reactor =Nitritation or Nitrification, anoxic = denitritation or denitrification.
Oxygen Uptake Rates (OUR) on NDF and NDT Activity
The respirometer, consisted of a 400 mL glass conical flask with three exits at the top for an oxygen probe insertion (Hanna, HI 98186), a pH probe (Hanna, HI 98183) and the injection of the ammonium solution (NH4Cl) (De Prá et al., 2016). All nitrifying (Phase I: NDF and Phase II: NDT) respirometric tests were carried out at
the same biomass concentration (0.47 gL-1 of VSS) with
the biomass provided from the oxic reactor. A nutrient solution without total ammonia nitrogen (TAN), described
by Campos et al. (1999), was prepared to carry out the washing of biomass between tests through suspension, centrifugation and discarding the supernatant. Once the
mixed liquor reached DO saturation (9.0±0.5 mg L-1 of
O2), ammonia substrate (NH4Cl) was added to the flask at
concentrations of 50, 100, 200, 400, 600 and 800 mg L-1 of
NH3-N. DO depletion was monitored until the concentration decreased to 15% of the DO saturation. The specific oxygen uptake rate (SOUR) was determined by [eq. (5)].
SOUR (mgO . gSSV . min = ( .) − ER (mgO . gSSV . min ) (5) Where:
SOUR: Specific Oxygen Uptake Rate (mgO2. gSSV-1. min-1);
OUR: Oxygen Uptake Rate (mg. min-1 of O2);
X : biomass concentration (g of SSV),
ER: endogenous respiration (mgO2. gSSV-1. min-1).
Analytical Methods
Alkalinity, TOC, NO2--N, NO3--N and NH3-N was
determined according to APHA, AWWA, WEF (2012). TOC analyzes were performed using a TOC analyzer
(Analytik Jena, Multi C/N 2100). While NO2--N, NO3--N
and NH3-N were determined based on a colorimetric method using a flow injection analysis system (FIAlab – 2500). Alkalinity was determined using the titrimetric
method (Titronic T-200semiautomatic). DO
concentrations in oxic reactor were measured and controlled using a DO controller (Hach, SC200).
RESULTS AND DISCUSSION DO restriction effect on NDF process
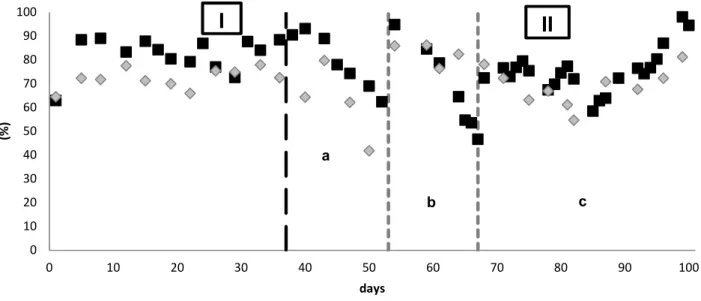
FIGURE 2. Nitrogen species concentrations (NH3-Nin , NH3-Nout , NO2-Nout , NO3-Nout ) in the MLE process
configuration treating swine wastewater. Phase I: NDF C/N 1.5, DO 2.0 - 3.0 mg L-1 of O2. Phase II: NDT C/N 1.5, (a) DO 0.5
- 0.6 mg L-1 of O2, (b) DO 0.4 - 0.5 mg L-1 of O2, (c) DO 0.6 - 0.7 mg L-1 of O2.
Phase II, between days 38 - 53 (Figures 2 and 3,
II-a) DO concentration was restricted from 2.5 ± 0.5 mg L-1of
O2 to 0.55 ± 0.05 mg L-1 of O2, to reduce nitrite oxidation
bacteria (NOB) activity (Hanaki & Wantawin, 1990). However, even after severe reduction of DO concentration, N removal efficiency via nitrate presented a low decrease
when compared to phase I (Table 2). The literature reports that complete nitrification is kept with higher values of
DO concentration of 1.5 mg L-1 of O2 (Yang et al., 2012),
while at lower DO levels 0.3–0.7 mg L-1 of O2 nitrite is
accumulated by the nitritation process prevalence (Ma et al., 2009; Zeng et al., 2013).
FIGURE 3. N removal ( ) and TOC consumption ( ) TOC in MLE process configuration treating swine wastewater. Phase I:
NDF C/N 1.5, DO 2.0-3.0 mg L-1 of O2. Phase II: NDT C/N 1.5, (a) DO 0.5-0.6 mg L-1 of O2, (b) DO 0.4-0.5 mg L-1 of O2, (c)
DO 0.6-0.7 mg L-1 of O2.
0 200 400 600 800 1000 1200 1400 1600
0 10 20 30 40 50 60 70 80 90 100
(m
g
L
-1of
N
)
days
I
aII
b c
0 10 20 30 40 50 60 70 80 90 100
0 10 20 30 40 50 60 70 80 90 100
(%
)
days
I
II
a
As nitritation was not stablished in Phase II-a, DO concentration was restricted again in the oxic reactor between days 54-67 (Phase II-b, Figures 2 and 3). The DO
concentration was decreased from 0.55 ± 0.05 mg L-1 of
O2to 0.45 ± 0.05 mg L-1 of O2. At this condition, it was
observed a NH3-N accumulation (220.02 ± 117.4 mg L-1 of
N) in oxic reactor, caused by the reduction of AOB (Ammonia oxidizing bacteria) activity.
On phase II-c, DO concentration was again
increased in the oxic reactor from 0.45 ± 0.05 mg L-1 of O2
to 0.65 ± 0.05 mg L-1 of O2(between days 68-101) in order
to recover the AOB efficiency to completely remove NH3-N from the MLE process. During this phase (Figures 2 and 3) NH3-N removal was increased about 61%, compared to phase II-b with a slight improvement in N removal process (Table 2).
Effect of DO concentration and different C/N ratios in N removal process via NDF and NDT
Initially the system was operated at C/N ratio of 1.5
(phase III-a, Figures 4 and 5) and DO 0.65 ± 0.05 mg L-1
of O2, under the same operating conditions of phase II-c, reaching a similar N removal efficiency that was also quite similar to phase I when NDF was established (Table 2).
At this phase III-b (between days 116 - 135) NH3-N removal was around 90 % (Table 2). However, even with the reduction of C/N ratio at this stage to 0.9, TOC consumption was reduced 23% when compared to Phase III-a, without significant impact on the N removal efficiency (Table 2). According to Yang & Yang (2011), a reduction in the consumption of organic matter switching NDF to NDT can reach in 40% of carbon economy for heterotrophic process.
Thereafter a new reduction of C/N ratio from 0.9 to 0.75 (Phase III-c, Figures 4 and 5) between days 136-149 was performed. This strategy affected the N removal efficiency in almost 30 % comparing phases c with III-b (TaIII-ble 2). However, with the reduction of C/N ratio,
there were accumulation of NO2--N (60.11 ± 21.9 mg L-1
of N) and NO3--N (138.2 ± 123.5 mg L-1 of N). The
accumulation of NOX-N (NO2--N + NO3--N) occurs when
there is absence of TOC in the denitrifying reactor because the TOC is the donor source of electrons, and nitrite and nitrate, are the electrons acceptors. Associated to NOX-N accumulation, and alkalinity consumption, pH will decrease favoring the generation of Free Nitrous Acid (FNA) that can also cause inhibition on nitrification process (Mohan et al., 2016; Hou et al., 2014).
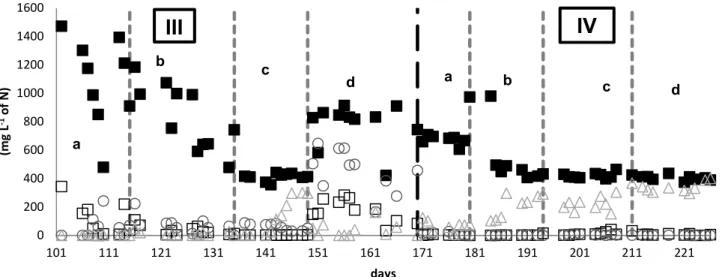
FIGURE 4. Nitrogen species concentrations (NH3-Nin , NH3-Nout , NO2-Nout , NO3-Nout ) in MLE configuration process
treating swine wastewater. Phase III: DO 0.6 - 0.7 mg L-1 of O2 and NDF (a) C/N 1.5; (b) C/N 0.9; (c) C/N 0.75; (d) C/N 0.6.
Phase IV: DO 2.0 - 3.0 mg L-1 of O2 and NDT (a) C/N 1.5; (b) C/N 0.9; (c) C/N 0.75; (d) C/N 0.6.
In Phase III-d, C/N ratio was decreased to 0.6 (Phase III-d, Figures 4 and 5), between days 150 - 170. During this phase, N removal efficiency was drastically reduced from 51.93% (Phase c) to 16.10% (Phase III-d). AOB was probably inhibited by the accumulation of
NO2--N (454.8 ± 143.1 mg L-1of N) in the system, which
occurred by limiting TOC biodegradable. With the absence of TOC heterotrophic bacteria are not capable of
converting NO2--N. At this high NO2-N concentration, for
the reactor conditions the FNA concentration was 1.19 mg
L-1of N that act negatively on the AOB activity (De Prá et
al., 2012).
0 200 400 600 800 1000 1200 1400 1600
101 111 121 131 141 151 161 171 181 191 201 211 221
(m
g
L
-1of
N
)
days
III
IV
a
b c
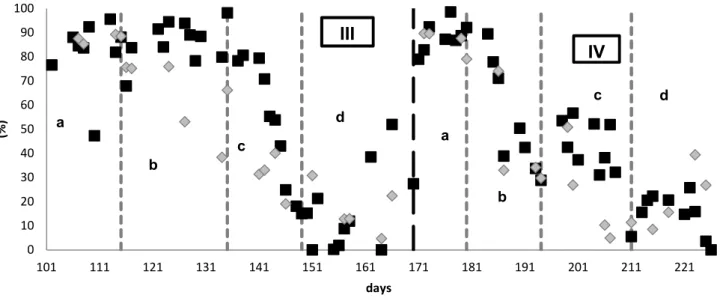
FIGURE 5. N removal ( ) and TOC consumption ( ) in MLE configuration process treating swine wastewater. Phase III: DO
0.6 - 0.7 mg L-1 of O2 and NDF (a) C/N 1.5; (b) C/N 0.9; (c) C/N 0.75; (d) C/N 0.6. Phase IV: DO 2.0 - 3.0 mg L-1 of O2 and
NDT (a) C/N 1.5; (b) C/N 0.9; (c) C/N 0.75; (d) C/N 0.6.
When we compare phase III-d (low C/N ratio), with phase II-b (high C/N ratio), it can be seen that in both stages the AOB bacteria were affected, with reduced
conversion capacity of NH3-N to NO2--N. By the O2
restriction (Phase II-b), it was observed an accumulation of NH3-N, at pH 8.26. At this condition, the generation of
FA (Free ammonia) is favored reaching of 41.53 mg L-1 of
N, with sufficient concentration to inhibit the AOB activity (De Prá et al., 2012; Kunz & Mukhtar, 2016).
The main objective of this phase IV, was to compare the behavior of the NDF (Phase IV) with NDT (Phase III), comparing TOC consumption and N removing.
Initially at phase IV, DO concentration in the oxic
reactor was increased from 0.65 ± 0.05 mg L-1of O2 to 2.5
± 0.5 mg L-1 of O2, and C/N ratio adjusted to 1.5. At these
conditions the N and TOC removal reached 88.45% and 86.45% respectively. Comparing Phase IV-a with Phase
III-a (C/N 1.5 and DO 0.65 ± 0.05 mg L-1 of O2) (Table 2)
was observed a similar N removal and TOC consumption in both phases, around 80% and 87% respectively.
In order to prove that oxygen was not the limiting agent in the process, C/N ratio was successively reduced as performed in phase III. At phase IV-b, C/N ratio was reduced from 1.5 to 0.9 (Figures 4 and 5), between days 183 - 194. At this phase, N removal of 54.07% showing an
efficiency decreasing of 34.38% compared to phase IV-a. Comparing with Phase III-b (Table 2), it is observed that besides of O2 economy (about 74 %). Meng et al. (2015) obtained N removal of 87% using nitritation/denitritation in an upflow microaerobic sludge reactor (UMSR), operating with swine influent at C/N ratio of 0.84.
In phase IV-c, C/N ratio was reduced from 0.9 to 0.75 (Figures 4 and 5) between days 197-211. Compared to Phase IV-b was observed a decrease in the N removal reaching 40.11% (Table 2).
C/N ratio was reduced from 0.75 to 0.6 (phase IV-d, Figures 4 and 5) between days 212-226. Comparing phase IV-d, (high DO and low C/N) to Phase III- d (low DO and low C/N) it was observed that both processes showed N removal efficiency around 15% associated to low TOC consumption.
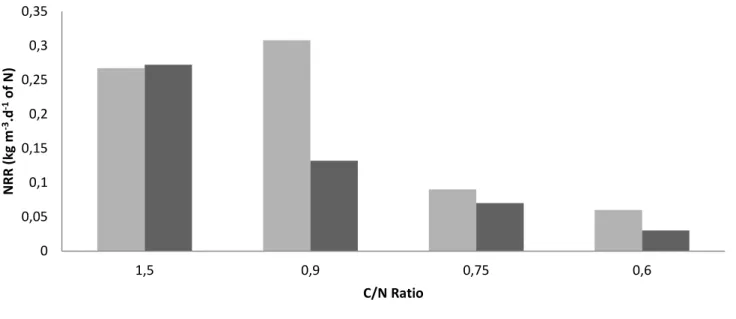
At Figure 6 is presented the nitrogen removal rate (NRR) comparing nitritation/denitritation (Phase III) and nitrification/denitrification (Phase IV). For C/N ratio of 1.5; the NRR was maintained similar for both processes
(about 0.27 kg m-3 d-1 of N). However, at the C/N ratio of
0.9 was observed an NRR for NDT of about 57% higher when compared to NDF. However at C/N ratios of 0.75 and 0.6 low values of NRR were observed showing the effect of carbon restriction on both processes.
0 10 20 30 40 50 60 70 80 90 100
101 111 121 131 141 151 161 171 181 191 201 211 221
(%
)
days
III
IV
a
b c
d
a
b
FIGURE 6. Nitrogen Removal Rates (NRR) at Phase III - NDT ( ) and Phase IV - NDF ( ) C/N ratios in MLE
configuration process treating swine wastewater. Phase III (NDT): DO 0.65±0.05 mg L-1 of O2; Phase IV (NDF): DO 2.5±0.5
mg L-1 of O2.
Chen et al. (2015) showed N removal efficiency
higher than 80% using an anaerobic/anoxic/aerobic (A2
/O)-biological aerated filter (BAF) system at C/N ratio of 5.5. Hu et al (2014), pointed out that a C/N ratio lower than 3.0 makes nitrogen removal from piggery wastewater difficult using NDF process. However, Lackner & Horn (2013) reached 80–85% N removal with an influent C/N ratio of 1, in a sequencing batch reactor treating industrial wastewater.
Critical Comparison of Specific Oxygen Uptake Rate in NDT e NDF processes
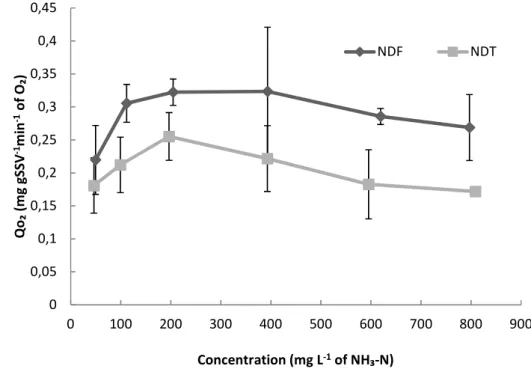
The concentration of dissolved oxygen during the respirometric tests to determine the endogenous respiration (ER) of NDT and NDF processes showed a linear behavior (R² = 0.951 and R² = 0.991, NDT and NDF respectively),
showing a SOUR of 0.043 mgO2 gSSV-1 min-1 and 0.084
mgO2 gSSV-1 min-1, respectively (Table 3). The results of
o OUR for each test are presented in Table 3 (Phase I for NDF; Phase II for NDT), and were performed after the process stability to avoid fluctuations in the results. The highest SOURs were observed during the test 3 (Table 3) with a (NH4)2SO4 concentration nearby 200 mg of NH3-N, at this condition the oxygen consumption for NDT was around 25 % lower when compared to NDF process.
During the initial tests at NH3-N low concentrations (Tests 1 to 3, Table 1), the SOURNDF and SOURNDT had an increasing rates, reaching the highest specific oxygen consumption rate in the test 4 (SOURNDF = 0.323
mgO2gVSS-1 min-1) under an initial NH3-N concentration
of 393.3 mg L-1 and for test 3 (SOURNDT = 0.255 mgO2
gVSS-1 min-1) under an initial NH3-N concentration of
196.52 mg L-1. After these S (substrate) concentrations in
subsequent tests, the SOURs start to decrease, indicating that this process is more sensitive for concentrations above
200 mg L-1 of NH3-N. De Prá et al. (2016) observed the
beginning of inhibition of nitrifying bacteria after the
concentration 200 mg L-1 of NH3-N, with then downfall in
the consumption of oxygen.
Although SOURs were the highest for test 3 (Figure 7), the oxygen consumption reduction between NDF and NDT was not the highest found during the respirometric tests. Figure 8 shows the performance between SOURs and S ((NH4)2SO4) concentrations for the two studied
processes. Whilst for 50 mg L-1 of NH3-N 11.5% oxygen
saving is reached for a S concentration of 800 mg L-1 of
NH3-N was achieved around 37% in oxygen saving (Figure 8), that is higher than that is reported in the literature (Turk & Mavinic, 1986; Yang & Yang, 2011; Zhu et al. 2008; Fu & Zhao, 2015).
0 0,05 0,1 0,15 0,2 0,25 0,3 0,35
1,5 0,9 0,75 0,6
NR
R
(k
g
m
-3.d -1of
N
)
FIGURE 7. Performance of SOUR during the respirometric tests for NDT and NDF processes.
FIGURE 8. Correlation of SOUR and NH3-N concentration between NDT and NDF processes.
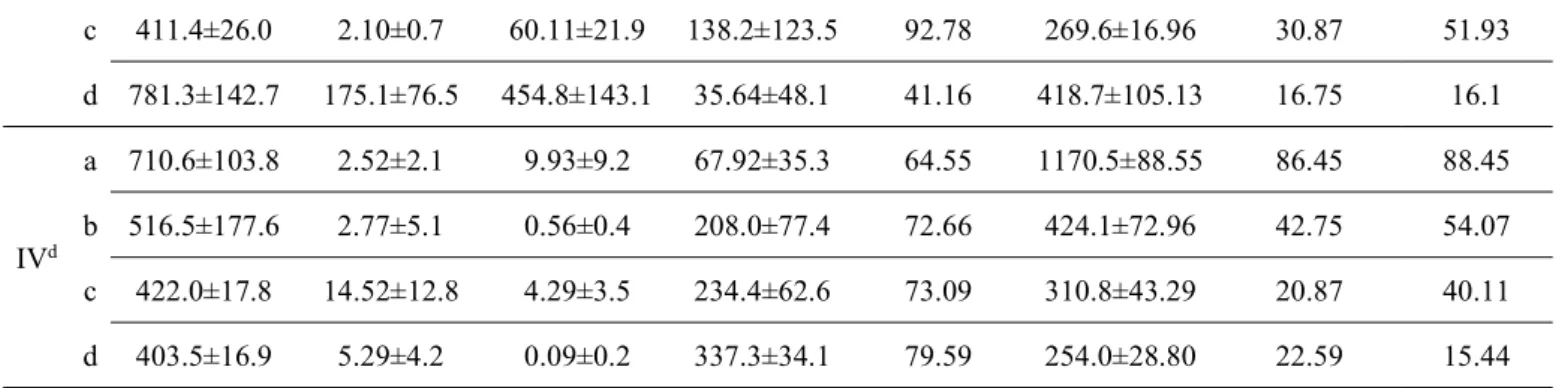
TABLE 2. NH3-Nin, TOCin with the respective effluent nitrogen species, TOC and alkalinity consumption and removal
efficiencies for swine effluent treatment. Mean values of the parameters in the four phases studied.
0 0,05 0,1 0,15 0,2 0,25 0,3 0,35 0,4 0,45
0 100 200 300 400 500 600 700 800 900
Qo
₂ (
m
g
gS
SV
-1m
in
-1of
O
₂)
Concentration (mg L-1of NH₃-N)
NDF NDT
y = 0,0872ln(x) - 0,2232 R² = 0,8823
0 0,05 0,1 0,15 0,2 0,25 0,3 0,35 0,4
0 200 400 600 800 1000
C
or
re
la
tio
n (
1-(S
O
U
RND
F
/SND
F
)/(
SO
U
RND
T
/SND
T
))
Concentration (mg L-1of NH₃-N)
Phase NH3-Nin (mg L-1) NH3-Nout (mg L-1) NO2
—Nout
(mg L-1) NO3
—Nout
(mg L-1)
Alkalinity Comsuption
(%)
TOCin
(mg L-1)
TOC Consumption
(%)
N Removal
(%)
Ia 719.42±77.2 4.44±4.2 26.09±35.7 98.93±83.1 84.74 1110.2±41.32 72.18 82.28
IIb
a 702.4±138.1 12.41±9.9 9.62±7.5 114.2±68.9 76.07 615.2±219.6 62.01 79.45
b 730.7±81.5 220.0±117.4 4.83±11.5 0.00 40.38 1887.3±136.0 8.73 68.19
c 772.2±76.9 85.70±82.6 100.3±91.8 4.96±16.8 63.60 789.3±219.7 68.83 75.42
IIIc a 1087.0±294.0 111.7±113.1 60.14±74.9 0.28±0.8 52.12 1724.9±27.76 87.64 82.02
Where:
in = affluent, out = effluent;
aPhase I: C/N ratio 1.5 and DO 2.0 - 3.0 mg L-1 of O2 (oxic reactor)
bPhase II: C/N ratio 1.5 and (a) DO 0.5 - 0.6 mg L-1 of O2; (b) DO 0.4 - 0.5 mg L-1 of O2; (c) DO 0.6 - 0.7 mg L-1 of O2;
(oxic reactor)
cPhase III: DO 0.6 - 0.7 mg L-1 of O2 (oxic reactor) and (a) C/N ratio 1.5; (b) C/N ratio 0.9; (c) C/N ratio 0.75; (d) C/N ratio 0.6
dPhase IV: DO 2.0 - 3.0 mg L-1 of O2(oxic reactor) and (a) C/N ratio 1.5; (b) C/N ratio 0.9; (c) C/N ratio 0.75; (d) C/N ratio 0.6
TABLE 3. OUR and SOUR for each substrate ((NH4)SO4) concentration (S) for NDT and NDF processes.
Tests (mg L-1SNDF of NH3-N) (mg L-1SNDT of NH3-N)) (mgO2 gVSSSOURNDF -1 min-1) (mgO2 gVSSSOURNDT -1 min-1)
ER - - 0.046 0.084
1 49.71±0.05 46.27±0.04 0.219 0.180
2 111.8±0.03 99.33±0.04 0.305 0.212
3 204.6±0.02 196.5±0.04 0.322 0.255
4 393.3±0.09 393.0±0.05 0.323 0.222
5 619.2±0.01 595.4±0.05 0.285 0.183
6 796.8±0.05 808.6±0.01 0.268 0.172
ER = Endogenous respiration.
Figure 8 shows a logarithmic tendency curve indicating a possible stability at substrate concentrations
above 800 mg L-1 of NH3-N. However, a great advantage
to operate the NDT process compared to NDF process, maintaining efficiency next to 80% in N removal (Table 2 and Figure 5) and parallel consuming less 36.8% of carbon for denitrification (Figure 6).
CONCLUSIONS
NDT was successfully stablished for swine
wastewater nitrogen removal at DO of 0.6 - 0.7 mg L-1 of
O2, reaching N removal of 75%. At C/N ratio of 0.9 the
nitrogen removal rate for NDT reached 0.31 kg m-3 d-1 of
N that is 133% higher than the obtained for NDF at the same conditions with a reduction of TOC consumption of 27 %. The results show that it is possible to obtain efficient nitrogen removal efficiency for MLE configuration process for swine wastewater treatment operating the process at low DO and C/N ratios creating the possibility of application and operating with influent low carbon and high nitrogen, such as digestate from anaerobic processes.
ACKNOWLEDGEMENTS
Authors thanks financial support from CAPES, CNPq and P-14 Eletrosul.
REFERENCES
APHA, AWWA, WEF (2012) Standard methods for the examination of water and wastewater. American Public Health Association, 22 ed.
Campos JL, Garrido-Fernández JM, Méndez R, Le-Ma JM (1999) Nitrification at high ammonia loading rates in an acti-vated sludge unit. Bioresourse Technology 68:141-145.
Chen Y, Li B, Ye L, Peng Y (2015) The combined effects of COD/N ratio and nitrate recycling ratio on nitrogen and phosphorus removal in anaerobic/anoxic/aerobic (A2/O)-biological aerated filter (BAF) systems. Biochemical Engineering Journal 93:235-242.
De Prá MC, Kunz A, Bortoli M, Perondi T, Chini A (2012) Simultaneous removal of TOC and TSS in swine wastewater using the partial nitritation process. Journal of Chemical Technology and Biotechnology 87:1641-1647. De Prá MC, Kunz A, Bortoli M, Scussiato LA, Coldebella A, Vanotti M, Soares HM (2016) Kinetic models for nitrogen inhinition in ANAMMOX and nitrification processo on deammonification system at room temperature. Bioresource Technology 202:33-41. Fu Z, Zhao J (2015) Impact of quinoline on activity and microbial culture of partial nitrification process. Bioresource Technology 197:113-119.
c 411.4±26.0 2.10±0.7 60.11±21.9 138.2±123.5 92.78 269.6±16.96 30.87 51.93
d 781.3±142.7 175.1±76.5 454.8±143.1 35.64±48.1 41.16 418.7±105.13 16.75 16.1
IVd
a 710.6±103.8 2.52±2.1 9.93±9.2 67.92±35.3 64.55 1170.5±88.55 86.45 88.45
b 516.5±177.6 2.77±5.1 0.56±0.4 208.0±77.4 72.66 424.1±72.96 42.75 54.07
c 422.0±17.8 14.52±12.8 4.29±3.5 234.4±62.6 73.09 310.8±43.29 20.87 40.11
Ge S, Wang S, Yang X, Qiu S, Li B, Peng Y (2015) Detection of nitrifiers and evaluation of partial nitrification for wastewater treatment: A review. Chemosphere 140: 85-98.
Gujer W (2010) Nitrification and me – A subjective review. Water Research 44:11-19.
Hanaki K, Wantawin C (1990) Nitrification at low levels of dissolved oxygen with and without organic loading in a suspended-growth reactor. Water Research 24(3):297-302. Hou B, Han H, Jia S, Zhuang H, Zhao Q, Xu P (2014) Effect of alkalinity on nitrite accumulation in treatment of coal chemical industry wastewater using moving bed biofilm reactor. Journal of Environmental Sciences (26):1014-1022.
Hu X, Xie L, Shim H, Zhang S, Yang D (2014) Biological nutrient removal in a full scale
anoxic/anaerobic/aerobic/pre-anoxic-MBR plant for low C/N ratio municipal wastewater treatment. Chinese Journal Chemical Engineers 22(4):447-454.
Kinyua MN, Cunningham J, Ergas SJ (2014) Effect of solids retention time on the bioavailability of organic carbon in anaerobically digested swine waste. Bioresource Technology 162:14-20.
Kunz A, Higarashi MM, Oliveira PA de (2005)
Tecnologias de Manejo e Tratamento de Dejetos de Suínos
Estudadas no BrasilCadernos de Ciência & Tecnologia
22(3):651-665.
Kunz A, Mukhtar S (2016) Hydrophobic membrane technology for ammonia extraction from wastewaters. Engenharia Agrícola 36(2):377-386.
Lackner S, Horn H (2013) Comparing the performance and operation stability of an SBR and MBBR for single-stage nitritation–anammox treating wastewater with high organic load. Environmental Technology 34(9-12):1319-1328.
Lan CJ, Kumar M, Wang CC, Lin JG (2011) Development of simultaneous partial nitrification, anammox and denitrification (SNAD) process in a sequential batch reactor. Bioresource Technology 102:5514-5519. Ma Y, Peng Y, Wang S, Yuan Z, Wang X (2009) Achieving nitrogen removal via nitrite in a pilot-scale continuous pre-denitrification plant. Water Research 43(3):563-572.
Meng J, Li J, Li J, Antwi P, Deng K, Wang C, Buelna G (2015) Nitrogen removal from low COD/TN ratio manure-free piggery wastewater within an upflow microaerobic sludge reactor. Bioresource Technology 198:884-890. Mohan TVK, Nancharaiah YV, Venugopalan VP, Sai PMS (2016) Effect of C/N ratio on denitrification of high-strength nitrate wastewater in anoxic granular sludge sequencing batch reactors. Ecological Engineering 91:441-448.
Peng Y, Zhu G (2006) Biological nitrogen removal with nitrification and denitrification via nitrite pathway. Applied microbiology and biotechnology 73(1):15-26. Turk O, Mavinic DS (1986) Preliminary assessment of a shortcut in nitrogen removal from wastewater. Canadian Journal of Civil Engeenering 13(6):600-605.
Williams CMM (2008) Technologies to mitigate environmental impact of swine production. Revista Brasileira de Zootecnia 37:253-259.
Yang H, Zhang Y, Ye Y (2012) Study on the dissolved oxygen (DO) on the short-cut nitrification in sequencing batch reactor (SBR). Advanced Materials Research 374:1009-1012.
Yang Q, Peng Y, Liu X, Zeng W, Mino T, Satoh H (2007) Nitrogen Removal via Nitrite from Municipal Wastewater at Low Temperatures using Real-Time Control to
Optimize Nitrifying Communities Environmental Science & Technology 41:8159-8164.
Yang S, Yang F (2011) Nitrogen removal via short-cut simultaneous nitrification and denitrification in an intermittently aerated moving bed membrane bioreactor. Journal of Hazardous Materials 195:318-323.
Zeng W, Wang XD, Li BX, Bai XL, Peng YZ (2013) Nitritation and denitrifying phosphorus removal via nitrite pathway from domestic wastewater in a continuous MUCT process. Bioresource Technology 143:187-195.