SPATIAL DISTRIBUTION OF PLANT-PARASITIC
NEMATODES IN SUGARCANE FIELDS
Leila Luci Dinardo-Miranda1*; Juliano Vilela Fracasso2
1
Instituto Agronômico - Centro de Cana-de-açúcar, C.P. 206 - 14001-970 - Ribeirão Preto, SP - Brasil. 2
Instituto Agronômico/Fundag - Centro de Cana-de-açúcar. *Corresponding author <leiladinardo@iac.sp.gov.br>
ABSTRACT:Nematodes are important parasites of sugarcane in Brazil. Because of this, several studies have been conducted in recent years to evaluate the effectiveness of control methods. However, no studies have been reported on the spatial distribution of nematodes in sugarcane fields, and such studies are indispensable for the development of sampling plans, aimed at their application in integrated management programs. The spatial distribution of Meloidogyne javanica, Pratylenchus zeae, and mixed populations of P. zeae and P. brachyurus was studied in six commercial fields, with areas ranging from 0.26 to 0.50 ha; samples were obtained during the rainy season. The samples, represented by about 50 g roots, were collected within a rectangular grid measuring 7 × 12 m, 7 × 10 m or 5 × 13 m. Among the ten calculated semivariograms (four for M. javanica populations and six for P. zeae populations or the mixture between P. zeae + P. brachyurus), four could not be fitted to any model and presented a pure nugget effect; the spherical model showed the best fit to the semivariograms of data observed in the other six conditions. In those cases, values of range in semivariogram varied from 18 to 35 m, allowing the nematode aggregation area to be estimated at 2,110 m2
, on average, suggesting that at least five sampling points per hectare would be necessary, on average to obtain a reliable estimate for the population of these plant parasites in a given area.
Key words: Saccharum, Meloidogyne, Pratylenchus, spatial variability, population
DISTRIBUIÇÃO ESPACIAL DE NEMATÓIDES FITOPARASITOS
EM ÁREAS CULTIVADAS COM CANA-DE-AÇÚCAR
RESUMO: Nematóides são importantes parasitos da cana-de-açúcar no Brasil e, em função disso, muitos estudos foram conduzidos, nos últimos anos, para avaliar a eficiência de medidas de controle. Entretanto, não há estudos sobre a distribuição espacial de nematóides em canaviais e esses estudos são essenciais para o desenvolvimento de planos de amostragem, visando aplicação em programas de manejo integrado. A distribuição espacial de Meloidogyne javanica, Pratylenchus zeae e de populações mistas de P. zeae e P. brachyuurs foi estudada em seis campos comerciais, com áreas de 0,26 a 0,50 ha, nas quais procedeu-se à amostragem na época chuvosa do ano. As amostras, representadas por cerca de 50 g de raízes, foram coletadas em grid retangular de 7 × 12 m, 7 × 10 m ou 5 × 13 m. Dos dez semivariogramas calculados (quatro para populações de M. javanica e seis para populações de P. zeae ou mistura de P. zeae + P. brachyurus), quatro não se ajustaram a qualquer modelo, apresentando efeito pepita puro; o modelo esférico foi o que melhor se ajustou aos semivariogramas dos dados observados nas outras seis situações. Nesses casos, o alcance variou de 18 a 35 m, permitindo estimar a área de agregação dos nematóides em 2110 m2
, em média, sugerindo que, seriam necessários, em média, pelo menos cinco pontos de amostragem por hectare para obter uma estimativa confiável da população desses fitoparasitos em determinada área.
Palavras-chaves: Saccharum, Meloidogyne, Pratylenchus, variabilidade espacial, populações
INTRODUCTION
Among the many species of nematodes found in association with sugarcane, there are three parasites for the Brazilian conditions:
Meloidogyne javanica (Treub) Chitwood, M. incog-nita (Kofoid & White), and Pratylenchus zeae
Several studies have been conducted in order to evaluate the effectiveness of control methods such as chemical nematicides (Dinardo-Miranda & Garcia, 2002; Silva et al., 2006), resistant varieties (Dinardo-Miranda et al., 1996; 2003b; Garcia et al., 1997), organic matter (Novaretti & Nelli, 1985; Dinardo-Miranda et al., 2003a), and crop rotation (Rosa et al., 2003; Dinardo-Miranda & Gil, 2005). However, no studies report on the spatial distribution of nematodes in sugarcane fields. Such studies are indispensable for the development of sampling plans, aimed at their application in integrated management programs (Taylor, 1984; Southwood, 1978; Giles et al., 2000).
The spatial distribution of nematodes in the field is frequently described as aggregate (Ferris & Wilson, 1987), which means that there is spatial dependence between the populations in the sampled points. In view of this, geostatistics is the most adequate tool for the study of these populations, since it quantifies the spatial dependence between field-collected samples to be quantified and used to construct maps (Leibhold et al., 1993; Roberts et al., 1993; Ellsbeury et al., 1998).
The present study aimed to characterize the spatial distribution of M. javanica, P. zeae or mixed populations of P. zeae and P. brachyurus (Godfrey) Filipjev & Schuurmans Stekhoven in sugarcane, us-ing geostatistical analysis, so as to provide guidance for sampling procedures in the field.
MATERIAL AND METHODS
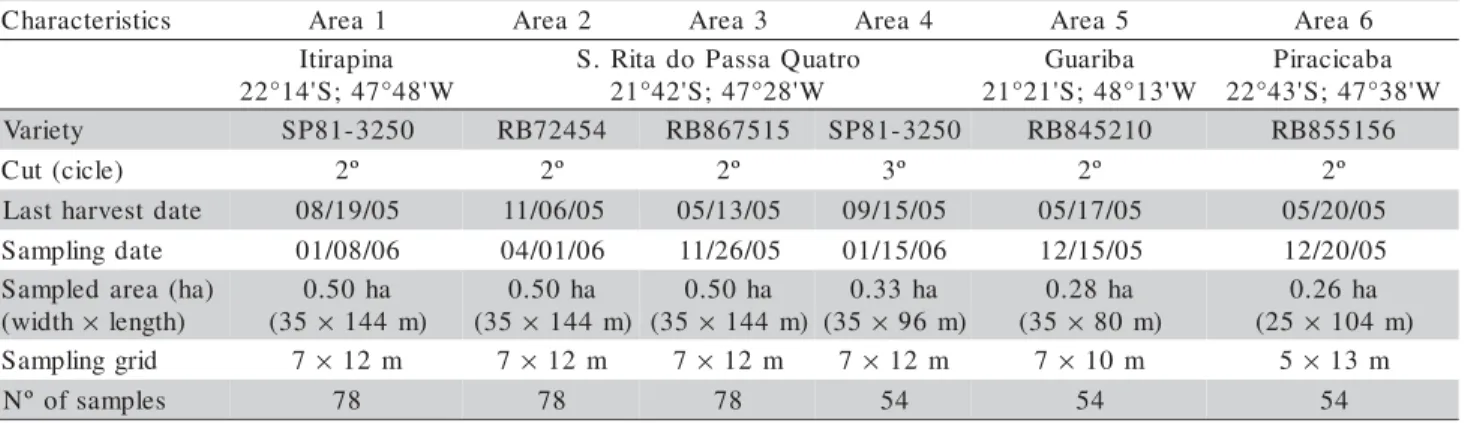
The spatial distribution of M. javanica, P. zeae, and mixed populations of P. zeae and P. brachyurus was studied in six commercial fields, whose characteristics are presented in Table 1. Ar-eas ranging from 0.26 to 0.50 ha were selected in each field. Samplings were obtained in these areas
during the rainy season, when populations usually peak due to favorable moisture and temperature conditions, as well as to abundant root growth. Samples were collected within rectangular grids mea-suring 7 × 12 m (areas 1 to 4), 7 × 10 m (area 5), or 5 × 13 m (area 6), (Table 1). Each sample was represented by about 50 g sugarcane roots, from which the nematodes were extracted by a combina-tion of sifting and centrifugal flotacombina-tion methods, in sucrose solution, according to Coolen & D´Herde (1972).
Data were initially analyzed by descriptive statistics and mean, standard deviation, coefficient of variation, maximum value, minimum value, skew-ness and kurtosis were obtained using the Statistical Analysis System (SAS Institute, 1995). In order to obtain lower coefficients of variation, data were transformed to log(x+1), and basic statistics were recalculated.
To verify the hypothesis of normality of the data, the Shapiro & Wilk (1965) test was carried out using the Statistical Analysis System (SAS Institute, 1995). After this, geostatistical analyses of the trans-formed data were run using semivariograms and kriging interpolation to construct maps, as described by Vieira et al. (1983). The semivariogram analyses were conducted using the GEOSTAT software (Vieira et al., 1983). Based on the models fitted to the semivariograms, the jackknifing test was used to verify whether the estimates of semivariogram param-eters were adequate and to estimate the number of neighbors that should be used in kriging (Vieira, 2000). Once the parameters for the model were con-firmed and the adequate numbers of neighbors were estimated, values were interpolated for the locations where they were not measured, by the kriging method, using the GEOSTAT software (Vieira et al., 1983). The kriging-estimated values were used in the Surfer software (Golden Software, 1999) to construct the maps. s c i t s i r e t c a r a h
C Area 1 Area2 Area3 Area 4 Area 5 Area 6
a n i p a r i t I W ' 8 4 ° 7 4 ; S ' 4 1 ° 2 2 o r t a u Q a s s a P o d a t i R . S W ' 8 2 ° 7 4 ; S ' 2 4 ° 1 2 a b i r a u G W ' 3 1 ° 8 4 ; S ' 1 2 ° 1 2 a b a c i c a r i P W ' 8 3 ° 7 4 ; S ' 3 4 ° 2 2 y t e i r a
V SP81-3250 RB72454 RB867515 SP81-3250 RB845210 RB855156 ) e l c i c ( t u
C 2º 2º 2º 3º 2º 2º
e t a d t s e v r a h t s a
L 08/19/05 11/06/05 05/13/05 09/15/05 05/17/05 05/20/05 e t a d g n i l p m a
S 01/08/06 04/01/06 11/26/05 01/15/06 12/15/05 12/20/05 ) a h ( a e r a d e l p m a S h t d i w
( × length)
a h 0 5 . 0 5 3
( × 144m)
a h 0 5 . 0 5 3
( × 144m)
a h 0 5 . 0 5 3
( × 144 m)
a h 3 3 . 0 5 3
( × 96 m)
a h 8 2 . 0 5 3
( × 80m)
a h 6 2 . 0 5 2
( × 104m) d i r g g n i l p m a
S 7× 12 m 7 × 12m 7 × 12m 7× 12m 7× 10m 5× 13m
s e l p m a s f o º
N 78 78 78 54 54 54
RESULTS AND DISCUSSION
Among the important nematode species for sugarcane, M. javanica and the mixed population of
P. zeae and P. brachyurus were found in area 1, P. zeae
was found in area 2, M. javanica and the mixed popu-lation of P. zeae and P. brachyurus were found in area 3, M. javanica and P. zeae were found in area 4, M. javanica and P. zeae were found in area 5, and P. zeae
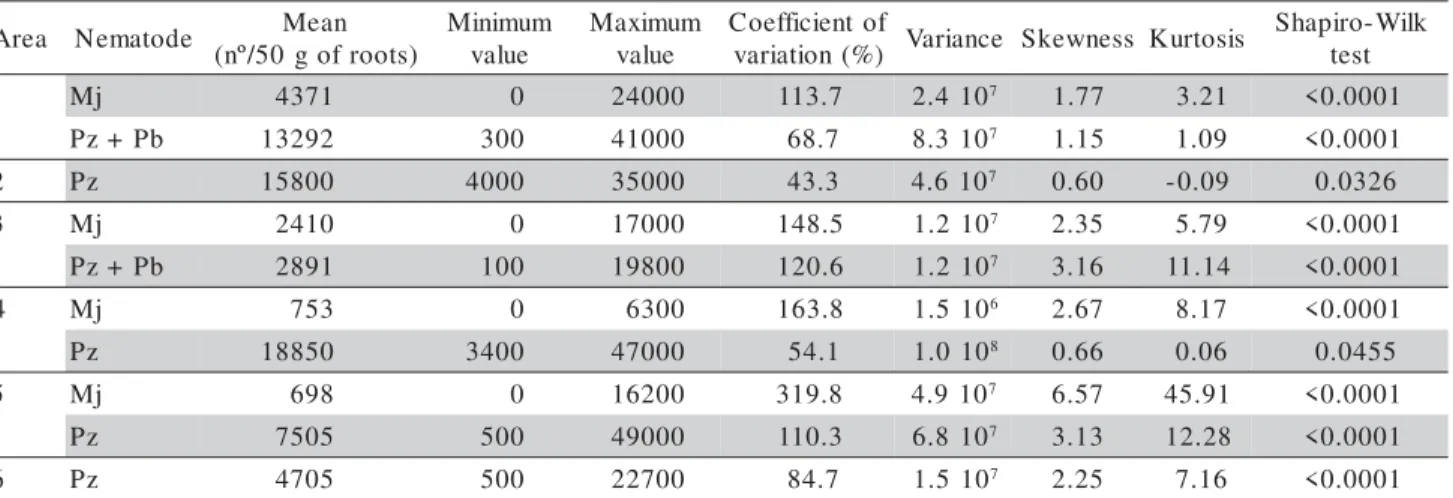
was found in area 6. In all areas, great differences were observed between the maximum and minimum populations, both for M. javanica and P. zeae or for the P. zeae + P. brachyurus mixture, considering origi-nal data (Table 2) or transformed to log(x+1) data (Table 3).
Considering original data (Table 2) and the cri-teria proposed by Pimentel Gomes (2000), all popula-tions presented very high coefficients of variation (CV > 30%). Analyzing transformed data, the variability was lower, and only M. javanica population in area
3, in area 4 and in area 5 still presented very high co-efficients of variation (Table 3). For M. javanica popu-lation in area 1, the coefficient of variation was high and for Pratylenchus species the coefficients of varia-tion were considered low or medium, with values be-tween 5 and 12.3%.
For M. javanica the coefficients of variation were higher than the values obtained for Pratylenchus
species, indicating that the variability of populations of that species was higher than the variability of
Pratylenchus populations (Tables 2 and 3). The rea-sons for greater variability in Meloidogyne populations are related to its biology. Because Meloidogyne is a sed-entary endoparasite, the females lay all their eggs at the same place, in masses, resulting in a highly-aggre-gated spatial pattern (Ferris et al., 1990). On the other hand, nematodes in the genus Pratylenchus are migra-tory and therefore move through the plant and the soil, laying their eggs individually, resulting in a more uni-form distribution in the area.
a e r
A Nematode Mean ) s t o o r f o g 0 5 / º n ( m u m i n i M e u l a v m u m i x a M e u l a v f o t n e i c i f f e o C ) % ( n o i t a i r a
v Variance Skewness Kurtosis
k l i W -o r i p a h S t s e t
1 Mj 4371 0 24000 113.7 2.4107 1.77 3.21 <0.0001
b P + z
P 13292 300 41000 68.7 8.3107 1.15 1.09 <0.0001
2 Pz 15800 4000 35000 43.3 4.6107 0.60 -0.09 0.0326
3 Mj 2410 0 17000 148.5 1.2107 2.35 5.79 <0.0001
b P + z
P 2891 100 19800 120.6 1.2107 3.16 11.14 <0.0001
4 Mj 753 0 6300 163.8 1.5106 2.67 8.17 <0.0001
z
P 18850 3400 47000 54.1 1.0108 0.66 0.06 0.0455
5 Mj 698 0 16200 319.8 4.9107 6.57 45.91 <0.0001
z
P 7505 500 49000 110.3 6.8107 3.13 12.28 <0.0001
6 Pz 4705 500 22700 84.7 1.5107 2.25 7.16 <0.0001
Mj = M. javanica; Pz = P. zeae; Pb = P. brachyurus.
Table 2 - Statistical parameters of the original data of plant-parasitic nematode populations in sugarcane.
a e r
A Nematode Mean Median Minimum e u l a v m u m i x a M e u l a v f o t n e i c i f f e o C ) % ( n o i t a i r a
v Variance Skewness Kurtosis
-o r i p a h S t s e t k l i W ) s t o o r f o g 0 5 / º n (
1 Mj 3.30 3.35 0 4.38 20.8 0.471 -1.58 5.63 <0.0001
b P + z
P 4.00 4.06 2.47 4.61 9.2 0.135 -1.27 3.25 0.0002
2 Pz 4.15 4.17 3.60 4.54 5.0 0.042 -0.54 0.32 0.0702
3 Mj 2.69 2.95 0 4.23 42.7 1.322 -1.26 1.00 <0.0001
b P + z
P 3.27 3.28 2.00 4.30 12.3 0.163 -0.18 1.82 0.0077
4 Mj 1.98 2.47 0 3.80 66.0 0.707 -0.67 -1.11 <0.0001
z
P 4.20 4.21 3.53 4.67 6.5 0.075 -0.71 0.16 0.0262
5 Mj 1.60 2.00 0 4.20 87.1 1.943 -0.12 -1.68 <0.0001
z
P 3.70 3.68 2.70 4.69 10.3 0.145 0.12 0.37 0.8840*
6 Pz 3.55 3.54 2.70 4.35 9.7 0.116 -0.05 -0.16 0.9974* Mj = M. javanica; Pz = P. zeae; Pb = P. brachyurus; * = significant at 5%.
All variables original data did not follow nor-mal distribution according to the Shapiro-Wilk test and to the skewness and kurtosis values (near zero) (Table 2). When transformed data were analyzed, two popu-lations showed normal distribution (P. zeae in area 5 and area 6), with skewness and kurtosis values near zero (Table 3). However, for all Pratylenchus popula-tions and for M. javanica populations in area 1, the mean values were very similar to the median values (Table 3), suggesting that the data presented a near to normal distribution in these cases.
Since using transformed data, the coefficients of variation, skewness and kurtosis were lower and most of then showed similar normal distributions, it was decided to use the transformed data to run the geostatistical analysis. However, according to Cressie (1991), it is not necessary that data present normal distribution to use geostatistical analysis; it is just con-venient that the distribution curve does not show a long tail, endangering the results. So, considering the previous analysis of these data, it is possible to admit that the studied variables had appropriate distributions for geostatistical analysis.
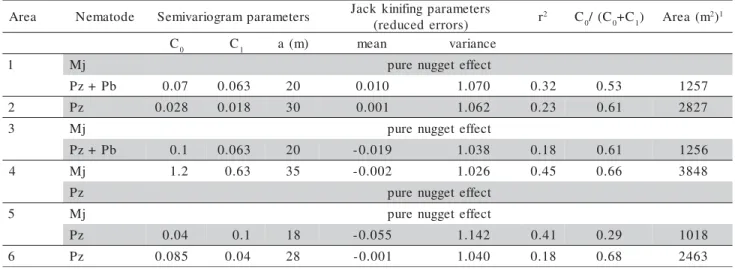
Among the ten calculated semivariograms (four for M. javanica populations and six for P. zeae popu-lations or the P. zeae + P. brachyurus mixture), those corresponding to M. javanica populations in areas 1, 3, and 5, and the semivariogram corresponding to the
P. zeae population in area 4 exhibited a pure nugget effect (Table 4). This means that the spatial distribu-tion of nematodes in the above-mendistribu-tioned cases oc-curred simply at random, within the sampling distance used in the study, that is, the distance between sam-pling points was too large to allow the detection of a spatial dependence between them.
Regarding to studies involving insects, Liebhold et al. (1993) stated that the occurrence of a pure nugget effect is quite common and is mainly at-tributed to the fact that the spatial dependence occurs at a smaller spatial scale than the sampling scale that is often adopted. The same can be said of studies in-volving nematodes.
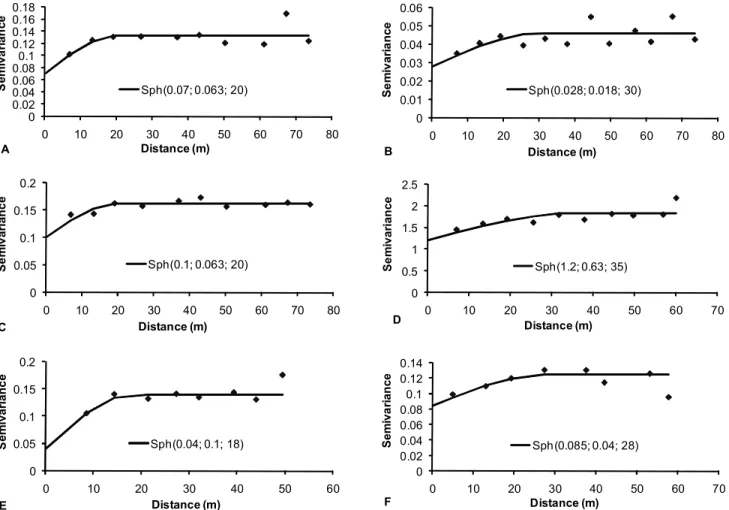
Mathematical models were fitted for the M. javanica populations in area 5, mixed P. zeae and P. brachyurus populations in areas 1 and 3, and P. zeae
populations in areas 2, 5, and 6, and the spherical model was best fitted to the semivariograms of data of these six conditions (Figure 1, Table 4). Although the observed r2
values were low, the parameters es-timated for the spherical model (C0, C1,a) were en-dorsed by the jackknifing test, since the mean val-ues for the reduced errors were near zero and the values for the variance of reduced errors were near 1 (Table 4).
The jackknifing test also revealed the ideal num-ber of neighbors to be used in kriging. As a result, kriging was performed using 20 neighbors for the mixed population of P. zeae and P. brachyurus in area 1, 16 neighbors for the mixed population of P. zeae
and P. brachyurus in area 3, 12 neighbors for P. zeae
in area 2 and M. javanica in area 4, and 8 neighbors for P. zeae in areas 5 and 6. The constructed maps based on the data are presented in Figure 2.
The portion of variability attributed to spatial dependence, given by the C0/(C0+ C1) ratio, ranged from 0.29 to 0.68 (Table 4). These values indicate a moderate spatial dependence between samples (Cambardella et al., 1994). The range (a), represent-ing the distance at which there is spatial dependence between samples, varied from 18 m for P. zeae in area
a e r
A Nematode Semivariogramparameters Jackkinifingparameters ) s r o r r e d e c u d e r
( r
2 C
0/(C0+C1) Area(m 2)1
C0 C1 a(m) mean variance
1 Mj purenuggeteffect
b P + z
P 0.07 0.063 20 0.010 1.070 0.32 0.53 1257
2 Pz 0.028 0.018 30 0.001 1.062 0.23 0.61 2827
3 Mj purenuggeteffect
b P + z
P 0.1 0.063 20 -0.019 1.038 0.18 0.61 1256
4 Mj 1.2 0.63 35 -0.002 1.026 0.45 0.66 3848
z
P purenuggeteffect
5 Mj purenuggeteffect
z
P 0.04 0.1 18 -0.055 1.142 0.41 0.29 1018
6 Pz 0.085 0.04 28 -0.001 1.040 0.18 0.68 2463
Mj = M. javanica; Pz = P. zeae; Pb = P. brachyurus. 1 Area calculated by r2, where p = 3.1416 and r = a.
Table 4 - Parameters of fitted semivariograms and of jack kinifing, coefficients of determination (r2), ratio C
0/(C0+C1) of
5, to 35 m for M. javanica in area 4, therefore re-vealing that samples separated from one another by distances smaller than 18 or 35 m, for P. zeae or M. javanica, respectively, would not be statistically inde-pendent. These data allowed us to estimate that the nematode aggregation area (A = Π2
, in which r = a), in the various fields, varied from 1.018 m2
to 3.848 m2, with an average value of 2.106 m2, suggesting that five sampling points per hectare would be necessary, on average, to obtain a reliable estimate for the nema-tode population in a given area. The samples would be collected at distances of 25 m. This value is higher than the value currently recommended for sampling in commercial areas (2 points/ha; Dinardo-Miranda, 2006), suggesting that changes should be made in the sampling plans in order to improve nematode popula-tion estimates.
Other authors have also revealed that the spherical model of the semivariogram best describes the spatial distribution of plant-parasite nematodes, with similar range values as those herein determined. Caswell & Chellemi (1986), studied the spatial
dis-0 0.02 0.04 0.06 0.08 0.1 0.12 0.14 0.16 0.18
0 10 20 30 40 50 60 70 80
S
e
mi
va
ri
an
ce
Distance (m)
Sph(0.07; 0.063; 20)
A
0 0.01 0.02 0.03 0.04 0.05 0.06
0 10 20 30 40 50 60 70 80
S
em
iva
ri
an
c
e
Distance (m)
Sph(0.028; 0.018; 30)
B
0 0.05 0.1 0.15 0.2
0 10 20 30 40 50 60 70 80
S
em
iva
ri
a
n
ce
Distance (m)
Sph(0.1; 0.063; 20)
C
0 0.5 1 1.5 2 2.5
0 10 20 30 40 50 60 70
S
e
m
ivar
ian
c
e
Distance (m)
Sph(1.2; 0.63; 35)
D
0 0.05 0.1 0.15 0.2
0 10 20 30 40 50 60
S
e
m
ivar
ian
c
e
Distance (m)
Sph(0.04; 0.1; 18)
E
0 0.02 0.04 0.06 0.08 0.1 0.12 0.14
0 10 20 30 40 50 60 70
S
em
iva
ri
an
ce
Distance (m)
Sph(0.085; 0.04; 28)
F
Figure 1 - Semivariograms for populations of (A) P. zeae + P. brachyurus in area 1, (B) P. zeae in area 2, (C) P. zeae + P. brachyurus in area 3, (D) M. javanica in area 4, (E) P. zeae in area 5 and (F) P. zeae in area 6. Numbers in parenthesis are nugget effect value (C0), C1 and range (a) of spherifal model (Sph).
tribution of Rotylenchulus reniformis for pineapple in Hawaii and found a 10 m range value, and by. Farias et al. (2002) worked with the same species in cot-ton in Brazil and determined a mean range value of 15 m. Webster & Boag (1992) worked with
Heterodera avenae and Globodera rostochiensis and also verified that the spherical model best fitted to the obtained data, with an approximate range of 60m. In the same way, Wallace & Hawkins (1994) worked with a forage grass and fitted the spherical model to a semivariogram for Tylenchorhynchus spp. popula-tion data, with a range value around 40 m.
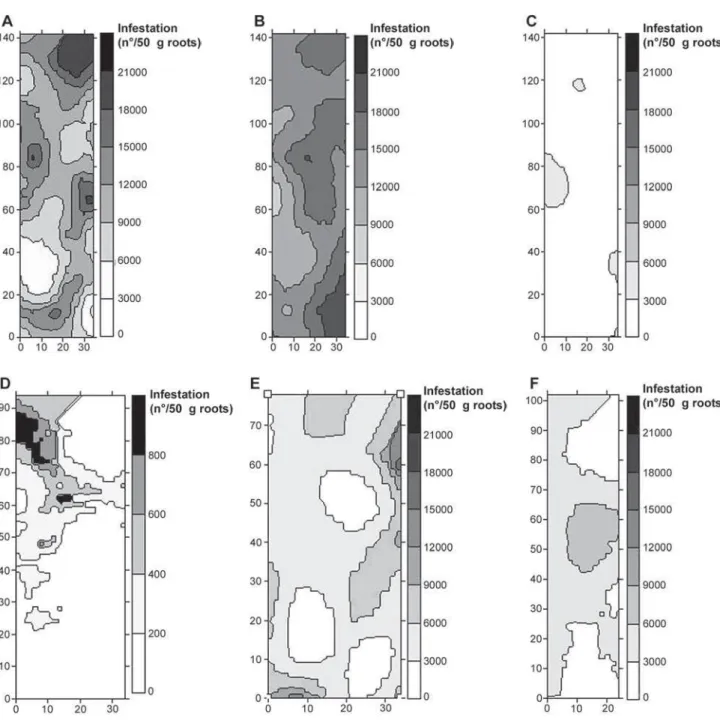
Figure 2 - Maps of the spatial distribution of (A) P. zeae + P. brachyurus in area 1, (B) P. zeae in area 2, (C) P. zeae + P. brachyurus in area 3, (D) M. javanica in area 4, (E) P. zeae in area 5 and (F) P. zeae in area 6.
than the scale at which spatial dependence occurs between the points. In addition, the commercial cul-tivation of sugarcane in Brazil involves a large num-ber of varieties, grown at the most diverse produc-tion environments, which are factors that interfere with the spatial distribution of nematodes. Therefore, our data suggest that in order to obtain a reliable es-timate of nematode populations in a given area, at least five samples per hectare must be collected, on aver-age; however, more studies are required due to the great variations in sugarcane-cultivation conditions that exist in the country.
REFERENCES
CAMBARDELLA, C.A.; MOORMAN, T.B.; NOVAK, J.M.; PARKIN, T.B.; KARLEN, D.L.; TURCO, R.F.; KONOPKA, A.E. Field-scale variability of soil properties in central Iowa soils. Soil Science Society of America Journal, v.58, p.1501-1511, 1994
CASWELL, E.P.; CHELLEMI, D.A. A geostatistical analysis of spatial pattern of Rotylenchus reniformis in Hawaiian pineapple field. Journal of Nematology, v.16, p.603, 1986.
COOLEN, W.A.; D’HERDE, C.J. A method for the quantitative extraction of nematodes from plant tissue. Grent: State Nematology and Entomology Research Station, 1972. 77p. CRESSIE, N. Statistics for spatial data. New York: John Wiley,
DINARDO-MIRANDA, L.L. Manejo de nematóides e pragas de solo em cana-de-açúcar. In: CAMPOS, A.P.; VALE, D.W.; ARAÚJO, E.S.; CORRADI, M.M.; YAMAUTI, M.S.; FERNANDES, O.A.; FREITAS. S. Manejo integrado de pragas. Jaboticabal: FUNEP, 2006. p.59-80.
DINARDO-MIRANDA, L.L.; GARCIA, V. Efeito da época de aplicação de nematicidas em soqueira de cana-de-açúcar.
Nematologia Brasileira, v.26, p.30-33, 2002.
DINARDO-MIRANDA, L.L.; GIL, M.A. Efeito da rotação com
Crotalaria juncea na produtividade da cana-de-açúcar, tratada ou nãocom nematicidas no plantio. Nematologia Brasileira, v.29, p.63-66, 2005.
DINARDO-MIRANDA, L.L.; GIL, M.A.; COELHO, A.L.; GARCIA, V.; MENEGATTI, C.C. Efeito da torta de filtro e de nematicidas sobre as infestações de nematóides e a produtividade da cana-de-açúcar. Nematologia Brasileira, v.27, p.61-67, 2003a.
DINARDO-MIRANDA, L.L.; GIL, M.A.; MENEGATTI, C.C. Danos causados por nematóides a variedades de cana-de-açúcar em cana planta. Nematologia Brasileira, v.27, p.69-74, 2003b.
DINARDO-MIRANDA, L.L.; MORELLI, J.L.; LANDELL, M.G.A.; SILVA, M.A. Comportamento de genótipos de cana-de-açúcar em relação a Pratylenchus zeae. Nematologia Brasileira, v.20, p.52-58, 1996.
ELLSBEURY, M.M.; WOODSON, W.D.; CLAY, S.A.; MALO, D.; SCHUMACHER, J.; CLAY, D.E.; CARLSON, C.G. Geostatistical characterization of special distribution of adult corn rootworm (Coleoptera: Chrysomelidae) emergence. Environmental Entomolology, v.27, p.910-917, 1998.
FARIAS, P.R.S.; BARBOSA, J.C.; VIEIRA, S.R.; SÁNCHEZ-VILA, X.; FERRAZ, F.C.C.B. Geostatistical analysis of the spatial distribution of Rotylenchus reniformis on cotton cultivated under crop rotation. Russian Journal of Nematology, v.10, p.1-9, 2002.
FERRIS, H.; WILSON, L.T. Concepts and principles of population dynamics. In: VEECH, J.A.; DICKSON, D.W. Vistas on nematology: a commemoration of the twenty-fifth anniversary of the Society of Nematolgists. Hyattsville: Society of Nematologists, 1987. p.372-376.
FERRIS, H.; MULLENS, T.A.; FOORD, K.E. Stability and characteristics of spatial description parameters for nematode populations. Journal of Nematology, v.22, p.427-439, 1990. GARCIA, V.; SILVA, S.F.; DINARDO-MIRANDA, L.L. Comportamento de variedades de cana-de-açúcar em relação a
Meloidogyne incognita. Revista Nacional do Álcool e
Açúcar, v.17, p.14-19, 1997.
GILES, K.L., ROYER, T.A.; ELLIOT, N.C.; KINDLER, S.D. Development and validation of a binomial sequential sampling plan for the greenbug (Homoptera: Aplidae) infesting winter wheat in the southern plains. Journal of Economic Entomology, v.93, p.1522-1530, 2000.
GOLDEN SOFTWARE. Surfer for windows. Surfer. Surfer 7.0. Contouring and 3D surface mapping for scientist´s engineers: user´s guide. New York: Golden Software, 1999. 619p.
GOMES, F.P. Curso de estatística experimental. 14 ed. Piracicaba: Degaspari, 2000. 477p.
LIEBHOLD, A.M.; ROSSI, R.E.; KEMP, W.P. Geostatistic and geographic information system in applied insect ecology.
Annual Review of Entomology, v.38, p.303-327, 1993. LORDELLO, L.G.E. Nematóides das plantas cultivadas. 6 ed.
São Paulo: Nobel, 1981. 314p.
MOURA, R.M.; RÉGIS, E.M.O.; MOURA, A.M. Espécies e raças de Meloidogyne assinaladas em cana-de-açúcar no Estado do Rio Grande do Norte, Brasil. Nematologia Brasileira, v.14, p.33-38, 1990.
NOVARETTI, W.R.T.; NELLI, E.J. Use of nematicide and filtercake for control of nematodes attacking sugarcane in São Paulo State.
Nematologia Brasileira, v.9, p.175-184, 1985.
NOVARETTI, W.R.T.; TÉRAN, F.O. Controle de nematóides parasitos da cana-de-açúcar. In: REUNIÃO TÉCNICA AGRONÔMICA, 1., Piracicaba, 1983. Anais. São Paulo: Copersucar, 1983. p.16-24.
ROBERTS, E.A.; RAVLIN, F.W.; FLEISCHER, S.J. Spatial data representation for integrated pest manegement programs.
American Entomology, v.39, p.91-107, 1993.
ROSA, R.C.T.; MOURA, R.M.; PEDROSA, E.M.R. Efeitos do uso de Crotalaria juncea e carbofuran observados na colheita de cana planta. Nematologia Brasileira, v.27, p.167-171, 2003. SAS INSTITUTE. Statistical analysis system for Windows:
computer program manual. Cary: SAS Institute, 1995. 705p. SHAPIRO, S.S.; WILK, M.B. An analysis of variance test for
normality: complete samples. Biometrika, v.52, p.591-611, 1965.
SILVA, M.A.; PINCELLI, R.P.; DINARDO-MIRANDA, L.L. Efeito da aplicação de nematicidas em soqueira de cana-de-açúcar, em diferentes épocas, sobre a população de Pratylenchus zeae e atributos biométricos e tecnológicos da cultura. Nematologia Brasileira, v.30, p.29-34, 2006.
SOUTHWOOD, T.R.E. Ecological methods. 2 ed. New York: John Wiley, 1978. 525p.
TAYLOR, L.R. Assessing and interpreting the spatial distribution of insects populations. Annual Review of Entomology, v.29, p.321-357, 1984.
VIEIRA, S.R. Uso de geoestatística em estudos de variabilidade espacial de propriedades do solo. In: NOVAIS, R.F. (Ed.) Tópicos em ciência do solo. Viçosa: Sociedade Brasileira de Ciência do Solo, 2000. p.1-54.
VIEIRA, S.R.; HATFIELD, J.L.; NIELSEN, D.R.; BIGGAR, J.W. Geostatistical theory and application to variability of some agronomical properties. Hilgardia, v.51, p.1-75, 1983. WALLACE, M.K.; HAWKINS, DM. Applications of geostatistics
in plant nematology. Journal of Nematology, v.26, p.626-634, 1994.
WEBSTER, R.; BOAG, B. Geostatistical analysis of cyst nematodes in soil. Journal of Soil Science, v.43, p.583-595, 1992.