A
CONTROL
CHART METHOD FOR EVALUATING
HEMAGGLUTINATION REAGENT USED
IN CHAGAS’ DISEASE DIAGNOSIS
Sumie Host%zo-Sbimizu, 2 Teresa K. Nagasse- Sggaliara, 3 - Ezdydes A. Castd....o,4 Mario E. Camargo, and Tdmz’o Shimizu6 -
Laboratories that develop or produce their own antigen reagents for serodiagnostic purposes need a practical and reliable quality control method for evaluating the successive batches of stan- dardized reagent, so as to ensure the re- producibility of test results.
Although a large number of statistical models are available for quality control analysis of therapeutic agents or clinical laboratory equipment and proce- dures (1, 2)) very few have been de- scribed for the evaluation of serologic re- agents. This is probably because such reagents constitute a special category of biological products that measure intri- cate antibody activities in the sera of in- fected patients. The measurable output index, known as a titer, results from com- plex interactions between multiple epi-
’ This article will also be published in Spanish in the Bo- letin de /a Ofkina San&an2 Panamenkana.
2 Chief, Clinical Immunology Section, Department of Clinical Analvsis and Toxicoloev. Facultv of Pharmaceu- tical Sciences:University of S&Paulo, C.P. 30,786, SZO Paulo (SP), Brazil.
3 Biologist, Immunology Laboratory, Institute of Tropical Medicine of S%o Pa&.
4 Associate Professor, Denarm-rent of Preventive Medi- tine, Faculty of Medicine, University of SZo Paulo.
topes (antigenic determinants) of the an-
tigen reagent and a population of
polyclonal antibodies whose concentra- tions will vary depending upon the pa- tient and the stage of the disease. Hence, evaluation of these reagents to ensure that they yield standard, reproducible results demands considerable care.
When we first began prepar- ing hemagglutination reagents for the diagnosis of Tgpanosoma c~zzri infec- tions in our laboratory,’ we sometimes dealt with anomalous reagents that would give reproducible results with sev- eral standard sera, but that proved less sensitive or less specific in routine work than had been indicated by the prelimi- nary evaluations. This problem was bet- ter understood when sequential analysis was applied to control the copositivity and conegativity indexes of these re- agents by qualitative testing (3). Because
5 Chief, Immunology Laboratory, Institute of Tropical Medicine of 50 Paulo.
6 Associate Professor, Department of Industrial Engi- neering, Polytechnic School, University of Sgo Paulo. ’ The Immunology Laboratory of The Institute of Tropi-
of the much larger number of serum samples then included in the study of each new batch, it was possible to see that low-titered sera constituted the best indicators for the evaluations.
In most laboratories produc- ing serologic reagents in small batches, quality control is usually performed em- pirically and based (precariously) upon results obtained with a few standard sera or even with just one pool of sera. This is because sequential analysis, although re- liable, requires a relatively large amount of reagent and considerable expense; it therefore seems inappropriate for quality control of reagent batches when the re- agent is being produced in limited amounts.
Looking for a better proce- dure that could provide a practical alter- native for evaluating hemagglutination reagents, we investigated the “control chart” or graphic method originally de- veloped by Shewart and cited by others (4). Although employed in industry and in clinical laboratories, it appeared that this method had not previously been ap- plied for evaluating serologic reagent lots. The results of the investigation, which proved promising, are reported here in enough detail so as to permit use of the method studied.
M
ATERIALS
AND METHODS
The hemagglutination test
The reagents were prepared
and the hemagglutination tests per-
formed in the manner previously de- scribed (3), the reagents being lyophi- lized and stored at 4°C.
The serum samples
The reagent batches were evaluated with panels of sera made up of serum samples from our laboratory se- rum bank. These included sera from pa- tients with Chagas’ disease, from pa- tients with other unrelated diseases,. and from apparently normal individuals. Be- cause it was hard to obtain sera yielding titers below but near the lowest titer con- sidered positive (sera yielding titers of 40
and SO), a special panel was prepared us-
ing 23 serum samples obtained from rou- 2
tine work that yielded titers equaling or 5 exceeding 160. The efficiency of these
sera in detecting defective reagents was 2
then studied. All of the test sera were z preserved in an equal volume of analyti- z
cal grade glycerin (E. Merck, Darmstadt, 2
Germany) and stored at - 20’ C. The se- rum titers obtained were recorded as log- 2
arithms of the end-point dilutions, as 5
recommended (5). 2 T
3
The control chart method
5
This is a simple quality con-
cll
trol method that uses a panel of prese- 3lected serum samples to evaluate reagent 5
batches in terms of the differences be- tween titers obtained with a test batch
5
and those obtained with a reference re- Fi
agent. The average standard deviation i=
(s) of such differences was then plotted s
on a graph in which a previously defined ?
control limit indicated whether the devi- k
ation involved was acceptable or not. .
The control limit was established on the + basis of standard deviations found for re- 2
agent batches that had been considered .$
acceptable by a previous statistical study E based on sequential analysis, as de-
scribed (3). It would have been possible,
4 P however, to initially establish control
limits with batches empirically consid- ered satisfactory.
In practice, the control analy-
plished by doing serum titrations with panels including 10 reactive and 10 non- reactive serum samples. In order for the reagent to be judged acceptable, the ti- ters obtained with the reactive sera had to yield a standard deviation within the established control limit, and all the nonreactive sera had to yield negative results.
Other statistical methods used
Sequential analysis (3) was used to test reagent batches numbered 12 through 18, 25 through 36, and 76 through 79. This method, previously es- tablished in our laboratory, determines the acceptability of a reagent according to the extent of false positive or false neg- ative results obtained in qualitative tests of panels including over 150 serum sam- ples, in which about half the sera are pos- itive for Chagas’ disease and the remain- der are negative. This method involves individual testing of each new reagent batch.
Another method, based on determining the intraclass correlation co- efficient (ICC) (G), was also used. This method, which provides an index of agreement derived from analysis of vari- ance, was employed to confirm the rela- tive uniformity of seven reagent batches (those numbered 12 through IS), which were selected for the purpose of deriving a control limit. In addition, the method z
2 was also used to confirm the uniformity of reagents 50, 5 1, and 5 3, which were s subsequently selected for reevaluation of z the control limit. The ICC values ob- .g tained were procured by testing the sub-
9)
3 ject reagents against a panel of 20 posi- Q tive and 20 negative sera for i’: C~XZ~
s infection. In the case of reagent batches 2 on separate days, and in the case of 12 through 18 the tests were done twice
batches 50, 51, and 53 they were done 172 three times on separate days. ICC values
higher than 0.7 were considered accept- able.
RE
SULTS
A total of 26 batches of Cha-
gas’ disease hemagglutination reagent
were tested by the control chart method. These included batches that had been re- jected, as well as accepted, since 19’75 on the basis of sequential analysis.’
To determine the reference ti- ter (rT) of each serum sample in the test panels, progressively doubled dilutions of each serum were tested in triplicate against a reference hemagglutination re- agent. No differences larger than two di- lutions were observed in any of these tri- ple tests. In cases where the three results for a given serum did not coincide, the reference titer was taken to be either the most frequent titer (when two of the three results were the same) or the inter- mediate titer (when all three results dif- fered).
The seven batches of reagents (numbered 12 through 18) that were se- lected for the purpose of establishing the limit on the control chart were confirmed as being acceptable by sequential analy- sis. (Taken together, the seven batches yielded an intraclass correlation coeffi- cient of 0.88.) Each reagent batch was tested against the same panel of 40 se- rum samples-20 from Chagas’ disease patients and 20 from individuals without i’: crzlzi infections. These tests were con-
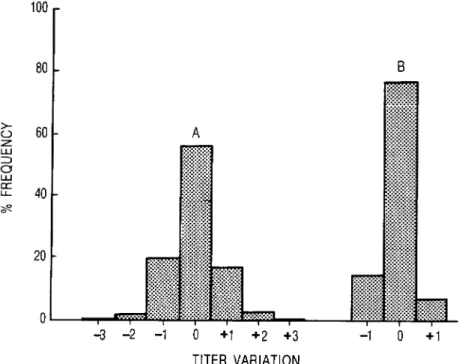
ducted in duplicate, the second on a dif- ferent day from the first, and the results were compared to those obtained with the reference reagent. .As may be seen in Figure 1 (part A), about 95 % of the titer variations observed were within one dilu- tion of the respective reference titer.
In assessing each reagent batch, the average difference between the observed titers and the reference titer was recorded for each serum, and the standard deviation for the entire panel was calculated for the batch. The arithmetic mean (7) of the standard devi- ations of all the batches was then deter- mined (4).
The usually recommended control limit corresponds to three times this mean, or 3s. In our case, the stan- dard deviations observed for the seven batches that had been approved by se- quential analysis were 0.467, 0.560,
0.438, 0.494, 0.694, 0.677, and 0.497;
and their mean (S) was 0.547. Three times this latter figure (35) was thus 1.64. However, other results obtained by se- quential analysis of batches 27, 28, 30, 33, and 34 (the first batch having been accepted and the remaining four re- jected) provided another basis for setting the control limit. Since their standard deviations, calculated as shown in Table 1, were 1.34, 1.43, 1.54, 1.60, and 1.42, respectively, it appeared that a lower con-
FIGURE 1. Differences between titers obtained with a reference reagent and those obtained with various reagent batches when tested against 20 sera from Chagas’ disease patients. The columns under “A” show the differences found in two tests (on different days) with reagent batches 12 through 18. The columns under “6” show the differences found in three tests (on different days) of improved reagent batches 50, 51, and 53. All of the differences are expressed as log, of the end- point dilution divided by 10 (log, 0.1 T - log, 0.1 rT).
20 -
0 1
-3 -2 -1 0 +1 +2 +3 -1 0 +1
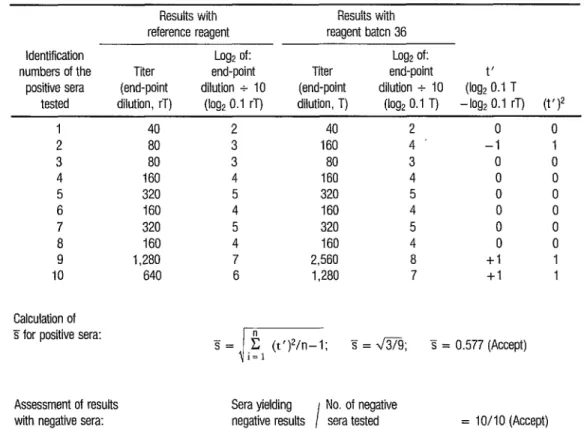
TABLE 1. Assessment of a reagent batch (number 36) by the control chart method. The upper portion of the table shows the resuits obtained by testing 10 posftffe sera against the chosen reference hemagglutination reagent and against reagent batch 36. The lower portion shows the equation used to calculate the standard deviation of the reference and test reagent titers, and also shows that batch 36 yielded negative results with all of the 10 negatiie sera.
Identification numbers of the positive sera
tested
Results with Results with reference reagent reagent batcn 36
Log, of: Logp of:
Titer end-point Titer end-point
(end-point dilution + 10 (end-point dilution t 10 (Iog,‘b.l T dilution, rT) (log, 0.1 rT) dilution, T) (log, 0.1 T) -log, 0.1 rT) (t’)*
1 40 2 40 2 0
2 80 3 160 4 -1
3 80 3 80 3 0
4 160 4 160 4 0
5 320 5 320 5 0
6 160 4 160 4 0
7 320 5 320 5 0
8 160 4 160 4 0
9 1,280 7 2,560 8 +I
IO 640 6 1.280 7 +l
Calculation of S for positive sera:
Assessment of results with negative sera:
0 1 0 0 0 0 0 0 1 1
3=m9; 3 = 0.577 (Accept)
Sera yielding 1 No. of negative
negative results / sera tested = IO/IO (Accept)
trol limit between 2Z ( 1.09) and 3T (1.64)
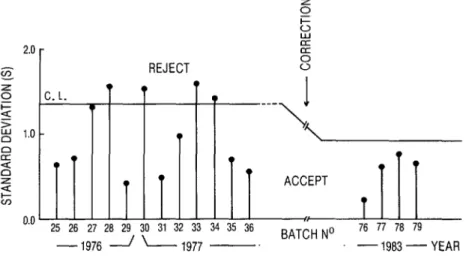
should be set. Accordingly, 2.5s was taken as the limit, this corresponding to a variation of 1.37-a limit that would accept batch 27 and reject the others.
Usually, panels of 10 reactive and 10 nonreactive serum samples were employed to test each new reagent batch, as indicated in Table 1. The calcu- lated standard deviation value was then compared to the control limit (Figure 2) to decide whether or not the reagent should be accepted.
Within a few years of the time these procedures had been adopted, however, several improvements were in- troduced in both preparation and han-
FIGURE 2. A control chart for Chagas’ disease hemagglutination reagent batches produced in differ- ent years. Batches were accepted or rejected according to the average standard deviation found when the titers they yielded with a panel of 10 negative and 10 positive sera were compared to the titers obtained with a reference reagent. The control limit employed initially (1.37) was later lowered to 0.92 as a result of improved reagent production.
REJECT
25 26 27 26 29 30 31 32 33 34 35 36
BATCHNO 76 77 76 79
-1976 / - 1977 -. -1983-YEAR
All three of the batches used had been accepted on the basis of prior control chart analysis and had shown a high intraclass correlation coeffkient value of 0.96. None of the 10 reagent batches used to set the initial control limit or to reevaluate that limit yielded any false positive or false negative results when tested against panels of 40 sera, 20 from Chagas’ disease patients and 20 from uninfected subjects.
A basic step in the foregoing procedures was selection of appropriate serum samples for inclusion in the serum panels to be tested. Before this selection began, it was noted that previous se- quential analysis had found low-titered sera (with titers of 40 or 80) to be espe- cially good indicators of poor reagents. However, such low-titered sera are rela- tively uncommon and hard to get. Therefore, relatively high-titered sera
typical of the reactive sera observed in our routine serodiagnosis of Chagas’ dis- ease were employed.
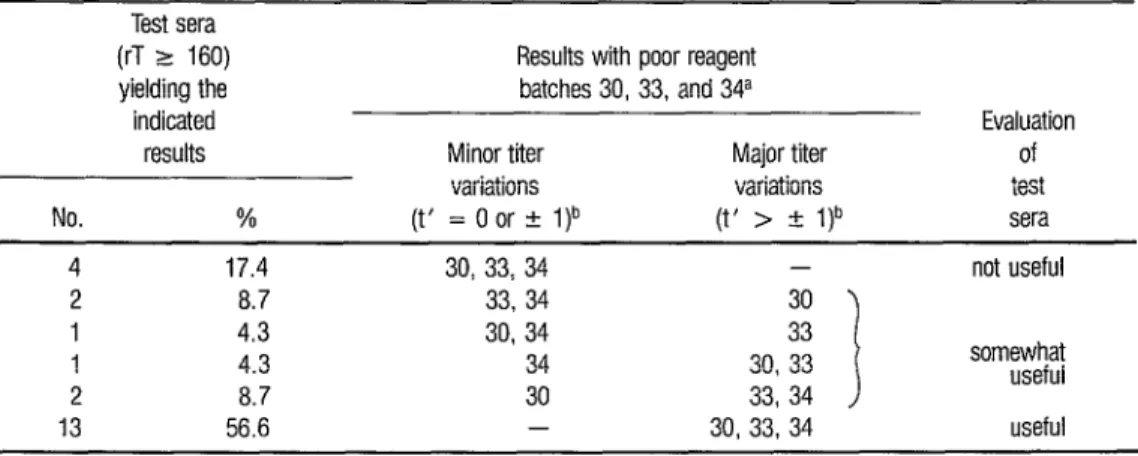
Later, to review the appropri- ateness of this procedure, a panel of 23 serum samples yielding titers of 160 or more was tested against five reagent batches numbered 30 through 34. Three of these batches (30, 33, and 34) had previously been rejected by control chart and sequential analysis evaluations, while two (31 and 32) had been ac- cepted. As already noted, test sera should yield variations (compared to a reference standard) of one dilution or less with a good reagent (see Figure 1, part B), while yielding larger variations with a poor reagent.
yielded titers more than one dilution re- moved from the reference titer for all three reagents (Table 2), and so these 13 sera were considered “useful” for detect- ing poor reagent batches. Also, six other sera appeared “somewhat useful” be- cause they yielded titers more than one dilution removed from the reference titer with one or two of the poor reagent batches. The four remaining sera were not considered “useful” because they yielded no titers removed from the refer- ence titer by two dilutions or more when tested with the three poor reagent batches. (Sera such as these latter can in- advertently introduce a bias in laboratory work that favors approval of unsatisfac- tory reagents.)
D
ISCUSSION
AND CONCLUSIONS
This study demonstrates ap- plication of the control chart method to evaluate hemagglutination reagents used for Chagas’ disease serodiagnosis. Al-
though the method is based on quantita- tive testing, the statistical techniques in- volved are simple, and the method is easy to apply. Of course, the choice of re- agent testing methods naturally depends on assumptions made about each pre- vailing situation, but the practical advan- tages of the control chart technique sup- port its use.
Our study of sera with anti- body titers of 160 or more clearly indi- cates that adequate reagent quality con- trol cannot be ensured by testing the reagent against a few standard sera of this variety, because of the possibility that such sera will belong in the “not useful” category and will be unable to detect de- fective reagents. In this vein, we found that our few standard sera (prepared by pooling serum samples) had features similar to the sera deemed “not useful,” probably because these pooled sera con- tained high levels of antibodies to most T. crzlzi epitopes, differing in this respect from most individual sera provided by Chagas’ disease patients.
TABLE 2. Results obtained with three poor reagent batches (numbers 30, 33, and 34) and two good reagent batches (numbers 31 and 32) when all Iive were tested against 23 sera yielding titers of 160 or more with the reference reagent. Thirteen of these sera yielded markedly different tiers with the reference reagent than with each of the three poor reagents.
Test sera
(rT 2 160) Results with poor reagent yielding the batches 30, 33, and 34a
indicated Evaluation
results Minor titer Major titer of
variations variations test No. % (t’ = 0 or 2 l)b (t’ > z!I l)b sera
4 17.4 30, 33, 34 - not useful
2 8.7 33, 34 30
1 4.3 30, 34 33
1 4.3 34 30, 33
I
somewhat useful
2 a.7 30 33, 34
13 56.6 - 30, 33, 34 useful
a Good reagent lots 31 and 32 were also tested Only narrow tier varlahons (t’ + 1) were observed wrth all 23 sera
As brought out previously (3)) sequential analysis has shown low-titered sera (with titers of 40 or 80) to be espe- cially good indicators of defective reagent batches. However, the control chart stud- ies reported here show that sera with higher titers can serve as very adequate test samples in serum panels. Fortu- nately, the preparation of such panels is not difficult, since sera of the latter type can be obtained in the course of normal, routine serodiagnosis of Chagas’ disease. Sera that are “not useful” appear to con- stitute something on the order of 17 % of all sera collected in this manner.
In practice, a good panel of sera should have few or no “not useful” sera, consisting entirely of “somewhat useful” and “useful” samples (and per- haps some low-titered sera) in order to ensure sensitivity in detecting poor re- agent batches.
In general, the serum samples in a given panel can be replaced by oth- ers so long as the others’ reference titers and ability to detect unsatisfactory re- agents are comparable to those being re- placed.
A laboratory wishing to apply the technique described here should start by preparing its own serum panels (test- ing sera with batches of hemagglutina- tion reagent empirically found good or poor), or else by getting some help with this process from other already-estab- lished laboratories. Then, after reference titers are determined for these sera, the control chart limit can be set. Subse- quently, simple statistical methods (Stu- dent’s t test or other suitable procedures)
can be used to confirm the validity of the control chart results obtained.
The work reported here was done with panels of serum samples pre- served in equal volumes of glycerin at - 20’C. This procedure was found to be very appropriate; besides ensuring serum stability, the temperature of - 20°C en- abled the mixtures of glycerin and serum to remain liquid, so that small aliquots could be removed easily whenever they were needed, without risking the anti-
body denaturation that tends to result Z
from repeated freezing and thawing. 5
We recently received a per-
sonal communication from Dr. Morris T. 2
Suggs, Director of the Biological Prod- 2 u
ucts Program at the United States Center i=
for Infectious Disease in Atlanta, stating 3 that in the United States some 10% to
15 % of the serodiagnostic reagents 9
(commercial kits for serodiagnosis) pro- 5
duced each year are unsatisfactory, even 2
those provided by leading manufactur- T
ers. He has therefore recommended that 2
one way to obtain good reagents at low 5 k cost is to build quality control into pro-
duction from the beginning. The control 3
chart method described here offers a $ u practical way of assessing successive he-
magglutination reagent lots. And, partly 3
because it gives a progressive graphic his- 5 tory of reagent variability, it provides a R convenient visual aid for controlling re- 3
agent quality. ?
k .
A
CKNOWLEDGMENTS
j
This investigation was sup- ported in part by Brazil’s National Coun- cil of Scientific and Technologic Devel- opment (Cons&o Naciond de Desen-
vohimento Cientzffi’co e Tecnohgico), 2
Grant No. 222-8-156/80, and by the ’
World Health Organization (WHO /
S
UMMARY
Laboratories that produce their own antigen reagents for serodiagnostic pur- poses need to have practical and reliable ways of testing successive batches of those products so as to ensure the reproducibility of test results. In the case of hemagglutination re- agents for the diagnosis of Chagas’ disease, the technique of sequential analysis provides adequate quality control. However, sequen- tial analysis requires a relatively large amount of reagent and considerable expense. This ar- ticle describes another method, a “control chart” technique, that is less elaborate and seems better suited to assessing small reagent batches.
The latter method requires a ref-
erence reagent, a panel of some 20 serum
samples, and an established limit of variance beyond which the reagent batch under assess- ment should be rejected. The serum samples should consist half of sera reactive with T. crzlzi antigen and half of nonreactive sera, and the reactive sera should be “useful” in the sense that they tend to respond differ- ently when tested with a good reagent (such as the reference reagent) than with a poor re- agent.
Following this procedure, both the reference reagent and the reagent to be assessed are tested against the serum panel; differences in the titers obtained by the two reagents are noted; the average standard de- viation (a) of these differences is calculated and charted; and if this deviation is less than the previously established control limit, the %
2
reagent batch is accepted; otherwise, it is re- jetted. This method has been used by the .
52 Immunology Laboratory at the Institute of
G Tropical Medicine in SZO Paulo, Brazil, to test
f! 26 batches of reagent produced at the labora-
‘G u tory since 1975. That experience has shown *
d used to detect defective reagents, has indi- that sera yielding relatively high titers can be cated that preservation of sera in an equal volume of glycerin and storage at - 20°C is effective, and has demonstrated the applica- bilitv and usefulness of the control chart
Rx
FERENCES
1 Barnett, R. N. Clinical’ Laboratory Statisticr (seconded.). Little Brown, Boston, 1979.
2 Mack Publishing Corn maceutical’ Sciences
any. Remington i Phar- / ourteenth ed. ). Easton. v 1 1970.
3 Hoshino-Shimizu, S., M. E. Camargo, T. Shim& and T. K. Nagasse-Sugahara. A study on the reproducibility of a stable, lyophilized reagent for the Cha as’ disease hemagglutina- tion test: Proposals or quality control analysis. B
Rev Inst Med Trap Go Pado 24(2):63-68, 1982.
4 Burr, T. W. Engineering Statistics and Quality CO&TO/. McGraw-Hill, New York, 1953. 5 White, C. Statistical Methods in Serum Sut-
veys. In: J. R. Paul and C. White (eds.). Sero- Logical Epidemiol’ogy. Academic Press, New York, 1973, p. 19.
G Winer, B. J. StatisticaL Phxiples in Experimen- talDesign. McGraw-Hill, New York, 1962.