Artigo
*e-mail: [email protected]
SEQUENTIAL INJECTION ANALYSIS SYSTEM WITH SPECTROPHOTOMETRIC DETECTION FOR DETERMINATION OF NORFLOXACIN AND CIPROFLOXACIN IN PHARMACEUTICAL FORMULATIONS
José Luiz Ruino, Helena Redigolo Pezza e Leonardo Pezza*
Instituto de Química de Araraquara, Universidade Estadual de São Paulo, CP355, 14801-970 Araraquara - SP, Brasil
Paula C. A. G. Pinto, M. Lúcia M. F. S. Saraiva e José L. F. C. Lima
Departamento de Química-Física, Faculdade de Farmácia, Universidade do Porto, Rua Aníbal Cunha 164, 4099-030 Porto, Portugal
Recebido em 15/3/10; aceito em 17/9/10; publicado na web em 8/12/10
This work proposes a sequential injection analysis (SIA) system for the spectrophotometric determination of norfloxacin (NOR) and ciproloxacin (CIP) in pharmaceutical formulations. The methodology was based on the reaction of these drugs with p-(dimethylamino)cinnamaldehyde in micellar medium, producing orange colored products (λmax = 495 nm). Beer´s law was obeyed in the concentration range from 2.75x10⁻⁵ to 3.44x10⁻⁴ mol L-1 and 3.26x10⁻⁵ to 3.54x10⁻⁴ mol L-1 for NOR and CIP, respectively and sampling rate was 25 h-1. Commercial samples were analyzed and results obtained through the proposed method were in good agreement with those obtained using the reference procedure for a 95% conidence level.
Keywords:sequential injection analysis; spectrophotometry; pharmaceutical formulations.
INTRODUCTION
Ciprofloxacin (CIP) (1-cyclopropyl-6-fluoro-1,4-dihydro-4-oxo-7-(1-piperazinyl)-3-quinoline carboxylic acid)1 and norloxacin (NOR) (1-ethyl-6-luoro-1,4-dihydro-4-oxo-7-(1-piperazinyl)-3-quinolone carboxylic acid)2 are compounds from the luoroquinolone family.3 This group comprises a series of broad-spectrum synthetic, antibacterial agents derived from nalidixic acid and their antibacterial spectrum includes activity against both Gram-positive and Gram-ne-gative bacteria.3-5 These compounds are effective in systemic therapy, being used in the treatment of prostatitis, respiratory infections and sexually transmitted diseases.
Several analytical methods have been reported in the literature for determining CIP and NOR in pharmaceutical formulations and/or biologic luids using techniques such as spectrophotometry,6,7 charge transfer complex formation,8,9 derivative UV spectrophotometry,10,11 high performance liquid chromatography,12,13 capillary electrophore-sis,14-16 luorescence,17 immunoassay,18 low injection analysis,19-22 and SIA.23 However, many of these methods present low selectivity,10,11 are time-consuming,6,7,9 involving the use of organic solvents 8,9,12,17 or require expensive instruments12-18 and for these reasons they are not suitable for routine analysis. Thus, there is an important demand for simple, low-cost, sensitive and rapid alternative methods for the determination of CIP and NOR in pharmaceuticals.
Automatic methods based on low injection analysis (FIA) have also been proposed using detection techniques such as spectropho-tometry19,20 and chemiluminescence.21,22 To the best of our knowledge, only one SIA method exists for the determination of CIP and NOR in pharmaceutical formulations.23 The method is based on the complex-ation reaction of the drugs with iron (III) in sulphuric acid media using spectrophotometric detection and focuses mainly on theoretical studies that demonstrate the versatility of the SIA technique for determining stoichiometries and stability constants. SIA was developed by Ruzicka and Marshall24 as an alternative procedure to FIA, offering signiicant
advantages in terms of manifold simplicity, robustness, low reagent consumption and reduced efluent production. The unique mode of operation of the SIA technique (based on low reversal) makes it an excellent tool for automating routine procedures since it permits pre-cise control of the reaction conditions. Moreover, effective computer control of the most relevant analytical parameters at run-time ensures high operational lexibility and reproducibility, allowing controlled determinations that demand precise control of low conditions to be implemented. A review detailing the application of SIA in pharmaceuti-cal analysis was published by Pimenta et. al,25 which describes a short historical background of this technique as well as a brief discussion of its basic principles and potential. Current applications of SIA in pharmaceutical analysis are also described and discussed.
The present work describes the development and application of a simple, low cost SIA-spectrophotometric method for quantitative determination of CIP and NOR in pharmaceutical formulations. The method is based on the reaction of these compounds with p -(dimethylamino)cinnamaldehyde (p-DAC) in acid medium in the presence of the anionic surfactant sodium dodecyl sulfate (SDS) producing orange colored compounds (λmax = 495 nm).
By implementing the determination of CIP and NOR into a SIA system, it was intended to provide a fast, automatic and robust method suitable for routine quality control that could provide an expeditious alternative to existing methods for the same purpose.
EXPERIMENTAL
Apparatus
A Jenway 6300 spectrophotometer equipped with a low-cell of 10 mm path length and 18 µL inner volume was used for monitoring the absorbance.
Manifold components were connected by means of polytetra-luorethylene (PTFE) tubing of 0.8 mm i.d. which was also used for the holding and reaction coils. A thermostatically-controlled water bath was used to keep the temperature of the reaction coil constant. Analytical system control, including the operation of the peristal-tic pump and selection valve was achieved by means of a Pentium-I based microcomputer. Software was developed in Microsoft Quick-Basic and permitted control over low rate, low direction, valve position as well as sample and reagent volume.
The analytical signals for optimization and data acquisition were recorded on a Kipp & Zonen BD 111 strip chart recorder.
Reagents and analytical solutions
High purity deionized water with a speciic conductance < 0.1 µS cm-1 obtained by using a Milli-Q Plus system was used throughout. All reagents were of analytical grade.
Stock solutions of HCl 1.0 mol L-1 and sodium dodecyl sulfate (SDS) (Sigma-Aldrich) 0.10 mol L-1 were prepared in water.
A solution of p-(dimethylamino)cinnamaldehyde (p-DAC) (Sigma-Aldrich) 0.20% (m/v) was obtained by dissolving 100 mg of solid in 3 mL of HCl 1.0 mol L-1. The inal volume was adjusted in a 50 mL volumetric lask with water. The resulting solution was stable for a period of 2 weeks when refrigerated (4 oC).
Pharmaceutical grade ciproloxacin hydrochloride (purity 100.0 %) and norloxacin (purity 99.84%) were purchased from Purifarma (Brazil) and stock solutions of CIP 1.24 x 10⁻³ mol L-1 and NOR 1.50 x 10⁻³ mol L-1 were used. The solutions were prepared separately by dissolving 12 mg of solid in 0.20 mL of HCl 1.0 mol L-1 and adjusting the volume in a 25 mL volumetric lask with water. Working standard solutions were prepared by appropriate dilution of the stock solutions in SDS 0.010 mol L-1.
SIA procedure
Table 1 summarizes the optimized analytical cycle for the determination of CIP and NOR in a SIA system. The cycle started with the aspiration of 150 µL of reagent to the holding coil (HC, Figure 1) at a low rate of 1.0 mL min-1 (Step 1, Table 1). Sequentially, 233 µL of sample were aspirated to the HC at a
low rate of 0.5 mL min-1 (Step 2, Table 1). By low reversal, the reaction zone was directed for detection at a low rate of 2.0 mL min-1. After 20 s the low was stopped (Step 3, Table 1) and the reaction zone was maintained in the reaction coil (RC, Figure1), which was submersed in a thermostatically-controlled bath at 40 ºC for 45 s (Step 4, Table 1). After the stop period, the formed product was sent for detection at a low rate of 3.0 mL min-1 (Step 5, Table 1). The passage of the colored product through the low injection spectrophotometric cell results in a transient signal that is recorded as absorbance at 495 nm, which is proportional to the concentration of CIP and NOR in the sample.
Reference method
With a view to carrying out a comparative evaluation, the sam-ples analyzed by the developed procedure were also analyzed by the reference methodology recommended by the US Pharmacopoeia,26 consisting of a HPLC method with UV detection.
Sample preparation
Commercial pharmaceutical formulations readily available in Brazil and Portugal, containing varying quantities of CIP or NOR drawn from different batches and brands were analyzed by both the proposed and reference methods.
Fourteen tablets from each pharmaceutical brand were precisely weighed before being ground to a ine powder and homogenized. Portions of this powder were then used for preparing the samples to be analyzed by each method.
Regarding analysis by the developed SIA methodology, a portion of powder equivalent to approximately 45 mg of drug was accurately weighed. The sample was then dissolved in 1.0 mL of HCl 1.0 mol L-1 and 20 mL of water before being transferred to a 50 mL volumetric lask. The mixture was sonicated for 5 min and the volume completed with water. In the following step, the obtained solution was iltered through a Whatman 41 ilter-paper and a 0.50 mL aliquot of the iltrate was diluted in SDS 0.010 mol L-1. Samples were then analyzed by the developed SIA procedure.
The samples to be analyzed by the HPLC reference procedures were prepared according to the oficial procedure described in US Pharmacopoeia.26
RESULTS AND DISCUSSION
The following describes all studies conducted to optimize the phy-sical and chemical parameters involved in the determination of CIP and NOR in the SIA automatic system. Additionally, it summarizes the results obtained from analysis of the pharmaceutical formulations and their validation.
Table 1. Analytical cycle used for the determination of norloxacin and ciproloxacin
Step Position Time (s)
Flow rate (mL min-1)
Volume (µL)
Description
1 1 9 1.0 150 Aspiration of reagent 2 2-9 28 0.5 233 Aspiration of sample 3 10 20 2.0 − Propulsion to the ther-mostatically-controlled
reactor
4 10 45 0 − Stopped-low
5 10 55 2.5 − Propulsion to the detector Figure 1. Schematic representation of the SIA manifold used: C, carrier
(solution of HCl 5.0 x 10⁻² mol L-1); PP, peristaltic pump; HC, holding coil
Preliminary tests
It is known that aromatic primary and secondary amines can react with p-DAC in acid medium. This reaction takes place via the condensation of the protonated primary amino group with the car-bonyl group of the reagent to produce an imminium salt.27-29 Batch studies performed before the implementation of the reaction in the SIA system allowed us to conirm that both CIP and NOR react with p-DAC in acidic medium to form an orange colored product that can be detected at 495 nm. The probable mechanism for this reaction is shown in the Scheme 1, which is to large extent based on reactions suggested in the literature.27-29
These studies also conirmed the effect of SDS micelles in the condensation of p-DAC with aromatic amines30-32 and revealed the dependence of the reaction on temperature. Micelles can increase the molar absorptivity of the chromophore, modify equilibrium constants and reaction yields, shift spectral bands, co-solubilize samples, reagents and products, and catalyze reactions.30 The mi-cellar medium can improve the spectrophotometric detection in low injection analysis by providing an increase in the formation rate of the chromophore and an increase in the sensitivity.30 In addition, the surfactants can also be useful in softening the experimental conditions required to carry out the reaction, such as: reducing the temperature or acid and reagent concentrations.30,31 This is of interest for simpliication of manual and automated analytical procedures, and will contribute to green chemistry,32 due to its capability of decreasing the reagent consumption and as a consequence, mini-mizing efluent generation.
The catalytic effect of SDS in the condensation of primary aromatic amines with p-dimethylaminocinnamaldehyde has been described in the literature.30 In this study was demonstrated that the concentrations of the protoned form of PDAC and neutral form of the aromatic amine increase in going to sodium dodecyl sulfate micelles. Insofar as both these are reactive species and their formation is favored in the presence of SDS, the rate of the condensation of amine with PDAC increases. These previous considerations suggest that, proba-bly, the SDS presents a similar catalytic effect in the condensation of norloxacin/ciproloxacin with PDAC (Scheme I).
Optimization of chemical and physical parameters
To take full advantage of the developed SIA procedure, several studies were performed with the aim of investigating the inluence of sample and reagent volumes, reagent concentration, low rate and reaction coil length as well as coniguration, on the formation of the colored product and consequently, on the respective absorbance signal. The optimization of the procedure also included studies re-garding the inluence of temperature, surfactant concentration, carrier composition and duration of stop period on the analytical signals. For this purpose, the experimental parameters were optimized by setting all parameters constant and optimizing each one individually. Each experiment was replicated at least three times.
The inluence of sample volume was investigated in the range 150 to 250 µL. Results showed that the analytical signals increased by a factor of approximately 1.3 times with volume until 233 µL and that higher volumes did not lead to a signiicant change in absorbance values. A sample volume of 233 µL was then used to conduct the optimization studies and determinations.
Reagent volume studies between 50 and 200 µL revealed that the analytical signals increased by about 85% until 150 µL. Furthermore, higher reagent volumes led to insigniicant changes in sensitivity so that subsequent studies were performed with 150 µL of reagent.
Assessment of the effect of p-DAC concentration on reaction development was investigated in the range 0.11 to 0.26% (m/v). It was found that a concentration of 0.20% (m/v) led to the best conditions in terms of sensitivity. Moreover, it was observed that in more concen-trated solutions the analytical signals remained practically constant, so that a p-DAC 0.20% (m/v) solution was used for further studies.
Due to the conirmed effect of SDS on reaction development, the working standard solutions of NOR and CIP were prepared in a solution of this surfactant. The use of micellar media formed by sur-face-active substances is associated with changes in the equilibrium, kinetic and spectral properties of chemical reactions and represents an interesting tool for improving the characteristics of analytical proce-dures. These changes can be observed over a wide range of surfactant concentrations, below and above the critical micelle concentration. The two primary factors responsible for catalysis in micellar solutions are the change in reactivity of the reagents upon transfer from the bulk water to the micelle media and the concentration effect. The critical micelle concentration (CMC) of SDS in aqueous medium described in the literature is 8.3 x 10⁻³ mol L-1.33 Thus, the inluence of SDS concentration on the reaction was investigated over the range 1.0 x 10⁻² to 1.5 x 10⁻² mol L-1 and it was observed that for concentrations above 1.0 x 10⁻² mol L-1 the absorbance decreased gradually, showing that the surfactant effect is better for concentrations near the CMC. The determination was performed with standard solutions of the analytes prepared in a solution of SDS 1.0 x 10⁻² mol L-1.
Due to the inluence of pH on the reaction, a study on the effect of HCl concentration (carrier solution) on analytical signal was performed in the range between 1.0 x 10⁻² and 5.0 x 10⁻² mol L-1. Results showed that the sensitivity was unaffected by changes in carrier concentration. However, it was evident that the removal of the colored product from the low cell was faster for higher concentra-tions, implying a quicker return to the baseline. In an effort to reduce analysis time and thus increase sampling rate, the studies proceeded by using HCl 5.0 x 10⁻² mol L-1 as carrier solution in the low system.
The dependence of the reaction on temperature (previously observed in the preliminary batch studies), was conirmed during optimization of the procedure in the SIA system. It was initially ob-served that almost no reaction took place at room temperature and as a consequence, the reaction coil was submerged in a thermostatically-controlled water bath with a view to creating the ideal conditions for Scheme 1. Proposed mechanism of the reaction between norloxacin and
reaction development. Due to the bidirectional nature of the low in the SIA system, it was possible to implement a stop period of the aspirated zones in the reaction coil. This was aimed at increasing the reaction time and consequently, in the sensitivity. The effect of water bath temperature and duration of stop period was shown to be extremely important for the reaction of p-DAC with both CIP and NOR. The reaction zone was stopped in the thermostatically-controlled reaction coil for time periods ranging from 30 to 45 s and the effect of water bath temperature was studied between 25 and 40 ºC. These studies revealed that the analytical signals were almost doubled when the reaction zone was stopped in the reaction coil (with the temperature set at 40 ºC) for a period of 45 s. These conditions were thus selected for subsequent studies as a compromise between sensitivity and sampling rate. Indeed the increase in sensitivity associated with longer stop periods was in-signiicant considering application of the methodology to the analysis of pharmaceutical formulations. Regarding the effect of temperature, higher temperatures were shown to give rise to the formation of air bubbles inside the low system, thereby hindering the determinations. Other important parameters affecting the magnitude of the analyti-cal signals were low rate and reaction coil length, whose optimization allowed the optimum residence time of the reaction zone inside the low to be established, thereby avoiding excessive dilution of the formed product. The effect of reactor length was investigated between 1.0 and 1.5 m. These studies were performed with igure-eight shaped reactors due to the conirmed fact that they give rise to lower disper-sion of the reaction zone on its way to the detector. Results showed that the increase in reactor length caused a decrease and widening of the peak which was probably due to an excessive dilution of the formed product caused by the enhancement of dispersion. Thus, the studies proceeded with a 1 m igure-eight shaped reactor. The effect of propulsion low rate after the stop period was studied between 2.0 and 3.0 mL min-1. It was found that due to the implementation of the stop period (which created the ideal conditions for color development) the analytical signals were not signiicantly affected by changes in the propulsion low rate, within the studied range. As a compromise between sampling rate and repeatability, further investigations were performed using a propulsion low rate of 2.5 mL min-1.
Analytical data
Following optimization of all parameters affecting the reaction of p-DAC with CIP and NOR, the developed analytical methodology was evaluated for CIP and NOR concentrations in the range 3.26 x 10⁻⁵ to 3.26 x 10⁻⁴ mol L-1 and 2.75 x 10⁻⁵ to 3.44 x 10⁻⁴ mol L-1, res-pectively. The automatic SIA method was then validated by evaluating the following parameters: linear dynamic range, precision, accuracy, limit of detection (LOD) and limit of quantiication (LOQ).34
Under the optimized experimental conditions, the analytical curves were obtained showed good linearity within the range of concentrations used. The linear data was adjusted using the equation A = a + b [C] where A is the absorbance, athe intercept, b slope and [C]drugs’concentration in mol L-1 (Table 3).
The limits of detection (LOD) and quantiication (LOQ) were cal-culated according to Skoog, et al.34 using the following expressions: LOD = 3σ/b and LOQ = 10σ/b, where σ is the standard deviation of twenty blank measures and b is the slope of the analytical curves. The proposed SIA methodology yielded a sampling rate of 25 h-1.
Interferences
The effects of common excipients present in commercial phar-maceutical formulations such as microcrystalline cellulose, hydroxy-propylmethylcellulose, polyethyleneglycol, lactose, titanium dioxide, talc and magnesium stearate were evaluated. A species was considered as non-interfering when the analytical signal variation (regarding that obtained in its absence), was lower than 3%. Solutions of CIP and NOR 1.5 x 10⁻⁴ mol L-1 as well as increasing concentrations of the excipients were analyzed by the developed SIA methodology. Results showed that the presence of the abovementioned excipients up to 10-times the weight ratio to CIP or NOR, did not give rise to interference in the determination of these drugs.
Analytical applications
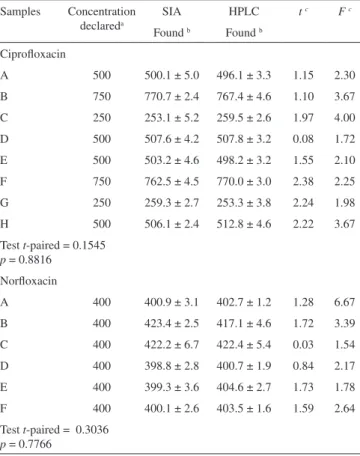
The developed SIA methodology was applied to the determina-tion of CIP and NOR in pharmaceutical formuladetermina-tions (Table 4). In an effort to evaluate the accuracy of the proposed method, the results were compared with those furnished by the oficial HPLC methods.26 No signiicant differences were observed between the results obtained by both methods with a relative deviation lower than 2.5% conirming that the SIA procedure can be satisfactorily applied to the determina-tion of these drugs in pharmaceutical formuladetermina-tions. Statistical analysis of the results obtained by the proposed and reference methods using both the t-test and F-test35 showed no signiicant statistical differences between the performances of the methodologies for a 95% conidence level. It was also noticed that the t-paired at the 0.05 level, the two means are not signiicantly different.
Compared with previously reported methods for the determina-tion of norloxacin and ciproloxacin the proposed method was less sensitive than other methods reported in literature (Table 5). However, many of these methods are time-consuming,6,7,9 involving the use of organic solvents,8,9 present low selectivity,10,11 and for these reasons they are not suitable for routine analysis.
The repeatability of the proposed method was tested by repeated runs of a real sample containing the equivalent of 1.41 x 10⁻⁴ mol L-1 of NOR. The relative standard deviation (rsd) was lower than 1% (n = 8), revealing an excellent precision.
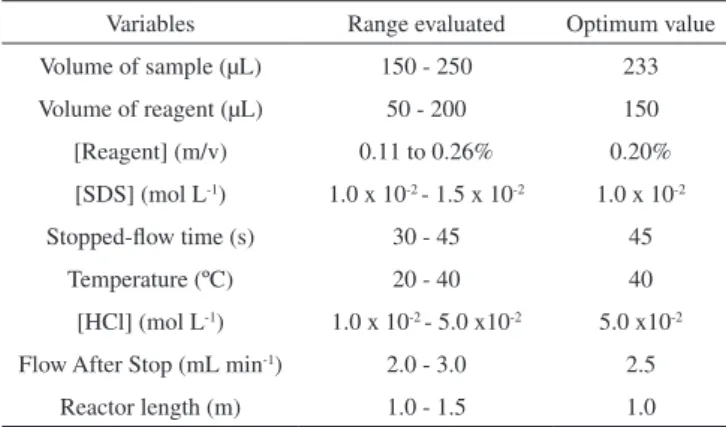
Table 2. Optimized conditions for the determination of CIP and NOR in the SIA system
Variables Range evaluated Optimum value Volume of sample (µL) 150 - 250 233 Volume of reagent (µL) 50 - 200 150 [Reagent] (m/v) 0.11 to 0.26% 0.20% [SDS] (mol L-1) 1.0 x 10⁻² - 1.5 x 10⁻² 1.0 x 10⁻² Stopped-low time (s) 30 - 45 45
Temperature (ºC) 20 - 40 40 [HCl] (mol L-1) 1.0 x 10⁻² - 5.0 x10⁻² 5.0 x10⁻² Flow After Stop (mL min-1) 2.0 - 3.0 2.5
Reactor length (m) 1.0 - 1.5 1.0
Table 3. Figures of merit of the proposed SIA method
Parameters Ciproloxacin Norloxacin Linear dynamic range (mol L-1) 3.26x10⁻⁵-3.26x10⁻⁴ 2.75x10⁻⁵ -3.44x10⁻⁴
CONCLUSION
The proposed SIA system developed for the determination of CIP and NOR in pharmaceutical formulations proved to be an interesting Table 4. Determination of ciproloxacin and norloxacin in commercial pharmaceutical formulations
Samples Concentration declareda
SIA HPLC t c F c
Found b Found b Ciproloxacin
A 500 500.1 ± 5.0 496.1 ± 3.3 1.15 2.30 B 750 770.7 ± 2.4 767.4 ± 4.6 1.10 3.67 C 250 253.1 ± 5.2 259.5 ± 2.6 1.97 4.00 D 500 507.6 ± 4.2 507.8 ± 3.2 0.08 1.72 E 500 503.2 ± 4.6 498.2 ± 3.2 1.55 2.10 F 750 762.5 ± 4.5 770.0 ± 3.0 2.38 2.25 G 250 259.3 ± 2.7 253.3 ± 3.8 2.24 1.98 H 500 506.1 ± 2.4 512.8 ± 4.6 2.22 3.67 Test t-paired = 0.1545
p = 0.8816 Norloxacin
A 400 400.9 ± 3.1 402.7 ± 1.2 1.28 6.67 B 400 423.4 ± 2.5 417.1 ± 4.6 1.72 3.39 C 400 422.2 ± 6.7 422.4 ± 5.4 0.03 1.54 D 400 398.8 ± 2.8 400.7 ± 1.9 0.84 2.17 E 400 399.3 ± 3.6 404.6 ± 2.7 1.73 1.78 F 400 400.1 ± 2.6 403.5 ± 1.6 1.59 2.64 Test t-paired = 0.3036
p = 0.7766
a mg tablet-1; b average ± standard deviation (S.D) of 3 independent analysis; c calculated values of t and F (Theoretical values for a 95% conidence level: t = 2.78; F = 19.00)
Table 5. Comparison of the analytical performance of the previously reported spectrophotometric methods and the proposed in this work for the determina-tion of norloxacin and ciproloxacin in pharmaceutical formuladetermina-tions
Linear range/ mol L-1
Reagent Ref. Norloxacin Ciproloxacin
9.37x10⁻⁶ - 3.12 x10⁻⁵ 7.75x 10⁻⁶ - 2.58 x 10⁻⁵ palladium(II) and eosin
6
- 1.03x10⁻⁷ - 1.86 x 10⁻⁵ tris(o -phenanthro-line) iron(II)
7
- 1.29x10⁻⁷ - 2.33x10⁻⁵
tris (bipyridyl) iron(II)
7
- 4.13x10⁻⁵ - 2.48x10⁻⁴ Chloranilic acid 8 - 6.46x10⁻⁶ - 3.87x10⁻⁵ tetracyanoethylene 8 1.25x10⁻⁶ - 2.07x10⁻⁵ 1.29x10⁻⁶- 1.55x10⁻⁵ Brilliant Blue G e
NaOAc-AcOH 9
3.88x10⁻⁸ - 2.5x10⁻⁷ 9.04x10⁻⁸ - 3.1x10⁻⁷ Cu(II) * 10 2.58x10⁻⁶ - 2.58x10⁻⁵ 5.17x10⁻⁶ - 3.1x10-5 * 11 2.75x10⁻⁵ - 3.44x10⁻⁴ 3.26x10⁻⁵ - 3.26x10⁻⁴ p-DAC and SDS Proposed
method *Derivative spectrophotometric
alternative to existing methodologies for the same purpose due to the implementation of a simple chemical reaction in a SIA system. Indeed, the developed automatic procedure was shown to be fast, inexpensive, robust and simple, permitting the analysis of a large sample number without the need for system recalibration. Moreover, the proposed automatic methodology exhibited high repeatability and involved no speciic or complex sample pretreatment.
Regarding those FIA procedures19-22 developed for the same pur-pose, the developed procedure (apart from permitting two compounds to be determined) involved very low reagent consumption as well as low efluent production, thereby decreasing analysis costs. Further-more, the developed methodology was fully automated, requiring little operator intervention.
The applicability of the developed procedure to routine analysis of pharmaceutical formulations was conirmed by evaluating CIP and NOR concentrations in fourteen commercial samples by the SIA and HPLC reference procedures, with the results being in good agreement. The excellent precision of the automatic methodology (rsd<1%) as-sociated with the absence of interference from a considerable number of excipients further conirm the developed procedure as an excellent option for implementation in pharmaceutical quality control.
ACKNOWLEDGEMENTS
We would like to thank CAPES for the scholarship of J. L. Ruino and to FAPESP and CNPq foundations (Brazil) for their inancial support.
REFERENCES
1. Patel, S. A.; Patel, M. N.; Patel, M. M.; Indian J. Pharm. Sci. 2006, 68, 665.
2. El Walily, A. F. M.; Razak, O. A.; Belal, S. F.; Bakry, R. S.; J. Pharm. Biom. Anal. 1999, 21, 1069.
3. Samanidou, V. F.; Demetrio, C. E.; Papadoyannis, I. N.; Anal. Bioanal. Chem. 2003, 375, 623.
4. Appelbaum, P. C.; Hunter, P. A.; Int. J. Antimicrob. Ag.2000, 16, 5. 5. Neugebauer, U.; Szeghalmi, A.; Schmitt, M.; Kiefer, W.; Popp, J.;
Hol-zgrabe, U.; Spectrochim. Acta Part A2005, 61, 1505.
6. El Walily, A. F.; Belal, S. F.; Barry, R. S.; J. Pharm. Biomed. Anal. 1996, 14, 561.
7. Nagaralli, B. S.; Seetharamappa, J.; Melwanki, M. B.; J. Pharm. Biomed. Anal. 2002, 29, 859.
8. Mostafa, S.; El-Sadek, M.; Alla, E. A.; J. Pharm. Biomed. Anal. 2002, 27, 133.
9. Gowda, B. G.; Seetharamappa, J.; Anal. Sci. 2003, 19, 461.
10. Rizk, M.; Belal, F.; Ibrahim, F.; Ahmed, S.; Sheribah, Z. A.; J. AOAC Int. 2001, 84, 368.
11. Hopkala, H.; Kowalczuk, D.; Acta Poloniae Pharm. Drug Research 2000, 57, 3.
12. Kassab, N. M.; Singh, A. K.; Hackmam, E. R. M. K.; Santoro,M. I. R. M.; Braz. J. Pharm. Sci.2005, 41, 507.
13. García, M. A.; Solans, C.; Aramayona, J. J.; Rueda, S.; Bregante, M. A.; De Jong, A.; Biomed. Chromatogr. B1999, 13, 350.
14. Barrón, D.; Jiménez-Lozano, E.; Cano, J.; Barbosa, J.; J. Chromatogr., B: Anal. Technol. Biomed. Life Sci.2001, 759, 73.
15. Hernández, M.; Aguilar, C.; Borrull, F.; Calull, M.; J. Chromotogr., B: Anal. Technol. Biomed. Life Sci.2002, 772, 163.
16. Fierens, C.; Hillaert, S.; van den Bossche, W.; J. Pharm. Biomed. Anal. 2000, 22, 763.
17. Zotou, A.; Miltiadou, N.; J. Pharm. Biomed. Anal. 2002, 28, 559. 18. Snitkoff, G. G.; Grabe, D. W.; Holt, R.; Bailie, G. R.; J. Immunoassay
19. Sultan, S. M.; Suliman, F. O.; Analyst1992, 117, 1523.
20. Pascual-Reguera, M. I.; Parras, G. P.; Díaz, A. M.; J. Pharm. Biomed. Anal. 2004, 35, 689.
21. Aly, F. A.; Al-Tamimi, S. A.; Alwarthan, A. A.; Talanta2001, 53, 885. 22. Burkhead, M. S.; Wang, H.; Fallet, M.; Gross, E. M.; Anal. Chim. Acta
2008, 613, 152.
23. Suliman, F. E. 0.; Sultan, S. M.; Talanta1996, 43, 559 24. Ruzicka, J.; Marshall, G. D.; Anal. Chim. Acta1990, 237, 329. 25. Pimenta, A. M.; Montenegro, M. C. B. S. M.; Araújo, A. N.; Calatayud,
J. M.; J. Pharm. Biom. Anal. 2006, 40, 16.
26. The United States Pharmacopoeia, NF 23, US Pharmaceutical Conven-tion, MD, 2005, p. 454.
27. Gotardo, M. A.; Gigante, A. C.; Pezza, L.; Pezza, H. R.; Talanta2004, 64, 361.
28. Zawilla, N. H.; Mohammad, A. A.; Kousy, N. M. E.; Aly, S. M. E. M.; J. Pharm. Biomed. Anal. 2002, 27, 243.
29. El-Sherif, A. A.; Walash, M. I.; El-Tarras, M. F.; Osman, A. O.; Anal. Lett. 1997, 30, 1881.
30. Esteve-Romero, J. S.; Simó-Alfonso, E. F.; Pons, L. M.; Garcia-Alvarez-Coque, M. C.; Ramis-Ramos, G.; Trends Anal.Chem. 1995, 14, 29. 31. Doronin, S. Y.; Chernova, R. K.; Gusakova, N. N.; Russ. J. Gen. Chem.
2005, 75, 261.
32. Rocha, F. R. P.; Nobrega , J. A.; Fatibello-Filho, O.; Green Chem.2001, 3, 206.
33. Cifuentes, A.; Bernal, J. L.; Diez-Masa, J. C.; Anal. Chem. 1997, 69, 4271.
34. Skoog, D. A.; Holler, F. J.; Nieman, T. A.; Principles of Instrumental Analysis, 5th ed., Harcourt Brace Company: Philadelphia, 1998. 35. Miller, J. C.; Miller, J. N.; Statistics for Analytical Chemistry, 2nd ed.,