0103 - 5053 $6.00+0.00
Article
*e-mail: [email protected]
A Chemiluminescence Flow-based Procedure for Determination of Carbaryl in Natural
Waters Exploiting Multicommutation and Enzymatic Reaction
Cherrine K. Pires,a Angel Morales-Rubio,b Miguel de la Guardia,b José L. F. C. Lima,c Elias A. G. Zagattoa andBoaventura F. Reis*,a
a
Centro de Energia Nuclear na Agricultura, Universidade de São Paulo
CP 96, 13400-970 Piracicaba-SP, Brazil
b
Departamento de Química Analítica, Universitat de València, 50 Dr. Moliner St, 46100 Burjassot, València, Spain
c
REQUIMTE, Departamento de Química-Física, Faculdade de Farmácia, Universidade do Porto, Rua Aníbal Cunha 164, 4050-070 Porto, Portugal
Um procedimento empregando detecção quiluminescente para determinação de carbaril em águas naturais utilizando acetilcolinesterase e colina oxidase é descrito. O módulo de análise projetado para implementar o processo de multicomutação controlado por microcomputador foi constituído por cinco válvulas solenóides, duas colunas com enzimas imobilizadas em esferas de vidro e cela de fluxo para detecção de quimiluminescência. Nas melhores condições
experimentais foi obtida faixa linear entre 25 a 700 µg L-1 de carbaril. Amostras de água foram
fortificadas com carbaril e as recuperações variaram entre 95 e 101%. Limite de detecção e
coeficiente de variação foram estimados em 11 µg L-1 (99,7% nível de confiança) e 1,3% (n =
20), respectivamente. Outras características analíticas tais como freqüência de amostragem de 72 determinações por hora, consumo de reagente de 2,1 mg de hexacianoferrato de potássio(III) e 0,069 mg de luminol por determinação, também, foram obtidas.
A chemiluminescence procedure for the determination of carbaryl in natural waters using acetylcholinesterase and choline oxidase is described. The flow system designed to implement multicommutation approach controlled by microcomputer comprised five solenoid valves, two columns with immobilized enzymes on controlled pore glass beads and chemiluminometric
flow cell. In the best experimental conditions a linear response ranging from 25 to 700 µg L-1
carbaryl was obtained. Water samples were spiked with carbaryl in order to access the accuracy and recoveries between 95 and 101% were obtained for a concentration level ranging from 25
to 100 µg L-1 carbaryl. Detection limit and variation coefficient were estimated as 11 µg L-1
(99.7% confidence level) and 1.3% (n = 20), respectively. Other profitable features such as a
sample throughput of 72 determinations per hour, a reagent consumption of 2.1 mg potassium
hexacyano ferrate(III) and 0.069 mg luminol per determination were also achieved.
Keywords: multicommutation, flow analysis, pesticide carbaryl, chemiluminescence,
enzymatic reaction
Introduction
The use of pesticides in agriculture has increased dramatically in the two past decades, thus contributing to the environmental contamination mainly soil and surface waters. The carbamate family of pesticides are among those widely used due to the high activity, low
bioaccumulation and moderate degradation in the environment, nevertheless some formulations present high toxicity. Carbaryl (1-naphthyl methylcarbamate) commonly known as Sevin, is a carbamate pesticide widely used on agriculture practices as a contact insecticide because it is very effective to prevent numerous insects that infest fruits, vegetables, cotton and many other crops.1 The potential biological activities of carbaryl and
investigated2 and the authors pointed out that toxic effects
are caused by the inhibition of the cholinesterase activity. For humans the symptomatic effects caused by carbaryl poisoning are nausea, diarrhoea, bronchoconstriction, blurred vision, excessive salivation, muscle twitching, cyanosis, convulsion, coma and respiratory failure.3
The use of the carbaryl represents a potential risk for the environmental contamination and because of that its presence in surface waters should be controlled. To satisfy this requirement, analytical procedures employing as detection techniques amperometry,4,5 potentiometry,6,7 conductimetry,8
spectrophometry3,9 have been reported. Nowadays, the
methods widely used for pesticide determination are based
on gas chromatography,10 high-performance liquid
chromatography11 and gas chromatography coupled with
mass spectrometry.12,13 These detection techniques require
expensive equipments, and furthermore, laborious sample preparation step prior to analysis is generally required. The long time consumed to carry out the sample preparation could become a drawback when a lot of samples must be analyzed. In this sense, attention should be focused to search for analytical procedures with high sampling throughput. Nevertheless, to attain this objective the sample-processing steps prior to analysis should be simplified. Analytical procedures based on flow injection approach implemented employing enzymatic reaction and spectrophotometric detection can attain this requirement.9
The pesticide concentration in water must be very low and in the Environmental National Agency (CONAMA) administrative rules carbaryl received individual specification, where it was established that the maximum concentration acceptable is 20 µg L-1.17 In this sense, high
sensitivity is a feature that must be provided by the analytical procedure. This requirement could be afforded by analytical procedures based on chemiluminescence.14,15
In this context, an enzymatic method for the determination of pesticides using chemiluminescence detection could be proposed based on the reaction of acetylcholine with acetylcholinesterase (AchE) producing choline and acetic acid. Afterwards choline reacts with choline oxidize delivering hydrogen peroxide.16 The
pesticide inhibits the activity of the acetylcholinesterase, thus causing a decrease of the choline production and, as a consequence, reduction of the hydrogen peroxide generation. The reduction effect presents a directly relationship with pesticide concentration in the sample, thus analytical procedures employing chemiluminescence detection based on this feature have been developed.14,15
Low reagent consumption is another parameter that should be considered because it affects favorably both the cost of analysis and decreases the waste generation.
This requisite could be easily achieved by implementing the analytical procedure in a flow system based on multicommutation process, which afforded ability to handle small volumes of sample and reagent solutions.18
In this paper we intend to develop an automatic flow procedure based on multicommutation19-21 for the
deter-mination of carbaryl in water. The procedure is based on the enzymatic reaction and detecting by chemiluminescence using an inexpensive instrument based on photodiode.
Experimental
Apparatus
The equipment set-up consisted of a home-made chemiluminescence detection unit based in the silicon photodiode (71608, Oriel instruments) coupled to a flow cell (78 µL inner volume) machined in acrylic;22 a 586
microcomputer equipped with a PCL-711S electronic interface card (Advantech Corp); an IPC8 Ismatec peristaltic pump equipped with Tygon pumping tubes; a 12 V regulated power supply for the solenoid valves; a home-made electronic interface to match the voltage and current intensity required to drive the solenoid valves;18
two mini-columns (10 mm length, 5 mm inner diameter) to pack the glass beads with immobilized enzyme; joint devices machined in acrylic; mixing coils and flow lines of polyethylene tubing (0.8 mm i.d.); and accessories. To allow the synchronization of the pumping pulsation with the solenoid valves switching pattern, the roller count output of the peristaltic pump was coupled to the microcomputer through the analog input (A1) of the PCL711s interface card.
Reagents
All chemicals were of analytical reagent grade. Freshly purified water presenting conductivity less than 0.1 µS cm-1 was used throughout.
Carbaryl (purity 99.5%) was obtained from Bayer CropScience. A fresh stock solution of 1.0 mg L-1 of
carbaryl was prepared by dissolving 1.0 mg of the pesticide in 70 mL of acetone and made up to 1000 mL with water. Reference solutions within the range 25 to 700 µg L-1
carbaryl were daily prepared by appropriated dilutions from the stock solution with water.
Acetylcholinesterase (AchE) (EC 3.1.1.7, from electric eel type V-S, 1430 U mg-1) and choline oxidase (EC
1.1.3.17, alcaligenes species, 13.1 U mg-1) were purchased
daily prepared by dissolving the solid in a 1.0 mmol L-1
KH2PO4 buffer solution (pH 7.0).
A 2.0 mmol L-1 luminol solution was prepared by
dissolving 35.4 mg of 5-amino-2,3-dihydro-1,4-phthalazinedione (Sigma) in 100 mL of a 0.2 mol L-1
K2CO3 solution with pH adjusted to 10.5 using a 0.1 mol L-1 HCl solution. This solution was prepared 24 hours
before use and maintained in a freezer at 4 oC.
A 0.1 mol L-1 potassium hexacyanoferrate(III) solution
was daily prepared by dissolving 3.29 g of salt (Merck) in 100 mL of water. Phosphate buffer solutions 0.1 mol L-1
(pH 6.0 and 7.5) and 1.0 mmol L-1 (pH 7.0) were prepared
by dissolving 13.6 g and 0.136 g of KH2PO4 (Merck) in water, respectively. The pH was adjusted with a 0.1 mol L-1 NaOH solution and volumes were made up to 1000
mL with water.
Water samples (volume 1000 mL) were collected from Corumbataí River (São Paulo, Brazil) and stored at 4 oC.
Prior to analysis the samples were left to reach the
laboratory temperature (22 oC) and filtered using
membrane filters with pore size of 0.45 µm.
Enzyme immobilization
The AchE and choline oxidase enzymes were immobilized on aminopropyl glass beads (200-400 mesh, 170 Å pore size) as previously described.23 About 0.2 g of
glass beads were activated by maintaining in a 2.5% (v/v) glutaraldehyde solution for 1 hour under stirring with brief nitrogen deoxygenation every 10 min for the first 30 min. Afterwards, the glass beads were washed with water and with phosphate buffer solution (pH 7.0).
AchE (1 mg, 1430 U) was dissolved in 3.0 mL of 0.1 mol L-1 phosphate buffer solution (pH 6.0). This solution was
added to the activated glass beads and was maintained at 4 °C for 20 hours to complete the immobilization step. The glass beads were washed first with cold phosphate buffer solution and then with cold water to remove the unlinked enzyme. The choline oxidase was immobilized following a similar procedure using a mass of 2.31 mg, 30 U.
Water slurry of the beads with immobilized enzymes was inserted into the column by using a needle-less syringe. When the columns were not in use, they were rinsed with phosphate buffer solution (pH 7.5) to fill dead volume and stored at 4 °C.
Procedure
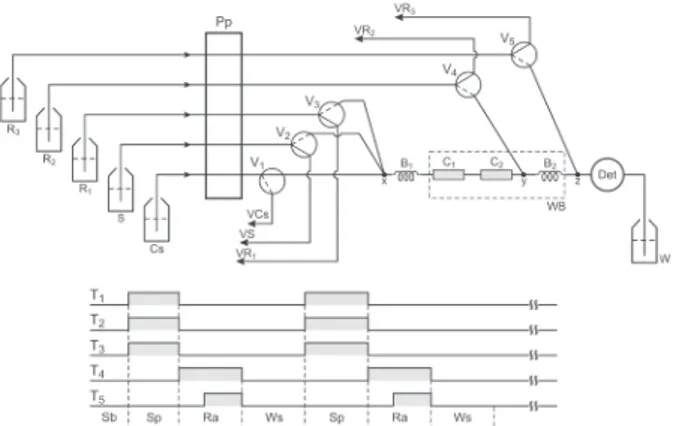
The flow set-up was designed to implement the multicommutation approach and the diagram is depicted in Figure 1. In this configuration, the system is in the
stand by condition assigned as Sb in the valves timing course. Under this condition, all valves are switched off and carrier solution (Cs) flows through valve V1, enzymatic columns (C1, C2) and chemiluminescence detector (Det) towards waste (W). Sample (S), substrate (R1) and reagents (R2, R3) solutions are pumped towards their storing vessels (VS, VR1, VR2, VR3).
When the microcomputer runs the software, it was necessary to wait for the synchronization signal generated by peristaltic pump roller count, which was read through
analog input (A1) of the PCL711S interface card.
Afterwards, the microcomputer sent a sequence of electric pulses through the digital output of the PCL711S interface to switch on/off the valves V1, V2, V3, V4 and V5 as depicted in the valves timing course (Figure 1). In the first step (Sp), valves V1, V2 and V3 are switched on at the same time, thus carrier solution was directed towards its storing vessel (VCs). Under this condition, solutions of sample (S) and acetylcholine (R1) merged into column C1 that was packed with AchE, thus allowing the development of the reaction of the substrate (R1) with the immobilized enzyme producing choline and acetate. This operational sequence was settled considering the reaction conditions pointed out.15 The formed choline reacted with choline
oxidase into the column C2 generating hydrogen peroxide. Carbaryl inhibited the reaction between acetylcholine and acetylcholinesterase, thus causing a decrease in the
Figure 1. Flow diagram of the system. V1, V2, …,V5 = three-way
sole-noid valves; S = sample solution, flow rate 17 µL s-1; C
s = carrier phos-phate buffer solution, flow rate 27 µL s-1; R
1 = acetylcholine chloride solution, flow rate 5 µL s-1; R
2 = luminol solution, flow rate 13 µL s
-1; R
3 = hexacyano ferrate (III) solution, flow rate 13 µL s-1; x, y, z = joint de-vices; C1 and C2 = acetylcholinesterase and choline oxidase columns, respectively; B1 and B2 = coiled reactors, 50 cm long, 0.8 mm i.d.; WB = water bath; Det = chemiluminescence detector; W = waste; VS, VCs, VR1,
generation of choline and hydrogen peroxide. Afterwards, valves V1, V2 and V3 were switched off, solutions S and R1 were pumped towards the storing vessels (VS, VR1) and carrier solution flowed again through the columns. The step (Ra) settled for reagents addition was carried out by switching valves V4 and V5 on as indicated in the valves timing course (Figure 1). Under this condition, luminol and potassium hexacyanoferrate(III) solutions merged with the sample zone at the joint devices y and z, respectively. As indicated by the shadow surface in the valves timing course a delay time (5 s) between the switching valves V4 and V5 was settled in order to save the hexacyanoferrate(III) solution (R3).
The peroxide generated by the enzymatic reaction in the sampling step (Sp) reacted with luminol catalysed by hexacyanoferrate(III) generating electromagnetic radiation with a λmax around 420 nm. In order to assure that light emission occurred into the flow cell the catalyzing solution was added to the sample zone (joint z) 10 mm far from of the flow cell input. While the Ra step was carried out the signal generated by the photodiode was read through the analog input of the PCL711S interface. The digital values were stored as ASCII file to permit further treatment. At the same time, a plot of the signal as a time function was displayed in the microcomputer screen to allow its visualization in real time. As showed in the valves timing course, the next analytical run should begin after the washing step (Ws).
Flow rates of the carrier (Cs), sample (S), acetylcholine chloride solution (R1), luminol (R2) and potassium hexacyanoferrate(III) (R3) solutions were maintained at 27, 17, 5, 13 and 13 µL s-1, respectively. Thus, to find the best
condition experiments were carried out using concentrations ranging from 0.05 to 0.4 mol L-1 hexacyanoferrate(III)
solution, 1.5 to 4.5 mmol L-1 luminol solution and 0.5 to
10 mmol L-1 acetylcholine chloride solution. The
experimental variables studied were the volume of the solution aliquots, which were done by changing the time interval to maintain switched the corresponding valve on, the temperature of the water bath (Figure 1) in the 15 to 45
oC range and the pH of the carrier solution that was changed
from 6.0 to 8.0. These experiments were carried out using a set of carbaryl standard solutions with concentration ranging from 25 to 700 µg L-1.
Measurements were based on the chemiluminescence emission caused by the reaction between hydrogen peroxide and luminol. Because pesticide caused a decrease of the hydrogen peroxide generation, the maximum signal was recorded without the insertion of the carbaryl solution. In this sense, the luminescence detector was adjusted prior to begin the analytical run and it was done by simultaneously
switching valves V1, V3 V4 and V5 on. After a time interval of 60 s, enough to obtain a constant measurement, the readout signal was adjusted to 200 mV. This step was carried out everyday prior to begin the work.
After definition of the experimental variables, a set of water samples collected at several points of the Corumbataí River was analyzed. The water samples were spiked with 25, 50, 75 and 100 µg L-1 carbaryl solutions
to allow the accuracy assessment. To verify the system robustness it was ran during four hours every day for one week using a set of pesticide standard solutions maintaining the laboratory temperature at 22 oC.
Results and Discussion
In the next section will be commented the assays carried out involving parameters, such as, sample and reagent volumes, reagent concentration, pH of the carrier solution, reaction coil length and temperature of the water bath, which were selected in order to find the best conditions for maximum light emission and better signal reproducibility.
Effect of sample and reagent volumes
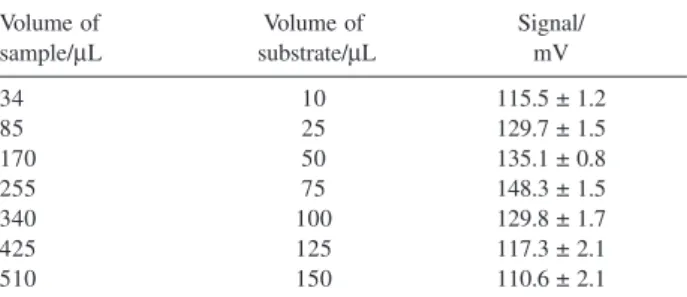
The effects of sample (S) and substrate solution (R1) volumes on the analytical signal were investigated by varying the time intervals to switch on valves V2 and V3 (Sp step, Figure 1) from 2.0 to 30 s. Under this condition, the volume of sample solution that flowed through the enzymatic columns was varied from 34 to 510 µL, while the volume of substrate solution was changed from 10 to 150 µL. From data of Table 1 one can deduce that the ratio between solutions aliquot was maintained at 3.4. The measurements displayed in this Table show that the maximum signal was recorded when the volumes of the aliquots were 255 and 75 µL for
Table 1. Effect of the sample and substrate volumes on the luminescence
signal. Standard solution concentration = 200 µg L-1 carbaryl, flow rate 17
µL s-1; luminol solution concentration = 2.0 mmol L-1, flow rate 13 µL s-1; potassium hexacyano ferrate(III) solution concentration = 0.1 mol L-1, flow rate 13 µL s-1; acetylcholine chloride solution, concentration = 8 mmol L-1; flow rate =5 µL s-1; temperature = 22 °C. Results average of 3 consecutive reference solution processing
Volume of Volume of Signal/
sample/µL substrate/µL mV
34 10 115.5 ± 1.2
85 25 129.7 ± 1.5
170 50 135.1 ± 0.8
255 75 148.3 ± 1.5
340 100 129.8 ± 1.7
425 125 117.3 ± 2.1
sample and substrate solutions, respectively. These volumes were selected for the further experiments.
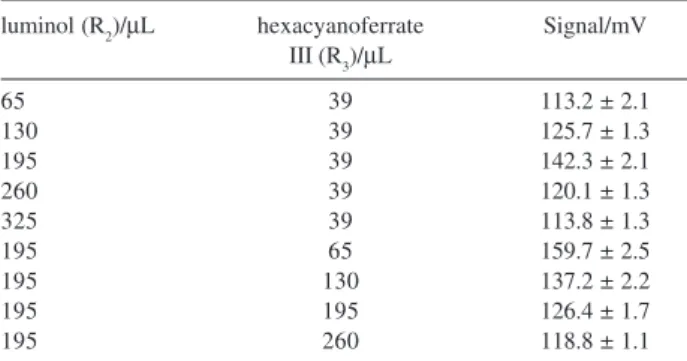
The addition of the luminol (R2) and hexacyanoferrate(III) (R3) solution to sample zone was controlled by varying the time intervals to switch on valves V4 and V5 from 5 to 25 s and from 3 to 20 s, respectively. Considering that both flow rates were maintained at 13 µL s-1, the volumes of luminol
and hexacyano ferrate(III) solutions varied from 65 to 325
µL and from 39 to 260 µL, respectively. Considering the results showed in Table 2 we could observe that the maximum signal was achieved when the solutions volumes were 195
µL and 65 µL for R2 and R3, respectively.
Effect of reagent concentration
The luminol concentration was changed from 1.5 up to 4.5 mmol L-1 maintaining the concentration of potassium
hexacyanoferrate(III) solution at 0.2 mol L-1. When luminol
concentration was changed between 1.5 and 2.0 mmol L-1
the electrical signal related to light emission delivered inserting blank solution increased from 92 to 110 mV. No significant increase was observed using solutions with concentration higher than 2.0 mmol L-1, thus indicating
that a 2.0 mmol L-1 luminol concentration was enough to
satisfy the stoichiometry of the reaction.
The measurements obtained by varying the potassium hexacyanoferrate(III) concentration from 0.05 to 0.1 mol L-1 increased from 65 to 140 mV. Nevertheless, using
concentration higher than 0.1 mol L-1 a remarkable
decrease was observed. In this sense, the solution 0.1 mol L-1 potassium hexacyanoferrate(III) was selected. This set
of assays was performed using the blank solution and a 2.0 mmol L-1 luminol solution.
To verify the effect of the substrate (acetylcholine) on the signal magnitude, assays were carried out varying its
concentration from 1 to 10 mmol L-1 yielding the results
showed in Figure 2. As we can see the maximum measurement was recorded when substrate concentration was about 5 mmol L-1,therefore this value was chosen to
carring out additional assays.
Effects of pH and temperature
The experiments commented in previous section were done by using a phosphate buffer solution at pH 7.0. Because enzymatic reaction could be affected by the pH and temperature of the reaction medium, experiments were carried out varying these parameters yielding the results showed in Table 3. Considering these data, the carrier solution was maintained at pH 7.0. Better results were obtained when temperature was around 22 °C, which was the temperature usually settled to the laboratory, thus
Table 2. Effectof the reagent volumes on the luminescence signal.
Stan-dard solution concentration = 200 µg L-1 carbaryl, flow rate = 17 mL s-1; luminol solution concentration = 2.0 mmol L-1; 13 µL s-1; potassium hexacyanoferrate(III) solution concentration = 0.1 mol L-1, flow rate = 13 µL s-1; acetylcholine chloride solution concentration = 8 mmol L-1 ; flow rate = 5 µL s-1; temperature = 22 °C. Results average of 3 consecu-tive reference solution processing
luminol (R2)/µL hexacyanoferrate Signal/mV III (R3)/µL
65 39 113.2 ± 2.1
130 39 125.7 ± 1.3
195 39 142.3 ± 2.1
260 39 120.1 ± 1.3
325 39 113.8 ± 1.3
195 65 159.7 ± 2.5
195 130 137.2 ± 2.2
195 195 126.4 ± 1.7
195 260 118.8 ± 1.1
Figure 2. Effects of acetylcholineconcentration on the analytical signal.
Standard solution, concentration = 200 mg L-1 carbaryl, flow rate 17 µL s-1; luminol solution, concentration = 2.0 mmol L-1 (13 µL s-1); potassium hexacyano ferrate(III) solution, concentration = 0.1 mol L-1 (13 µL s-1); carrier phosphate buffer solution, concentration = 0.1 mol L-1 (27 µL s-1); temperature = 22 °C. Results average of 3 consecutive reference solution processing.
0 120 130 140 150 160 170 180 190
Conc. Substracte/(mmol L )-1
mV
2.0 4.0 6.0 8.0 10.0
Table 3. Effect of pH and temperature on the enzymatic activity.
Stan-dard solution concentration = 200 µg L-1 carbaryl, flow rate = 17 µL s-1, luminol solution concentration = 2.0 mmol L-1, flow rate = 13 µL s-1; potassium hexacyano ferrate(III) solution concentration = 0.1 mol L-1, flow rate = 13 µL s-1; acetylcholine chloride solution concentration = 5 mmol L-1, flow rate = 5 µL s-1. Results average of 3 consecutive reference solution processing
pH Temperature/(°C) Signal/mV
6.0 22 112.3 ± 1.8
6.5 22 121.5 ± 1.0
7.0 22 143.3 ± 1.6
7.5 22 136.0 ± 1.3
8.0 22 121.2 ± 0.8
7.0 15 119.8 ± 2.0
7.0 22 143.7 ± 1.3
7.0 30 130.4 ± 1.7
7.0 35 118.1 ± 1.2
permitting to work without the use of water bath to control temperature of the flow system.
Analytical parameters
The overall system performance was ascertained by processing a set of carbaryl standard solutions and water
Figure 3. Signal records of the reference solutions. From a to g
refer-ences solutions with 0, 25, 50, 100, 200, 400 and 700 mg L-1 carbaryl. Luminol solution, concentration = 2.0 mmol L-1, flow rate 13 µL s-1; po-tassium hexacyanoferrate(III) solution, concentration = 0.1 mol L-1 , flow rate 13 µL s-1; acetylcholine chloride solution, concentration = 5 mmol L-1, flow rate 5 µL s-1; carrier phosphate buffer solution concen-tration = 0.1 mol L-1 (27 µL s-1), temperature = 22 °C, replicates = 3.
samples fortified with four concentration levels of carbaryl. The records of Figure 3 show that the precision of the measurements was very good. No significant baseline drift occurred, thus indicating that the system was very stable. This figure shows that the time elapsed to carry out 18 determinations was 15 min, therefore a sampling throughput of 72 determinations per hour could be easily attained. For analyte concentrations ranging from 25 up to 700 µg L-1 carbaryl a linear response (R = 0.995,
n = 7) characterized by the equation, Signal (mV) = (0.879 ± 0.011) - (24.242 ± 1.21) × ( × = µg L-1 carbaryl) was
achieved.
The applicability of the proposed procedure was ascertained by processing a set of natural water samples, which were fortified with different concentrations of carbaryl yielding the results presented in Table 4. Recoveries ranging from 95 to 102% were achieved, thus indicating that the proposed system can be employed to monitor this pesticide in surface waters. Other profitable features, such as, a relative standard deviation of results of 1.3% (n = 20), reagent consumption 0.069 mg luminol
and 2.1 mg potassium hexacyanoferrate(III) per
determination and a detection limit of 11 µg L-1 at the
Table 4. Carbaryl determination in spiked water samples. Standard solution, concentration = 200 µg L-1 carbaryl, flow rate = 17 µL s-1; luminol solution
concentration = 2.0 mmol L-1, flow rate = 13 µL s-1; potassium hexacyanoferrate(III) solution concentration = 0.1 mol L-1, flow rate = 13 µL s-1; acetylcho-line chloride solution, concentration = 5 mmol L-1, flow rate = 5 µL s-1; temperature = 22 °C. Results average of 3 consecutive reference solution processing
Sample Carbaryl/(µg L-1) SpikedCarbaryl/(µg L-1) Carbaryl Found/(µg L-1) Recovery/(%) Average/(%)
1 ND 25 25.5 102
1 ND 25 24.8 99.2
1 ND 25 25.7 102.4 101.2 ± 1.7
2 ND 50 49.6 98.6
2 ND 50 48.2 96.4
2 ND 50 49.4 98.4 97.8 ± 1.2
3 ND 75 73.8 98.4
3 ND 75 73.4 97.9
3 ND 75 75.4 100.5 98.9 ±1.4
4 ND 100 99.2 99.2
4 ND 100 98.4 98.4
4 ND 100 95.1 95.1 97.6 ± 2.2
ND: not detected.
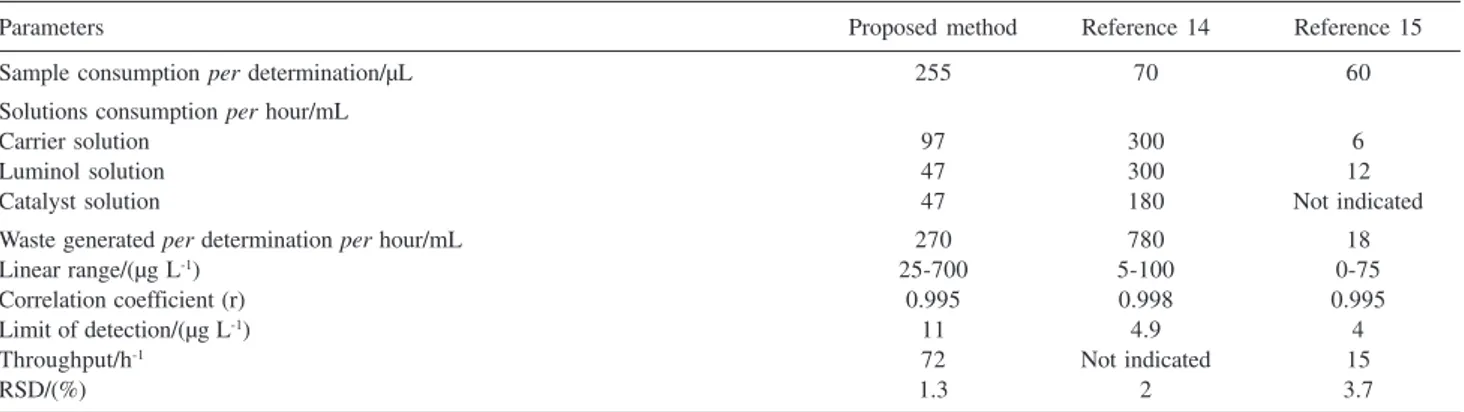
Table 5. Figures of merit of the proposed method and chemiluminescence based procedures14,15
Parameters Proposed method Reference 14 Reference 15
Sample consumption per determination/µL 255 70 60
Solutions consumption per hour/mL
Carrier solution 97 300 6
Luminol solution 47 300 12
Catalyst solution 47 180 Not indicated
Waste generated per determination per hour/mL 270 780 18
Linear range/(µg L-1) 25-700 5-100 0-75
Correlation coefficient (r) 0.995 0.998 0.995
Limit of detection/(µg L-1) 11 4.9 4
Throughput/h-1 72 Not indicated 15
99.7% confidence level were also achieved. Furthermore, maintaining the established operational conditions, the immobilized enzymes could be used up to 60 days allowing 1200 determination.
Aiming to demonstrate the effectiveness of the proposed procedure, the analytical parameters presented in Table 5 were compared with those of reference chemiluminescence methods.14,15 An overall comparison
would be favorable to proposed procedure, presenting as advantage, a wider linear response range and higher throughput.
Conclusions
The flow system is low cost, fast and simple to operate and does not require any sample pre-treatment (except filtration), thus minimizing errors that could be caused by sample manipulation.
Chemiluminescence detection unit presented a good working performance, which could be attained using inexpensive instrumentation. The low reagent consumption and, consequently, waste generation are other additional advantages, which were easily attained exploiting the facilities provided by the multicommutation approach.
Acknowledgments
Authors are gratefully to V. L. Tornisielo from CENA/ USP for his advice on pesticides analysis, Bayer CropScience for providing the carbaryl pesticide; CAPES/
GRICES; CAPES/MECD and FAPESP for the financial
support.
References
1. Mathew, L. ; Reddy, M.L.P. ; Rao, T.P. ; Iyer, C.S.P. ; Damodaran, A. D. ; Analyst1995, 120, 1799.
2. Gosselin, R.E.; Powell, S.R.; Hodge, H.C.; Smith, R.P.; Gleaon, M.V.; Clinical Toxicology of Commercial Products, 4th ed., Williams and Wilkins: Baltimore, Sect. III, 1976.
3. Khalaf, K.D.; Morales-Rubio, A.; de la Guardia, M.; Anal.
Chim. Acta1993,280, 231.
4. Budnikov, H.C.; Evtugyn, G.A.; Electroanalysis1996,8, 817.
5. Martorell, D.; Céspedes, F.; Martinez-Fabregas, E.; Alegret,
S.; Anal. Chim. Acta 1994, 290, 343.
6. Ivanov, A.N.; Evtugyn, G.A.; Gyurcsány, R.E.; Tóth, K.; Budnikov, H.C.; Anal. Chim. Acta 2000,404, 55.
7. Jaffrezic-Renault, N.; Semillou, A.; Martelet, C.; Wan, K.; Chovelon, J.M.; Sens. Actuators B1999, 59,154.
8. Dzydevich, S.V.; Shul‘ga, A.A.; Soldatkin, A.P.; Nyami Hendji, A.M.; Jaffrezic-Renault, N.; Martelet, C.; Electroanalalysis
1994,6, 752.
9. Danet, A.F.; Bucur, B.; Cheregi, M.C.; Badea, M.; Serban, S.;
Anal. Lett. 2003,36, 59.
10. Hernandez-Romero, A.H.; Tovilla-Hernandez, C.; Malo, E.A.; Bello-Mendoza, R.; Mar. Pollut. Bull. 2004, 48, 1130.
11. Kot-Wasik, A.; Dabrowska, D.; Kartanowicz, R.; Namiesnik, J.; Anal. Lett. 2004,37, 545.
12. Bao, M.L.; Pantani, F.; Barbieri, K.; Burrini, D.; Griffini O.;
Int. J. Environ. Anal. Chem. 1996,64, 233.
13. Parilla, P.; Martinez Vidal, J.L.; Chromatographia 1996,43,
265.
14. Huertas-Pérez, J.F.; García-Campaña, A.M.; Gámiz-Gracia, L.; González-Casado, A.; Iruela, M.O.; Anal. Chim. Acta 2004,
524, 161.
15. Roda, A.; Rauch, P.; Ferri, E.; Girotti, S.; Ghini, S.; Carrea, G.; Bovara, R.; Anal. Chim. Acta 1994,294, 35.
16. Karousos, N. G.; Aouabdi, S.; Way, A. S.; Reddy, S. M.; Anal.
Chim. Acta2002, 469,198.
17. Ministério do Meio Ambiente, Conselho Nacional do Meio Ambiente-CONAMA, Resolução No. 357 de 17 de março de 2005 (http://www.mma.gov.br/port/conama/res/res05/ res35705.pdf, in portuguese).
18. Reis, B.F.; Giné, M.F.; Zagatto, E.A.G.; Lima, J.L.F.C.; Lapa, R.A.S.; Anal. Chim. Acta 1994, 293, 129.
19. Kronka, E.A.M.; Paim, A.P.S.; Tumang, C.A.; Latanze, R.; Reis, B.F.; J. Braz. Chem. Soc.2005, 16, 46.
20. Pires, C.K.; Martelli, P.B.; Reis, B.F.; Lima, J.L.F.C.; Saraiva, M.L.M.F.S.; J. Agric. Food Chem. 2003,51, 2457.
21. Rocha, F.R.P.; Martelli, P.B.; Reis, B.F.; J. Braz. Chem. Soc.
2004,15, 38.
22. Stieg, S.; Nieman, T.A.; Anal. Chem. 1978,50, 401.
22. Leon Gonzalez, M.E.; Townshend, A.; Anal. Chim. Acta 1990,
236, 267.
Received: August 5, 2005
Web Release Date: April 27, 2007