Received: November 24, 2010 Accepted: February 6, 2011
Conflict of Interest Statement: The authors state that there are no financial and personal conflicts of interest that could have inappropriately influenced their work.
Copyright: © 2011 Mota et al.; licensee EDIPUCRS. This is an Open Access article distributed under the terms of the Creative Commons Attribution-Noncommercial-No Derivative Works 3.0 Unported License.
Relationship between filler content and
selected mechanical properties of six
microhybrid composites
Relação entre o conteúdo de carga e propriedades mecânicas
de seis resinas compostas microhíbridas
Eduardo Gonçalves Mota a
Adriano Weiss a
Ana Maria Spohr a
Hugo Mitsuo Silva Oshima a
Lígia Maria Nogarett de Carvalho a
a Pontifical Catholic University of Rio Grande do
Sul, Porto Alegre, RS, Brazil
Correspondence:
Eduardo Gonçalves Mota
Pontifical Catholic University of Rio Grande do Sul Av. Ipiranga 6681, Building 6
Porto Alegre, RS – Brasil 90619-900
E-mail: [email protected] Abstract
Purpose: The purpose of this study was to evaluate the influence of filler weight content on selected mechanical properties of six microhybrid composite resins.
Methods: Compressive strength, elastic modulus, Vickers microhardness (VHN), and weight filler content were evaluated in the following dental composites: Admira (AD), Charisma (CH), InTen-S (IN), Tetric Ceram (TC), Point 4 (P4), and Z250 (Z2).
Results: Mean values for compressive strength (MPa) ranged from P4 76.60 to Z2 222.33. The elastic moduli (GPa) ranged from IN 2.56 to Z2 4.59. Microhardness VHN ranged from P4 50.53 to Z2 87.88. Filler weight content (Wt %) ranged from IN 72.51 to TC 79.56. Significant differences were found between the composites (ANOVA/Tukey’s, P<0.05).
Conclusion: Z2 had the highest compressive strength; Z2 and TC showed the highest elastic modulus, VHN and filler weight content. Weight filler content had a strong influence on mechanical properties (0.78<R2<0.98, P<0.01).
Key words: Composite resin; mechanical properties; dental materials
Resumo
Objetivo: O objetivo deste estudo foi avaliar a influência do conteudo de carga, em peso, de seis resinas compostas microhíbrida sobre determinadas propriedades mecânicas.
Metodologia: A resistência à compressão, módulo de elasticidade, microdureza Vickers (VHN) e conteúdo de carga de peso foram avaliados nas seguintes resinas compostas: Admira (AD), Charisma (CH), InTen-S (IN), Tetric Ceram (TC), Point 4 (P4) e Z250 (Z2).
Resultados: Os valores médios de resistência à compressão (MPa) variaram de P4 76,60 a Z2 222,33. Os módulos de elasticidade (GPa) variou de IN 2,56 a Z2 4,59. A microdureza VHN variou de P4 50,53 a Z2 87,88. O conteúdo de carga em peso (Wt%) variou de IN 72,51 a TC 79,56. Foram encontradas diferenças significativas entre as resinas compostas (ANOVA/Tukey’s, P<0,05).
Conclusão: A resina Z2 teve a maior resistência à compressão; Z2 e TC apresentaram maiores módulo de elasticidade, VHN e conteúdo de carga em peso. O conteúdo de carga em peso teve uma forte influência nas propriedades mecânicas avaliadas (0,78<R2<0,98,
P<0,01).
Introduction
The application of composites in the dental clinic allows for conservatory and esthetic dentistry (1). The indications have been extended to direct anterior and posterior illings, indirect inlays, onlays, veneers, crowns and partial ixed bridges.
In 1985, composite illing materials were classiied using the average size of the inorganic iller (2), which became the standard for subsequent studies. Due to the many differences between materials in the same group, other methods of classiication have been suggested based on various mechanical properties (3,4).
Compressive strength, elastic modulus and lexural strength of these materials have been also evaluated (5-7) due to the direct inluence of composition on mechanical behavior (8,9). However, composites in the market are simply classiied by inorganic iller average size, which suggests that resins in the same group have similar mechanical behavior. Therefore, this study tested whether universal microhybrid composites show similar mechanical properties (e.g., compressive strength, elastic modulus and Vickers microhardness) and similar inluence of iller content on mechanical properties. The aims of this study were to compare and evaluate the compressive strength, elastic modulus and Vickers microhardness of six different composites and to determine the inluence of weight filler content on the tested mechanical properties.
Methods
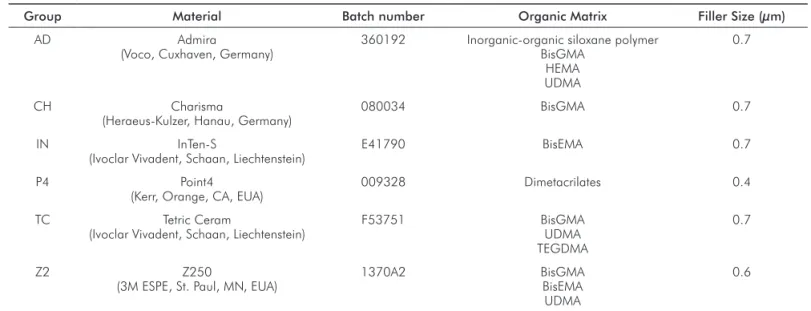
Six different microhybrid composites were used, and their composition and content as well as the shape of inorganic iller and the organic matrix are described in Table 1.
Compressive strength
Twelve specimens for each group were manufactured using a PTFE mold with an inner diameter of 3 mm and a height of 6 mm (5,10,11). Three equal increments were inserted for each specimen and light-cured according to the manufacturers’ instructions using the light-curing unit XL - 1500 (3M ESPE, St. Paul, MN, EUA). Light intensity (450±20 mW/cm2) was checked every ive exposures using
a radiometer (Curing Radiometer Model 100, Demetron Co., Orange, CA, EUA). The specimens were stored in distilled water at 37 °C for 24 h before testing.
Compressive strength was measured using a universal testing machine EMIC DL-2000 (Emic, São José dos Pinhais, PR, Brazil) at a 0.5 mm/min cross-head speed. Records in Newtons (N) were converted to megapascal (MPa) by dividing the maximum failure load by the cross-sectional area. Data were statistically analyzed using an analysis of variance (ANOVA) and Tukey’s test (α=0.05).
Elastic Modulus
Based on the compressive strength data, the elastic modulus was calculated by dividing the compressive strength by deformation (2), which was automatically obtained by Mtest software. Elastic modulus (GPa) data were analyzed using an ANOVA and Tukey’s test (α=0.05).
Vickers Microhardness
Using a PTFE matrix, ive specimens from each group were manufactured with a 4 mm and a 3 mm height. Two composite increments were inserted and light-cured. The specimens were embedded in cylinders of self-cured acrylic resin (Jet, Clássico, São Paulo, SP, Brazil), polished with 100-, 200- and 600-grit carbide silicon paper under water-cooling, and stored in individual containers with distilled water at 37 °C for 24 hours. Microhardness (VHN) was measured two
Table 1. Evaluated materials (based on the information by manufacturers).
Group Material Batch number Organic Matrix Filler Size (µm)
AD Admira
(Voco, Cuxhaven, Germany)
360192 Inorganic-organic siloxane polymer BisGMA
HEMA UDMA
0.7
CH Charisma
(Heraeus-Kulzer, Hanau, Germany)
080034 BisGMA 0.7
IN InTen-S
(Ivoclar Vivadent, Schaan, Liechtenstein)
E41790 BisEMA 0.7
P4 Point4
(Kerr, Orange, CA, EUA)
009328 Dimetacrilates 0.4
TC Tetric Ceram
(Ivoclar Vivadent, Schaan, Liechtenstein)
F53751 BisGMA
UDMA TEGDMA
0.7
Z2 Z250
(3M ESPE, St. Paul, MN, EUA)
1370A2 BisGMA
BisEMA UDMA
times per specimen using a load of 500 g for 15 s (Shimadzu HMV, Shimadzu, Kyoto, Japan). Data were statistically analyzed using ANOVA and Tukey’s test (α=0.05).
Thermogravimetric Analysis
For each group, ten specimens of 20±10 mg of composite were inserted in a platinum container and submitted to a heat rate of 20 °C/min until 700 °C was reached (TGA 2050, TA Instruments, New Castle, DW, EUA). The temperature of organic matrix degradation and iller weight percent (Wt %) were recorded. The amount of inorganic residues was established at the moment the sample’s weight stabilized (12,13). Inorganic content was determined by weighing the mass of the composite specimen before and after the elimination of the organic phase.
Data were compared using ANOVA and Tukey’s test (α=0.05). The linear regression model was applied to verify the degree of inluence of the inorganic phase on the mechanical properties.
Results
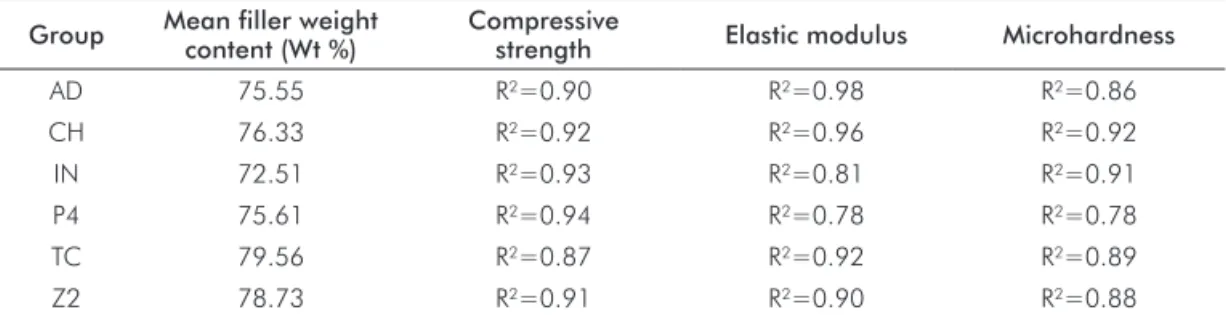
Table 2 displays the means and standard deviations of the experimental groups for compressive strength, elastic modulus, microhardness and iller weight content. Pairwise comparisons showed statistical differences among the tested composites (P<0.05). Z2 had the highest compressive strength. Z2 and TC showed the highest elastic modulus, Vickers microhardness and iller weight content. The determination coeficients (R2) of the inorganic iller content
and mechanical properties are shown in Table 3. Weight iller content strongly inluenced all of the mechanical properties that were tested (0.78<R2<0.98, P<0.01).
Discussion
Microhybrid composite resins are indicated to restore types I, II, III, IV and V. Therefore, it is expected that composites with the same classiication will demonstrate similar mechanical behavior. However, a significant difference in the compressive strength among the composites from 222.33 MPa (Z2) to 76.60 MPa (P4) was observed. These results disagree with other authors (5,8), who found values between 242.3 and 324.7 MPa and between 236.9 and 310.6 MPa (7) even when using materials with similar chemical compositions in the organic matrix (BisGMA, TEGDMA and UDMA) and iller content (66-85 Wt %). Differences in sample size, crosshead speed, and storage medium are possible explanations for these different results.
The amount of iller weight directly increased the com-pressive strength (0.78<R2<0.98). Previous studies (8,14-17)
have also reported differences in mechanical properties due to inorganic iller content. However, this inluence was limited to composites with an inorganic content from 72.51 to 79.56 Wt % because composites with less than 60 Wt % or more than 80 Wt % show low mechanical strength compared to 75 Wt % materials (18).
According to their primary classiication, the resin-based materials can be deined three-dimensionally by iller, organic matrix and bonding agent (2). Consequently, other features, such as diluents (10), degree of conversion (19), the curing method, composition, shape (20), and a medium-sized inorganic phase (11,21), have been described in the literature as possible explanations for these differences. Therefore, multiple variables may inluence the mechanical strength of composite resins.
Group
Compressive strength (MPa)
Elastic modulus (GPa)
Microhardness (VHN)
Filler weight content (Wt%) Mean SD Mean SD Mean SD Mean SD
AD 119.21cd 31.10 3.38b 0.63 61.50c 3.43 75.55b 0.98
CH 169.98b 59.43 3.42b 0.7 66.92c 2.46 76.33b 0.77
IN 150.81bc 34.10 2.56c 0.63 78.36b 6.7 72.51c 1.06
P4 76.60d 22.11 3.07bc 0.53 50.53d 2.27 75.61b 0.56
TC 155.11bc 41.96 4.35a 0.81 80.61ab 8.39 79.56a 0.86
Z2 222.33a 44.78 4.59a 0.37 87.88a 8.95 78.72a 1.1
* Means followed by different letters are statistically different at α=0.05.
Group Mean filler weight content (Wt %)
Compressive
strength Elastic modulus Microhardness
AD 75.55 R2=0.90 R2=0.98 R2=0.86
CH 76.33 R2=0.92 R2=0.96 R2=0.92
IN 72.51 R2=0.93 R2=0.81 R2=0.91
P4 75.61 R2=0.94 R2=0.78 R2=0.78
TC 79.56 R2=0.87 R2=0.92 R2=0.89
Z2 78.73 R2=0.91 R2=0.90 R2=0.88
Table 2. Means* and standard deviation of the experimental groups for compressive strength, elastic modulus, microhardness and filler weight content.
Table 3. Determination coefficient (R2) of the
The Ormocer technology, which is an organically modiied ceramic that was introduced as Admira, promotes a higher bonding of the resinous matrix to an organic-inorganic iller according to the manufacturer’s information. This material showed a compressive strength (119.21 MPa) that was statistically lower than other composites with the same iller average size (0.7 µm) but similar to Point 4 (76.60 MPa). An improvement in iller-matrix bonding does not necessarily result in a higher mechanical strength of high-illed composites (22,23).
The variability of monomers that are incorporated into the resin offers another explanation for the high positive correlation between compressive strength and weight iller content (24). Different amounts of iller content show similar lexural strength, depending on the volume of UEDMA, BisGMA and TEGDMA (25). Resins that contain 70 mol % of UDMA and 30 mol % of TEGDMA without BisGMA show excellent mechanical strength. Composites with a 50 % BisGMA and 50 % TEGDMA without UDMA show high elastic moduli (6). TEGDMA monomer improves the degree of conversion and greatly increases polymerization shrinkage and low. Higher molecular weight monomers, such as UDMA and BisEMA, allow thicker increments and a decrease in shrinkage and degree of conversion.
The average size of the inorganic phase suggests an inluence on strength. Point 4, which has a 0.4-µm iller size, showed a statistically lower compressive strength average of 76.60 MPa. According to the manufacturer, this material behaves similarly to other microhybrid composites. However, composites with a 0.6- to 0.7-µm iller size showed statistically higher averages (Z2, CH, TC and IN). The inluence of iller shape has been described (25). This composite showed the highest compressive strength (222.33 MPa). InTen-S and Tetric Ceram have a mix of spherical and irregular shape illers. These composites showed statistically lower compressive strength (150.81 and 155.11 MPa, respectively) than Z250, but they were statistically equal. Therefore, the composite resin with monomers with high molecular weight (BisEMA), which are associated with spherical shape illers, had higher compressive strength than composites with irregular shape illers and diluent in the matrix.
Elastic modulus was also evaluated; it represents a mechanical behavior that is obtained from the tensile-strain graphic. The elastic modulus is inversely proportional to the capability of a material to deform. Our results ranged from 2.56 to 4.59 GPa, which differs from other studies that have reported values from 8 to 11.1 GPa (6) and 12
to 15 GPa (13). The variety of methods of calculating the elastic modulus explains the disagreement. The elastic modulus can be obtained from three point lexural strength or toughness strength in which tensile distribution differs from the compressive test (6).
The strong positive inluence of iller content on the elastic modulus (0.81<R2<0.98) agrees with the uniform
improvement of the elastic modulus and hardness with iller content. The differences can be explained by the organic phase differences because the elastic modulus decreases with the amount of UEDMA. By varying the concentration of UEDMA, BisGMA and TEGDMA that is associated with the iller, it is possible to obtain composites with the opposite mechanical behavior (6). Composite resins with higher amounts of TEGDMA show a strong degree of conversion and higher mechanical properties (19).
Our results of microhardness ranged from 50.53 VHN (P4) to 87.88 VHN (Z2). Rounded illers allow for a higher amount of inorganic phase (13) and, consequently, the higher hardness that was observed with Z250 (78.73 Wt %, 87.88 VHN). Tetric Ceram (79.56 Wt %, 80.61 VHN) has a mixture of irregular and rounded particles, and it demonstrated numerically a VHN with no statistically signiicant difference. Composites with irregular illers showed intermediate hardness (Charisma, 66.92 VHN, and Admira, 61.50 VHN).
The strong inluence (0.78<R2<0.98) of weight content on microhardness has also been reported previously (24). Hardness increases uniformly with iller amount, and there is a direct correlation with inorganic phase and VHN (12).
Thermogravimetric analysis is a method for the determination of iller content based on the mass weighing of a composite before and after the elimination of the organic phase by heating. Results ranged from 72.51 to 79.56 Wt %, which are in agreement with a previous study that observed an average of 73 (20).
The differences that we observed are related to the maximum iller amount in a composite resin with higher molecular weight monomers, such as BisGMA, UDMA and BisEMA. Tetric Ceram (79.56 Wt %) and Z250 (78.73 Wt %) conirm this hypothesis.
Finally, despite the limitations of an in vitro study, it is possible to observe a large variability in mechanical properties among microhybrid composites. Other mechanical properties, such as degree of conversion, lexural strength, and lexural modulus, should be evaluated to improve the understanding of composite mechanical behavior.
References 1. Lopes GC, Baratieri LN, de Andrada MA, Vieira L C. Dental adhesion: present state of the art and future perspectives. Quintessence Int 2002;33:213-24.
Lutz F, Phillips RW. A classification and evaluation of composite resin systems. J Prosthet 2.
Dent 1985;50:480-8.
Hosoda H, Yamada T, Inokoshi S. SEM and elemental analysis of composite resins. 3.
Lang BR, Jaarda M, Wang RF. Filler particle size and composite resin classification systems. 4.
J Oral Rehab 1998;19:569-84.
Brosh T, Ganor Y, Belov I, Pilo R. Analysis of strength properties of light-cured resin 5.
composites. Dent Mater 1999;15:174-9.
Asmussen E, Peutzfeldt A. Influence of UEDMA, BisGMA and TEGDMA on selected 6.
mechanical properties of experimental resin composites. Dent Mater 1998;14:51-6. Cobb DS, MacGregor KM, Vargas MA, Denehey GE. The physical properties of packable 7.
and conventional posterior resin-based composites: a comparison. J Am Dent Assoc 2000;131:1610-5.
Chung KH, Greener, EH. Correlation between degree of conversion, filler concentration 8.
and mechanical properties of posterior composite resins. J Oral Rehab 1990;17: 487-94.
Say EC, Civelek A, Nobecourt A, Ersoy M, Guleryuz C. Wear and microhardness of different 9.
resin composite materials. Oper Dent 2003;28:628-34.
Krishnan VK, Manjusha K, Yamuna V. Effect of diluent upon the properties of a visible-10.
light-cured dental composite. J Mater Sci Mater Med 1997;8:703-6.
Krishnan VK, Yamuna V. Effect of initiator concentration, exposure time and particle size of 11.
the filler upon the mechanical properties of a light-curing radiopaque dental composite. J Oral Rehab 1998;25:747-51.
Neves AD, Discacciati JAC, Oréfice RL, Jansen WC. Correlation between degree 12.
of conversion, microhardness and inorganic content in composites. Braz Oral Res 2002;16:349-54.
Kim KH, Ong JL, Okuno O. The effect of filler loading and morphology on the mechanical 13.
properties of contemporary composites. J Prosthet Dent 2002;87:642-9.
Raptis CN, Fan PL, Powers JM. Properties of microfilled and visible light-cured composite 14.
resins. J Am Dental Assoc 1979;99:631-3.
Li Y, Swartz ML, Phillips RW, Moore BK, Roberts TA. Effect of filler content and size on 15.
properties of composites. J Dent Res 1985;64:1396-401.
Chung KH. The relationship between composition and properties of posterior resin 16.
composites. J Dent Res 1990;69:852-6.
Willems G, Lamberchts P, Braem M, Celis JP, Vanherle G. A classification of dental 17.
composites according to their morphological and mechanical characteristics. Dent Mater 1992;8:310-9.
Htang A, Ohsawa M, Matsumoto H. Fatigue resistance of composite restorations: effect 18.
of filler content. Dent Mater 1995;11:7-13.
Ferracane JL, Greener EH. The effect of resin formulation on the degree of conversion 19.
and mechanical properties of dental restorative resins. J Biomed Mater Res 1986;20: 121-31.
Kim KH, Okuno O. Microfracture behavior of composite resins containing irregular-shaped 20.
fillers. J Oral Rehab 2002;29:1153-9.
Mitra SB, Wu D, Holmes B. An application of nanotechnology in advanced dental materials. 21.
J Am Dental Assoc 2003;134:1387-90.
Venhoven BA, de Gee AJ, Werener A, Davidson C L. Influence of filler parameters on 22.
the mechanical coherence of dental restorative resin composites. Biomaterials 1996;17: 735-40.
Debnath S, Ranade R, Wunder SL, McCool J, Boberick K, Baran G. Interface effects on 23.
mechanical properties of particle-reinforced composites. Dent Mater 2004;20:677-86. Halvorson RH, Erickson RL, Davidson CL. The effect of filler and silane content on 24.
conversion of resin-based composite. Dent Mater 2003;19:327-33.
Abado LG, dos Santos Cruz CA, Fonseca RG, Vaz LG. The volumetric fraction of inorganic 25.