http://dx.doi.org/10.1590/S1982-21702017000300034
Article
USE OF UAV PLATFORM AS AN AUTONOMOUS TOOL FOR
ESTIMATING EXPANSION ON INVADED AGRICULTURAL LAND
Uso de Plataforma Vant como Ferramenta Autônoma para Estimativa de
Expansão em Áreas de Invasão Agrária
Niarkios Luiz Santos de Salles Graça 1 Edson A. Mitishita 1
José E. Gonçalves 2
1 Universidade Federal do Paraná – UFPR. Centro Politécnico-Geomática, Curitiba-PR:
[email protected] , [email protected]
2 Instituto Tecnológico SIMEPAR. Centro Politécnico da UFPR - Curitiba - PR:[email protected]
Abstract:
For a long time, in many countries, questions involving disputes about land ownership has generated demand for geoinformation and documentation. In most cases, access for researchers is restricted or humanely impossible by eminence of conflicts, even armed. In these cases, researchers use Remote Sensing and Photogrammetry to enable their studies. However, the dynamics of the phenomenon being studied often requires approaches that traditional techniques become unviable or unable to fulfil. This work shows the results of an approach that used a photogrammetric UAV platform to take pictures of an invaded rural area in Brazil and estimate its expansion over two years. From the taken images, mosaics were generated and then classified using Decision Tree to identify tents. Then it was developed a Matlab algorithm, to detect and quantify the tents on the classified Images. It was possible to infer that there was an expansion of 7.3% between the two analyzed dates and probably more than three thousand people occupied the invasion site.
Keywords: UAV mapping; agricultural land invasion; classification.
Resumo:
identificar e quantificar as barracas nas imagens classificadas. Foi possível inferir que houve uma expansão de 7.3% entre as duas épocas analisadas e que possivelmente mais de três mil pessoas ocupavam o local.
Palavras-chave: Mapeamento VANT; invasão agraria; classificação.
1. Introduction
Land conflicts have always been part of the Brazilian country´s history and often motivated by disputes over property and land use (Brumer and Santos, 2006). Over the decades, it can be seen efforts made by both governmental and non-governmental entities to minimize occurrences involving land issues across the country. Undeniably, it can be pointed out the importance of having any geoinformation about the areas where such phenomenon occurs. Teixeira (2015) presented an analysis of land conflicts arising from the illegal occupation on protected areas at the vicinity of a pilot area of colonization in Rondônia (Brazil). In his study, the author pointed to the difficulties encountered due to the lack of information about the land use that could show how conflicts occurred. The lack of documentation, such as long term maps or pictures, reinforces the need for updated geoinformation that several institutions may have to support actions in their competence. Such conclusion is also made by Torre et al (2014). The authors presented a methodology to study land-use conflicts performed by a multidisciplinary team, presenting the survey methods for data collection, as well as the structure of the resulting database.
Traditional ways of obtaining geospatial information for numerous studies, in many sciences, employ classical photogrammetric or remote sensing procedures. However, when the object of study is within a small area of land and it has access restrictions, the use of the classical approaches to get geoinformation may somehow be unreliable. A common case in Brazil for this scenario is the land invasion areas with eminent armed conflicts. For this example, the photogrammetric approach based on Unmanned Aerial Vehicles - UAV's platform is a good option to acquire geoinformation. The use of such platform, in this case, offers major advantages, compared to traditional methods, since it can reduce costs and time for obtaining images.
According to Everaerts (2008) and Eisenbeiß (2009) UAV photogrammetry can be seen as a new measurement tool. The authors provide a review on the use of unmanned aerial platforms and discuss the potential of these platforms in photogrammetric and remote sensing applications. Later, Colomina and Molina (2014) updated the review of the state of the art and the use of these platforms for Photogrammetry and Remote Sensing applications. In this paper, the authors highlighted that the use of UAVs equipped with "off the shelf" instruments (digital cameras and position and orientation sensors) combined with Computer Vision and Geomatics knowledge, allowed semi-automatic generation of horizontal and vertical spatial information
with positional quality at the centimeter level. For this scenario, the Structure From Motion –
aerotriangulation without control points, generates point cloud and orthoimages. Such approach is reviewed and successfully used by Aicardi et al (2016). In order to detect temporal changes taking place on object space, the authors investigated a methodology to co-register UAV images without the use of control points. Machovina et al (2017) tested a fixed-wing UAV system, equipped with sensors, to map banana plantations in Costa Rica. It was concluded that the obtained Normalized Difference Vegetation Index - NDVI, could be successfully used to increase production efficiency. Daponte et al (2017) realized a series of experiments to evaluate the height measurement uncertainties and its sources on objects modeled by UAV Photogrammetry. The authors concluded that the main uncertainty sources for height measurements using aerial photogrammetry are related to the variables base line, camera height and focal distance. Pineux et al 2017 used UAV images to generate surface models (DSM) which were used to locate and quantify erosion and deposition in a context of an agricultural watershed.
Within this context, this paper shows the study to obtain geoinformation of a non-accessible area of forestry plantation. An UAV platform was used to acquire images and infer the human expansion occurred along two years. The used metric is the automatic count of temporary housing (tents), analyzing the expansion occurred between two years. Due to the impossibility to access the area, no ground control points were collected. The study used only the image positions, from the UAV navigation system.
The following sections contain information about the study are and data collection, processing and results. Also some conclusions and recommendations for future work.
2. Study Area and Data Collecting
The study here presented was conducted in a forestry area of the Quedas do Iguaçu County, in the state of Paraná, Brasil. Part of its area was invaded and occupied by social movement MST (Movimento dos Trabalhadores Rurais Sem Terra). This region is taken by a great tension and conflict of interest between the occupants and owners, involving a constant presence of police force. Due to the small size of the studied area and necessity to reduce the cost of image dataset acquisition, an UAV was used. For the sake of security, the aircraft was launched from the safest distance of the target area, about 4.5 km away. No control points were used and only
direct measurements of image’s position, from the platform embedded sensors, were used.
The UAV platform has the Micropilot MP2128g2 navigation system, which allows autonomous
flights, even beyond operator’s sight. This system uses GPS and magnetometers for spatial
Figure 1: Used UAV.
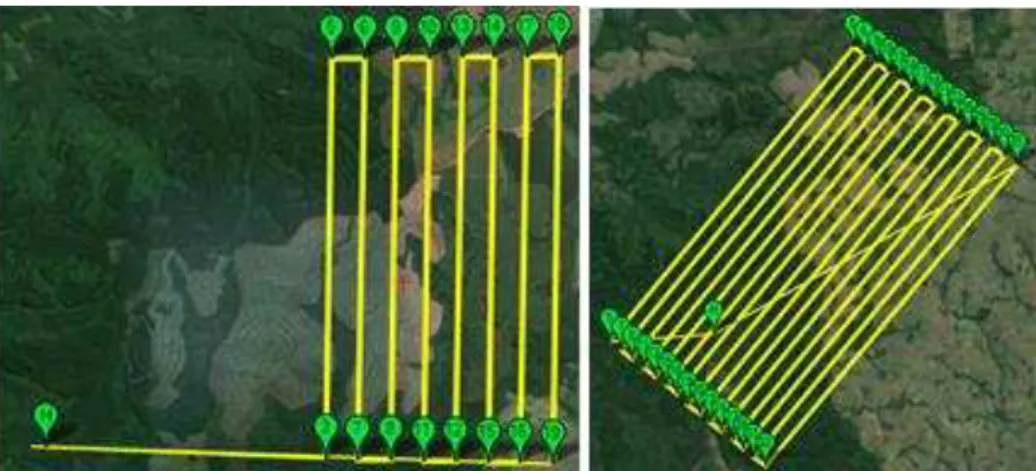
The main interest was to verify the expansion of the invaded area within two years. The datasets were collected in August 2014 and April 2015. In 2014, the images block has eight strips as shown in Figure 2 (left). However in 2015, the images block was expanded to 15 strips (Figure 2, right), due to another study being conducted (environment impacts on this region), which is not part of this paper. Both flights were done at a height of 500m above ground, resulting on a Ground Sample Distance - GSD equal 15 cm. The images forward and side overlaps were approximately 71% and 20% respectively. The Figure 2 also shows the position H (home), where the aircraft was launched in both times. In this position the UAV was manually controlled until reaching a certain altitude and then the command was transferred to the autopilot. The UAV returns to the H position when the mission is completed. Finally, manual operations land the aircraft. Other images blocks characteristics are shown in Table 1. To ensure the best possible sharpness and minimize crabbing effects, the same camera settings were adopted for both years: nominal focal length was 16 mm, shutter speed of 1/1000 and diaphragm aperture (f-stop) 3.5.
Figure 2: Arrangement of flight strips for years 2014 (left) and 2015 (right).
Table 1: Characteristics of the flown blocks.
Year Block dimension (ha)
Total strips length (km)
Number of Images
Number of strips
Total Flight time (hh:mm:ss)
2014 1482 41,32 176 8 0:41:00
3. Processing
The first step in this stage was the selection of images that were used to generate the mosaics. Then the ENVI software was used for mosaic classification. The mosaics are classified as vegetation, soil and tents. After that, an algorithm, developed in MATLAB environment, was used to identify and quantify the elements classified as tents in both periods. The expansion of the invaded area was computed by comparison of quantities detected. The performance of MATLAB algorithm was verified using a ground truth obtained by manual counting of tents. The next subsections discuss each one of these steps.
3.1 Mosaics
In the first step, only images belonging to the invasion site in both periods were selected for the study. After that, a trial version of Swiss software Pix4D Mapper Pro was used to automatically generate the mosaics. According to Cramer (2013), the software has been specially designed for processing image blocks taken from UAV's. It includes all photogrammetric processing chain on a single step. The software used the GPS coordinates of the perspective center, directly measured during the flight, to perform a bundle adjustment, DTM, and mosaic generations. Automatic point cloud is also generated (Haala et al., 2013). Traditional control points were not used. The software does not require any information about inner characteristics of the camera
(Interior Orientation Parameters –IOP). It performs an approximate calibration to compute only
focal distance and coordinates of principal point (Pix4d,2016). According to Colomina and Molina (2014) the Conrady-Brown lens distortion model can be used when the IOP are available. Another detail that should be mentioned is that the software considers as origin for
the coordinates of the principal point, the image`s upper left corner, instead of image’s center.
3.2 Classification
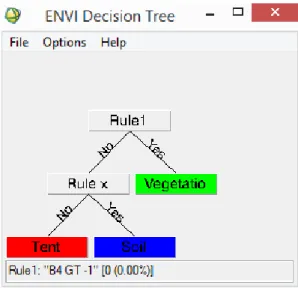
After the generation of mosaics, they were classified using the software Envi v. 4.7. The
Figure 3: Example of a Decision tree.
After initial analysis, it was found that the area being studied presented a complex diversity of spectral responses. There was ground cover variations, different types of materials and colors used on the roofs covers, shade, etc. It was noticed that the sun light angle of incidence on the roofs also contributed to the spectral response of the materials. For this work, the only available data source for the classification was restricted to the visible spectrum, bands R (Red), G (green) and B (blue). Ohta et al (1980) tested over a hundred spectral indexes, for applications in image segmentation and it was concluded that three of them had effective results. To aid the separability of classes in this study, it was necessary to use two of those spectral indexes:
2 −�−�
2 (1)
− (2)
The index shown in Equation 1 favors the separability between vegetation and no vegetation classes while Equation 2 identifies shaded areas (high absorbance). In the present scenario, tents with black canvas roofs, which are very common in Brazil. Thus, the data source for the decision tree was the bands R, G, B and the indexes described in the equations 1 and 2.
As a result of the classification, a thematic classification image was generated, which was used as datasource for a Matlab algorithm, developed exclusively to identify and extract the "tent" class in the thematic image. Due to the presence of vehicles in the scene, the algorithm has a filtering criterion to account only for elements (tents) having an area of 500 pixels or more.
Considering the size of the GSD, this threshold corresponds to an area of approximately 11.3m2
(area equivalent to a small car). Recording vehicles as tents, translates into errors (false positive), affecting the analysis.
3.3 Quality Analysis
As mentioned before, an “in situ” measurement of ground truth was impossible. In order to
coefficient) and to verify the efficiency of the Mathlab algorithm, developed to count the tents. The evaluation of the algorithm was done using the metrics shown by Rutzinger et al (2009). They performed a study of comparative analysis and evaluation of building detection algorithms using the metrics "Completeness" (Equation 3), "Correctness" (Equation 4) and "Quality" "(Equation 5).
=��+ ��� (3)
�� =��+ ��� (4)
�� =��+ �+ ��� (5)
Equation 3 shows to the percentage of entities that were detected in relation to a reference (detection rate or Producer's Accuracy). Equation 4 indicates how well the detected entities correspond to the reference and is closely linked to the false alarm rate (User's Accuracy). Equation 5 provides a composite performance metric that considers the two previous metrics. The value True Positive (TP) is the amount of predicted features belonging to the class tent that in fact were tents. The value True Negative (TN) represents the amount of predicted features not belonging to the tent class that in fact were not tents. The value False Positive (FP) is the amount of predicted features belonging to the class tent, but were not tents. The value False Negative (FN) is the amount of predicted features not belonging to the tent class, but in fact were tents.
4. Results
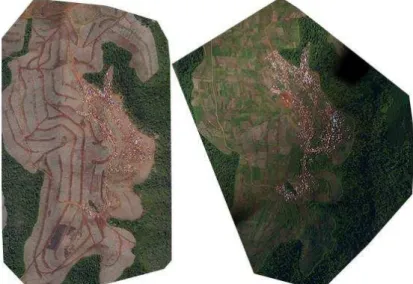
To acquire images with an UAV is relatively easy. However, one should pay attention to weather conditions when covering an area that requires a large number of images in many strips. The images taken in August 2014 had better visual quality than the ones taken in April 2015. In the last time, there were considerable variation in atmospheric conditions, with an increase of wind and change of light condition. The Figure 4 shows the mosaics obtained for both periods. One can see that there is vegetation growth and also some densification of buildings over time.
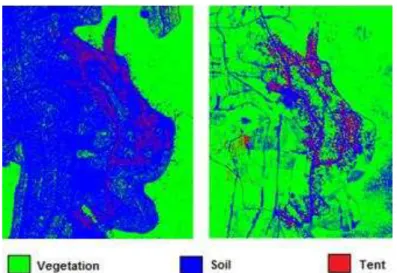
Despite the previously mentioned aspects, the identification of the tents was not compromised and was possible to test the proposed approach. Figure 5 shows an overview of the target area after the thematic classification. For this purpose it was adopted three classes: vegetation, soil and tent. Figure 6(A) and Figure 6(C) shows snippets of the original mosaic and their classification results (Figure 6(B) and Figure 6(D) respectively). Despite the blurred aspect (Figure 6(C)), the classification step and the extraction of the elements (tents) was accomplished.
Figure 5: Classification Results: 2014 (left) and 2015 (right).
Figure 6: Mosaics snippets and their classification in 2014 (top) and 2015 (bottom).
The performed classifications resulted in an overall accuracy equal to 97.5% and a kappa coefficient of 0.94, for the year 2014 and for 2015, 93.11% and 0.69 respectively. The 2015
kappa coefficient reflects a level of misclassification between the class “soil” and “vegetation”.
This misclassification may be explained by the poor visual quality of images, but it did not
affect the “tent” class. Once the classification step was done, the Matlab routine was executed,
using both thematic images from the classification. The routine generates a binary image (black
& white) containing the class “tent”, the numerical value of tents detected and their summarized
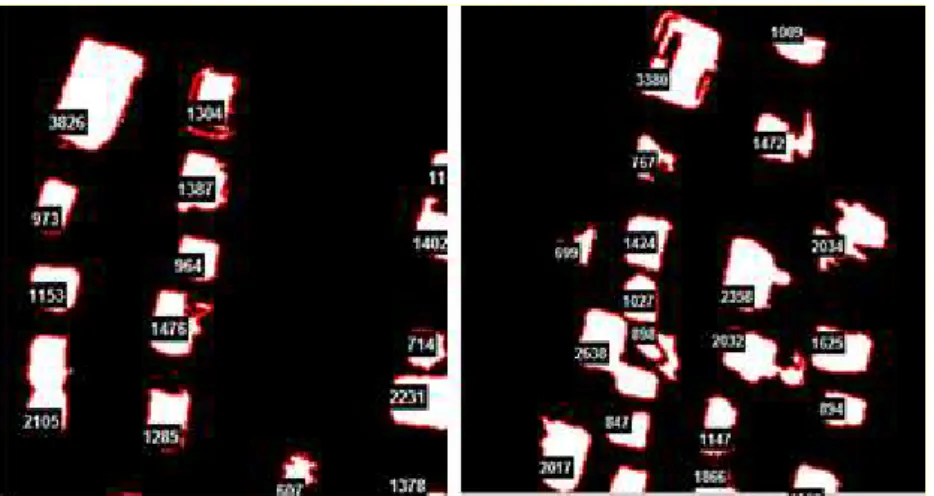
Figure 7: Obtained Results by the Matlab algorithm. 2014 (left) and 2015(right).
To analyze the efficiency of the algorithm, the outputted binary images were compared to the manual vectorization (ground truth). Same samples size were taken distributed throughout both scenes and the metrics described by Equations 3, 4 and 5 were then calculated. Table 2 shows the obtained results:
Table 2: Quality assessment data.
Year 2014 2015
TP 383 347
TN 0 0
FP 43 77
FN 43 88
Ground Truth (number of tents) 1176 1295
Detected tents 1027 1108
Overall Rate 87% 86%
Completeness 90% 80%
Correctness 90% 82%
Quality 82% 68%
Based on Table 2, it can be seen that the Overall Rate (detection rate) values obtained by the suggested approach for years 2014 and 2015 were equivalent to 87% and 86% respectively. If it is presumed that each tent is averagely occupied by three people, it can be guessed that for the first date approximately 3081 people occupied the site. In the second period, 3324 people occupied the site. In other words, there was approximately 7.3% expansion in the number of occupants that could be estimated with the proposed approach. By making the same calculations using the ground truth values, the expansion rate was about 9.2%.
5. Conclusions
This study could help researchers and institutions as a new approach to generate information and improve decision making. It aimed to investigate the performance of an UAV platform to acquire images and estimate the expansion of an inaccessible area of land conflict. Traditional approaches for data acquisition could not be cost effective for the studied scenario. The mentioned platform was used to acquire images that were used to compose mosaics, which were then classified using Decision Tree. The classification results were used in an algorithm
implemented in Matlab, which was responsible to identify and quantify the class: “tents”. The
proposed approach allowed inferring an expansion of 7.3% of the studied phenomenon. Knowing the ground truth a priori, the obtained result turned out to be about 1.9% less than the true value. The use of an UAV platform offered flexibility and agility for image acquisition, turning viable the study of the mentioned phenomenon in the existing conditions. The main advantages of such approach for data acquisition are the relative low cost of the platform, its deploying time and the high level of automation for autonomous photogrammetric flights. Also, depending on the study being conducted, the SFM processing approach may be successfully used. It favors the use of directly measured camera positions, allowing the georeferencing with sufficient quality for many studies. Nevertheless, the use of such platforms has some drawbacks. It should be paid attention to the platform stability during flight. Wind gusts may cause some coverage issues. Also, when flying large areas over an extended period of time, atmospheric conditions may change and negatively affect images visual quality.
Considering the experience of this study and its results, it is intended to work in future with external data sources that may allow a more accurate assessment of the proposed methodology based on an object-oriented classification approach. Also, a dedicated investigation concerning the influence of camera configurations on the stability of its inner orientation parameters for different mapping products deserves to be conducted in order to identify potential impacts.
ACKNOWLEDGEMENT
The authors would like to thank the Instituto Tecnológico Simepar for lending the aircraft. The authors also thanks to CAPES for financially helping - Process 40001016002P6.
REFERENCES
Aicardi, I. et al., 2016. Co-registration of multitemporal UAV image datasets for monitoring
applications: A new approach. The International Archives of the Photogrammetry, Remote
Sensing and Spatial Information Sciences, 12–19 July.
Brumer, A. & dos Santos, J.V.T., 2006. Estudos Agrários no Brasil: modernização, violência e
lutas sociais (desenvolvimento e limites da sociologia rural no final do século XX). Revista
NERA, 9 (9), pp. 49-72.
Colomina, I. & Molina, P., 2014. Unmanned aerial systems for photogrammetry and remote sensing: A review. ISPRS Journal of Photogrammetry and Remote Sensing, 92, pp.79-97.
Daponte, P. et al., 2017. A height measurement uncertainty model for archaeological surveys by aerial photogrammetry. Measurement, 98, pp.192-98.
Eisenbeiß, H., 2009. UAV Photogrammetry. Zurich: ETH Zurich, Switzerland.
Everaerts, J., 2008. The use of unmanned aerial vehicles (UAVs) for remote sensing and
mapping. The International Archives of the Photogrammetry, Remote Sensing and Spatial
Information Sciences, 37(2008), pp.1187-1192.
Figueiredo, S.M.d.M. & Carvalho, L.M., 2006. Avaliação da exatidão do mapeamento da cobertura da terra em Capixaba, Acre, utilizando classificação por árvore de decisão. CERNE, 12(núm. 1), pp.38-47.
Haala, N., Cramer, M. & Rothermel, , 2013. Quality of 3D point clouds from highly overlapping
UAV imagery. ISPRS-International Archives of the Photogrammetry, Remote Sensing and
Spatial Information Sciences XL-1 W, 2, pp.183-188.
Machovina, B.L., Feeley, K.J. & Machovina, B.J., 2017. UAV remote sensing of spatial variation in banana production. Crop and Pasture Science, 67(12), pp.1281--1287.
Ohta, Y.-I., Kanade, T. & Sakai, T., 1980. Color information for region segmentation. Computer graphics and image processing, 13(3), pp.222-241.
Pineux, et al., 2017. Can DEM time series produced by UAV be used to quantify diffuse erosion in an agricultural watershed? Geomorphology, pp.122-136.
Pix4D, 2016. Pix4D Mapper. [Online] Available at:
https://support.pix4d.com/hc/en-us/articles/202557969#gsc.tab=0 [Accessed 08 October 2016].
Rutzinger, M., Rottensteiner, F. & Pfeifer, N., 2009. A comparison of evaluation techniques for building extraction from airborne laser scanning. IEEE Journal of Selected Topics in Applied Earth Observations and Remote Sensing, 2(1), pp.11-20.
Teixeira,S., 2015. Dinâmicas territoriais em Rondônia: conflitos fundiários entorno do Projeto Integrado de Colonização Sidney Girão (19702004). p.152f. Diss. (Mestrado em História) -Faculdade de Filosofia e Ciências Humanas, Programa de Pós-graduação em História, PUCRS.
Torre, A. et al., 2014. Identifying and measuring land-use and proximity conflicts: methods and identification. SpringerPlus, 3(1), pp.85-111.
Westoby, M. et al., 2012. Structure-from-Motion’photogrammetry: A low-cost, effective tool
for geoscience applications. Geomorphology, 179, pp.300-14.
Recebido em 13 de outubro de 2016.