Revista Brasileira de Meteorologia, v.27, n.1, 1 - 12, 2012
ASSESSING THE RESPONSE OF MAIZE PHENOLOGY UNDER ELEVATED TEMPERATURE
SCENARIOS
NEREU AUGUSTO STRECK
1, STEFANÍA DALMOLIN DA SILVA
2, JOSANA ANDREIA LANGNER
11
Universidade Federal de Santa Maria, Departamento de Fitotecnia (UFSM/CCR), Setor de
Agrometeorologia, Santa Maria, RS
2
UFSM,
Curso de Meteorologia (CCNE), Santa Maria, RS
[email protected], [email protected], [email protected]
Received March 2011 - Accepted August 2011
ABSTRACT
The objective of this study was to simulate the development of maize in elevated temperature scenarios at Santa Maria, RS, Brazil. The developmental cycle of maize was simulated with the Wang and Engel
(WE) model with genotype-dependent coeficients for the cultivar BRS Missões. The developmental cycle was divided into vegetative phase (from emergence to silking), and reproductive phase (from silking to physiological maturity). Twelve sowing dates throughout the year were considered, resulting in emergences on the day 15 of each month all year round. Climate scenarios used were synthetic time series of 100 years of current climate and with increase in mean air temperature of +1, +2, +3, +4, and +5, with symmetric and asymmetric increases in daily minimum and maximum temperatures. As temperature increased, the number of years in which crop was killed by frost decreased, indicating
that if global warming will conirm, the growing season for maize grown in subtropical environment
will be longer by the end of this century. Maize vegetative and reproductive development was delayed or hastened depending upon the emergence time of the year, and if the increase in air temperature is symmetric or asymmetric, indicating complex Genotype x Environment interactions and high vulnerability of maize development to climate change.
Keywords: Development, temperature increase, global warming, climate change, agriculture, IPCC.
RESUMO: RESPOSTA FENOLÓGICA DO MILHO EM CENÁRIOS DE AUMENTO DE
TEMPERATURA
O objetivo deste trabalho foi simular o desenvolvimento da cultura de milho em cenários de aumento de temperatura em Santa Maria, RS, Brasil. O ciclo de desenvolvimento do milho foi simulado com
o modelo de Wang e Engel (WE) com coeicientes dependentes do genótipo, para a cultivar BRS
Missões. O ciclo de desenvolvimento foi dividido em fase vegetativa (da emergência ao espigamento)
e fase reprodutiva (do lorescimento até a maturidade isiológica). Foram consideradas doze datas de
semeadura, resultando a emergência no dia 15 de cada mês durante todo o ano. Os cenários climáticos
utilizados foram séries sintéticas de 100 anos do clima atual e com aumentos na temperatura média do ar de +1, +2, +3, +4 e +5, com aumentos simétricos e assimétricos na temperatura mínina e máxima
diária. Com o aumento da temperatura, diminuiu o número de anos em que a cultura foi morta pela
geada, indicando que, se o aquecimento global se conirmar, o calendário do cultivo do milho será maior até o inal deste século. O desenvolvimento vegetativo e reprodutivo do milho foi retardado ou acelerado dependendo da época de emergência da cultura ao longo do ano, e se o aumento na temperatura do ar é simétrico ou assimétrico, o que indica uma complexa interação Genótipo x Ambiente, bem como, alta vulnerabilidade do desenvolvimento do milho à mudança climática.
1. INTRODUCTION
Maize (Zea mays L.) is a cereal cultivated in many parts of the world and is one of the most important agricultural crop worldwide because of its nutritional qualities and versatility of use, which ranges from human consumption to animal feeding in cattle, swine and poultry ranches. Furthermore, it is widely used in industry for the production of oils, glues and thickeners, and also for producing ethanol. It is one of the world’s oldest crops, with evidence of being native of Mexico, Central America and The United States. Usually its cultivation is mechanized,
beneiting from modern techniques of no tillage system and
harvesting. The largest maize producer is The United States, where 37% of the production is destined for ethanol. Brazil ranks the third larger producer and Paraná State the major Brazilian
producer, followed by São Paulo. World production in 2010
was 816 million tons, and it is estimated that production in 2011 will be is approximately 820 million tons (USDA, 2011). Maize production in Brazil in the 2009/2010 growing season was 56 million tons and in the 2010/2011 growing season it expected 53 million tons (USDA, 2011). In Rio Grande do Sul State, which is the sixth largest producer in the country, maize production in the 2009/2010 growing season was 5.6 million tons grown on 1.1 million hectares (CONAB, 2011).
Crop phenology is an important area in Agricultural Meteorology. Phenology is the study of development, which refers to ontogenetic processes at different levels of organization that a crop goes through during its life cycle, and extends from cell differentiation, organ initiation (organogenesis) and appearance (morphogenesis), to crop senescence (Hodges, 1991; Wilhelm and McMaster, 1995). Characterizing and understanding crop
phenology is crucial for ield crop management practices such
as fertilization, pests control and irrigation scheduling (Streck et al., 2008; Bergamaschi and Matzenauer, 2009).
The developmental cycle of maize is divided into two major phases: vegetative (from emergence to silking) and reproductive (from silking to physiological maturity) phases (Ritchie et al., 1997). During the vegetative phase, leaves appear
and grow, which deine the crop leaf area (LAI) that intercepts
solar radiation and ultimately affects canopy photosynthesis and crop growth. During the reproductive phase, the potential
number and size of kernels is deined at silking and grain illing takes place until physiological maturity, when inal crop yield is deined. Two weeks before and after silking is a critical period in
maize, so that any stress (biotic and abiotic) during this period affects yield drastically (Ritchie et al., 1997; Bergamaschi and Matzenauer, 2009).
There is an increasing consensus in the scientific community that climate is changing. If natural, anthropogenic or both causes are responsible for climate change is still under
debate (Mann et al., 1998, 1999, 2008; IPCC, 2007; Molion, 2009). One of the signals of climate change is the rising of near-surface air temperature most likely due to an increase in atmosphere greenhouse gases, causing increase in global temperature over the continents and over the oceans and a decrease in snow cover (IPCC, 2007). During the 20th century, global mean surface air temperature has increased 0.6 (
, and this rise in temperature during the past century extended to South America, Brazil and Rio Grande do Sul
State (IPCC, 2007; Marengo and Camargo, 2008; Sansígolo
and Kayano, 2010; Streck et al., 2011). A particular feature of global warming is that the increase in surface air temperature has been asymmetric, with greater increase in minimum than in maximum daily temperature in many locations worldwide such as the Philippines (Peng et al., 2004), China (Tao et al., 2006) and in Southern Brazil and Rio Grande do Sul State (Marengo and Camargo, 2008; Sansigolo and Kayano, 2010).
Temperature is a major environmental factor that drives maize phenology (Streck et al., 2008; Bergamaschi and Matzenauer, 2009). In order to fully understand agricultural challenges in the future, it is important to adress not only how crops yield respond to climate change (Kim et al., 2007; Travasso et al., 2009), but also to assess how climate change impacts crops phenology (Tao et al., 2006) and for maize such studies have not been done yet.
The objective of this study was to simulate the development of maize in elevated temperature scenarios at Santa Maria, RS, Brazil, considering symmetric and asymmetric increases in daily minimum and maximum temperatures.
2. MATERIAL AND METHODS
This numerical study was performed for Santa Maria, RS, Brazil (29°43’S, 53°43’W, and 95m altitude), located in the Central Region Rio Grande do Sul State. Normal average monthly air temperature varies from 12.9 to 24.6°C and annual precipitation is 1.686 mm. The cultivar used in this study was BRS Missões, a synthetic maize variety developed by Embrapa Trigo and recommended for cultivation in small farms in Rio Grande do Sul, Santa Caratina and Paraná States (EMBRAPA, 2011).
The developmental cycle of maize (from emergence to physiological maturity) was simulated with the Wang and Engel (WE) model (Wang and Engel, 1998) with genotype- dependent
coeficients for the cultivar BRS Missões given in Streck et al.
(2008). The developmental cycle was divided into vegetative phase, from emergence to silking (EM-SI), and reproductive
phase, from silking to physiological maturity (SI-PM). The irst
Março 2012 Revista Brasileira de Meteorologia 3
the daily development rate values, i.e., DS=Sr. DS is 0 at EM, 1 at SI and 2 at PM (Streck et al., 2008). The general form of the WE model is:
for the vegetative phase (EM–SI), and
for the reproductive phase (SI-PM), where rmax,v and rmax,r are
the maximum development rates (day -1) in the vegetative and reproductive phases, respectively, and f(T) is the temperature response function, which varies from 0 to 1. The f(T) is a version of the beta function:
for and for
for
where Tmin, Topt, and Tmax are the cardinal temperatures for
development (minimum, optimum and maximum, respectively), and T is the air temperature. The f(T) was calculated using daily minimum (TN) and daily maximum (TX) air temperatures, and then averaged to a daily mean f(T). The genotype dependent
coeficients for the cultivar BRS Missões are : rmax,v= 0.0254 day -1, rmax,r= 0.0289 day -1, Tmin = 8°C, Topt= 28°C, and Tmax
= 36°C.
Twelve sowing dates throughout the calendar year were considered, resulting in emergence on the day 15 of each month (15/01, 15/02,..., 15/12). A year round emergence dates were used to have maize plants developing in different temperature conditions throughout the year, including, but not only, during the currently recommended period for sowing maize in this location, which is from 11 August to 20 January (REUNIÂO TÉCNICA ANUAL DO MILHO, 2008).
Climate scenarios used in this study were 100 years of current climate and increases in mean air temperature of +1, +2, +3, +4, and +5, with symmetric and asymmetric increases in minimum and maximum daily temperature, totaling eleven climate scenarios. For the asymmetric elevated temperature scenarios, the increase in daily minimum temperature was 20% greater than for daily maximum temperature (Lago et al., 2008). These climate scenarios are synthetic time series created with the LARS-WG weather generator (Semenov et al., 1998), using a 1969-2003 data base of daily minimum and maximum air temperature measured at a conventional weather station in Santa Maria, RS. These one hundred years daily time series have been previously used and suitable for climate change studies (Streck and Alberto, 2006a, b; Lago et al., 2008).
) (
max, f T
r
r= v
(1)
) (
max, f T
r
r= r
(2)
, 0 ) (T = f
min
T
T< T>Tmax
α α α α 2 min 2 min min
min) ( ) ( ) ] ( )
( 2 [ )
(T T T T T T T T T
f = − opt− − opt−
(3)
max
min T T
T ≤ ≤
(4) )] ( ) ( [ ln ) 2 (
ln Tmax−Tmin Topt−Tmin
=
α
(5)
The WE model was run every year for each of the twelve emergence dates within each of the eleven 100 years climate scenarios starting at crop emergence (DS = 0) and ending at physiological maturity (DS = 2). It was assumed that if TN was lower than or equal to 3ºC during the period from emergence day to DS=1.9, crop was killed by frost based on Heldwein et al. (1988) that below this threshold minimum air temperature over short grass is at least 5°C lower than minimum air temperature inside the meteorological shelter in this location. No crop failure due to high temperature was considered in this study because it was assumed that the maize crop was irrigated (Streck et al., 2008). This assumption was based on reports that canopy temperature of irrigated maize crop is 1-2°C lower than air temperature because of plant transpiration (Gardner et al., 1981) and that TX in the climate change scenarios reached 49.7°C which in an irrigated canopy leads to a canopy temperature lower than the 49-51°C upper lethal temperature for maize (Levitt, 1972). Furthermore, plant damage by heat is much more
dificult to quantify than by freezing as there is no change in
water phase at upper lethal temperature as it occurs with lower lethal temperature when water inside the cells freezes and kills them (Levitt, 1972).
The variables analyzed were the duration (days) of the EM-SI, and SI-PM phases and the entire developmental cycle (EM-PM). Analysis of variance for each of the variables was performed considering a 12x11 factorial experiment (emergence dates X climate scenarios). Means of the duration of the developmental phase were distinguished using the Tukey test at 5% probability (Graner, 1966).
3. RESULTS AND DISCUSSION
When a summer crop like maize is grown in the Southern Hemisphere with sowing in the spring, its developmental cycle extends to the upcoming calendar year, and therefore the growing season starts in one year and ends in the next year. Thus, in this study for the emergence dates during the second semester (July to December) there were 99 growing seasons in the 100 years of each climate scenario. For a fair comparison with the
emergence dates in the irst semester (January to June), which
completed PM in the same calendar year, the WE model was
run starting in July of the irst year, so there were 99 growing
seasons in all climate scenarios.
For the other six emergence dates under current climate, maize was less killed by frost and not killed at all for the 15/11 to 15/12 emergence dates (Table 1), which is realistic for this location. As temperature increased in the elevated temperature scenarios, the number of years in which crop was killed by frost decreased for all emergence dates mainly in the scenarios with asymmetric increase in daily temperature (Table 1). These results indicate
that if global warming will conirm, the growing season for
maize in this location will be longer by the end of this century, i.e. anticipated in the Winter and extended into late Summer. A lengthening in the calendar for growing crops in subtropical
and temperature regions may lead to signiicant changes in ield
management practices, such as pests and diseases occurrence
and rotation schedules. These changes may be beneicial on
one hand, allowing more than one maize cropping per year but of concern on the other hand, as many insects and pathogens may survive during winter time, increasing risks and costs with sprayings, which is also further not environmentally friendly.
The analysis of variance indicated signiicant main
effects and interaction between emergence dates and climate scenarios for the variables EM-SI, SI-PM, and EM-PM. Among main effects, mean square was greater for emergence dates, indicating larger effect of crop emergence date on maize development in this study, which is important for addressing what happens if climate changes in different sowing times.
The lower, but highly signiicant (p<0.0001) effect of climate
scenario indicates high sensitivity of maize phenology to global warming. Because the interaction emergence dates X
climate scenarios was signiicant, statistical analysis was split
accordingly, i.e. the effect of climate scenarios was studied within each emergence date (Figures 1, 2 and 3) and the effect of emergence dates was studied within each climate scenario (Figures 4, 5 and 6).
Among climate scenarios, the longest duration of the EM-SI phase was under current climate in the emergence dates from 15/03 to 15/10, i.e. during the coolest period of the year (Figure 1), except for the emergence dates 15/05 and 15/06 (Figures 1E, 1F) when crop was killed in the 99 growing seasons simulated at current climate and the longer duration was under the +1ºC scenario. As temperature increased, the duration of this phase decreased more in the asymmetric increased scenarios than in the symmetric scenarios (Figures 1C to 1J) as a result of the increase in daily temperature above Tmin (8°C). For the
other emergence dates (15/01, 15/02, 15/11, and 15/12), the longest duration was at the highest temperature scenario (+5°C), i.e. there was an increase in the duration of the EM-SI phase as temperature increased (Figures 1A, 1B, 1K, 1L) mainly in the symmetric scenarios. This increase in the length of the vegetative phase when crop emerged during the warmest period of the year is because daily maximum temperature was greater than Topt (28ºC) very often, and supra-optimum temperatures
delay maize development (Equations 4 and 5).
Climate scenarios Emergence
date
Current +1°C +2°C +3°C +4°C +5°C
Sy(1) Asy(2) Sy Asy Sy Asy Sy Asy Sy Asy
15/01 13 9 7 4 1 1 1 0 0 1 0
15/02 91 74 70 54 44 35 23 22 9 16 3
15/03 99 98 98 92 90 82 70 63 44 42 21
15/04 99 98 98 96 96 89 79 75 62 58 42
15/05 99 98 98 96 96 88 78 76 64 59 42
15/06 99 97 97 92 92 85 74 69 60 54 42
15/07 94 87 87 75 72 64 53 49 41 38 28
15/08 65 53 52 41 39 31 23 18 12 11 7
15/09 23 13 13 9 8 7 4 3 3 3 1
15/10 1 0 0 0 0 0 0 0 0 0 0
15/11 0 0 0 0 0 0 0 0 0 0 0
15/12 0 0 0 0 0 0 0 0 0 0 0
Table 1 - Number of years (99 growing seasons) in which maize crop, variety BRS Missões, was killed by frost in different emergence dates and climate scenarios in Santa Maria, RS, Brazil.
Março 2012 Revista Brasileira de Meteorologia 5
Figure 1 - Simulated duration (days) of the emergence to silking (EM-SI) phase of maize, variety BRS Missões, as a function of climate scenarios with symmetric and asymmetric increase in daily minimum and maximum air temperatire for twelve emergence dates (indicated in each panel) in Santa Maria, RS, Brazil. Each column is the mean of one hundred years (ninety nine growing seasons) of simulations and error bars are one standard deviation of the mean. Bars linked by the same letter within each panel are not different accourding to the Tukey test at 5% probability.
For the reproductive phase (SI-PM), the longest duration in the current climate was for emergence dates from 15/01 to 15/08 (from 15/03 to 16/06 crop was killed by frost in the 99 growing seasons under current climate) and decreased under the elevated temperature scenarios, mainly in the asymmetric scenarios (Figures 2A to 2H). For the other emergence dates (15/09 to 15/12), the longest duration of the SI-PM phase was at the highest temperature scenario (+5ºC), mainly in the symmetric scenarios (Figures 2I to 2L).
For the entire developmental cycle (EM-PM), which combines the vegetative (EM-SI) and the reproductive (SI-PM) phases, the longest duration under current climate was simulated
when crop emerged from 15/02 to 15/09 (Figure 3B to 3I) and decreased as temperature increased mainly in the asymmetric scenarios (note that in the emergence dates 15/03, 15/04, 15/05 and 15/06 crop was killed by frost in the 99 growing seasons – Figures 3C, 3D, 3E, 3F). In the other emergence dates (15/10, 15/11, 15/12 and 15/01), the greatest duration was at the highest symmetric temperature scenario, which did not differ from the current climate in the 15/01 emergence date (Figures 3A, 3J, 3K, 3L).
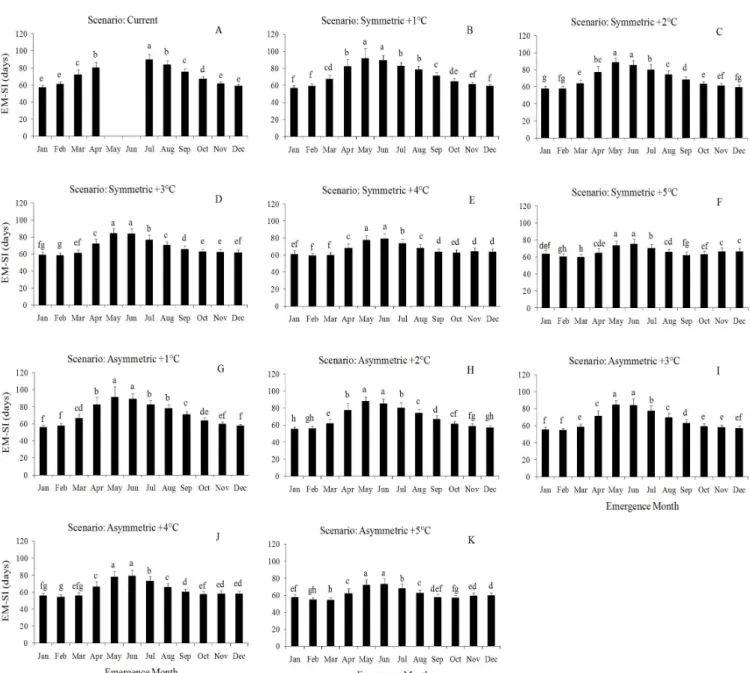
elevated temperature scenarios the longest EM-SI phase was for emergence on 15/05 and 15/06 and the shortest duration was for emergence on 15/12 through 15/02 (Figures 4B to 4K), except under +5°C when the shorter duration was on 15/02 and 15/03 emergence dates (Figures 4F and 4K). For the reproductive phase, under current climate the longest duration was for emergence on 15/02 and the shortest duration was for emergence on 15/10, 15/11, and 15/12 (Figure 5A). Under elevated temperature scenarios, the longest duration of the reproductive phase was for emergence on 15/02, 15/03, and 15/04 (+1°C scenario – Figures 5B, 5G), on 15/03 and 15/04 (+2°C, +3°C, and symmetric +4°C
Figure 2 - Simulated duration (days) of the silking to physiological maturity (SI-PM) phase of maize, variety BRS Missões, as a function of climate scenarios with symmetric and asymmetric increase in daily minimum and maximum air temperatire for twelve emergence dates (indicated in each panel) in Santa Maria, RS, Brazil. Each column is the mean of one hundred years (ninety nine growing seasons) of simulations and error bars are one standard deviation of the mean. Bars linked by the same letter within each panel are not different accourding to the Tukey test at 5% probability.
Março 2012 Revista Brasileira de Meteorologia 7
Figure 3 - Simulated duration (days) of the emergence to physiological maturity (EM-PM) phase of maize, variety BRS Missões, as a function of climate scenarios with symmetric and asymmetric increase in daily minimum and maximum air temperatire for twelve emergence dates (indicated in each panel) in Santa Maria, RS, Brazil. Each column is the mean of one hundred years (ninety nine growing seasons) of simulations and error bars are one standard deviation of the mean. Bars linked by the same letter within each panel are not different accourding to the Tukey test at 5% probability.
Considering the currently recommended period for sowing maize in this location, from 11 August to 20 January (REUNIÃO TÉCNICA ANUAL DO MILHO, 2008), which in this study roughly corresponds to the emergence dates from 15/09 to 15/02, the increase in temperature, as projected by the IPCC (2007) by the end of this century, has the potential to decrease the vegetative phase in early sowing dates in Spring (Figures 1I, 1J and 4) and the reproductive phase in sowing dates early in Spring and late in Summer (Figures 2A, 2B, 2I and 5), whereas in sowing dates in the warmest period of the year (November, December) both vegetative
and reproductive phases may be slightly longer (Figures 1K, 1L, 2K, 2L and 4). From a physiological viewpoint, the implication of these results may be as follow: a shorter vegetative and reproductive phases under warmer nights (asymmetric increase in air temperature) in early sowing dates in Spring decrease the accumulation of photosynthates
in the culm and the grain illing period, respectively, which
Figure 4 - Simulated duration (days) of the emergence to silking (EM-SI) phase of maize, variety BRS Missões, as a function of emergence month (day 15 of each month) in climate scenarios (indicated in each panel) in Santa Maria, RS, Brazil. Each column is the mean of one hundred years (ninety nine growing seasons) of simulations and error bars are one standard deviation of the mean.Symmetric and Asymmetric refer to increases in daily minimum and maximum air temperature.Bars linked by the same letter within each panel are not different accourding to the Tukey test at 5% probability.
respiration rates and decrease in net photosynthesis (Lal et al., 1998; Peng et al., 2004; Streck, 2005). These implications represent a background for screening maize genotypes resistant to high temperatures in breeding programs, and thus to keep competitiveness of maize crop during the warmest period of the year in this location. Other implications of these results include for pests management. Plant pests may increase in climate change scenarios (Ghini et al., 2008) and a lengthening of the vegetative and reproductive phases during the hottest months of the year may allow and lead to more generations
of insects during the developmental cycle of maize such as caterpillars, which increases the costs with sprayings.
Março 2012 Revista Brasileira de Meteorologia 9
Figure 5 - Simulated duration (days) of silking to physiological maturity (SI-PM) phase of maize, variety BRS Missões, as a function of emergence month (day 15 of each month) in climate scenarios (indicated in each panel) in Santa Maria, RS, Brazil. Each column is the mean of one hundred years (ninety nine growing seasons) of simulations and error bars are one standard deviation of the mean. Symmetric and Asymmetric refer to increases in daily minimum and maximum air temperature. Bars linked by the same letter within each panel are not different accourding to the Tukey test at 5% probability.
of global warming projected by the end of this century is still under debate, our results are a reminder of the high vulnerability of maize to climate change as has been indicated by the IPCC, Fourth Assessment Report (IPCC, 2007).
4. CONCLUSIONS
I. The risk of frost for maize grown in a subtropical environment may decrease in warmer climates.
Figure 6 - Simulated duration (days) of emergence to physiological maturity (EM-PM) phase of maize, variety BRS Missões, as a function of emergence month (day 15 of each month) in climate scenarios (indicated in each panel) in Santa Maria, RS, Brazil. Each column is the mean of one hundred years (ninety nine growing seasons) of simulations and error bars are one standard deviation of the mean. Symmetric and Asymmetric refer to increases in daily minimum and maximum air temperature. Bars linked by the same letter within each panel are not different accourding to the Tukey test at 5% probability.
III. The response of maize development to climate change is different if the increase in daily minimum and maximum is symmetric or asymmetric, which is an additional factor in the vulnerability of maize to Global Warming.
5. REFERENCES
BERGAMASCHI, H.; MATZENAUER,R. Milho. In: MONTEIRO, J.E.B.A. (Org.) Agrometeorologia dos Cultivos: o fator meteorológico na produção agrícola.
Brasília, DF: INMET, 2009. p. 239 – 269.
CONAB [Companhia Nacional de Abastecimento]. Disponível em: < http://www.conab.gov.br/conteudos.php?a=1253&t=2 >. Accessed on: 21 March 2011.
EMBRAPA. Milho BRS Missões. Available at: http://www. cnpt.embrapa.br/culturas/milho/cultivares/c-missoes.htm. Accessed on: 24 Mar. 2011
Março 2012 Revista Brasileira de Meteorologia 11
GHINI, R.; HAMADA, E.; PEDRO JÚNIOR, M. J.; MARENGO,J. A.; GONÇALVES, R. R. V. Risc analysis of climate change on coffee nematodes and leaf miner in Brazil. Pesquisa Agropecuária Brasileira, v.43, p.187–194, 2008.
GRANER, E.A. Estatística: Bases para o seu emprego na experimentação agronômica e em outros problemas biológicos. 2ª Edição. São Paulo: Edições melhoramentos, 1966. 184p.
HELDWEIN, A. B.; ESTEFANEL, V.; MANFRON, P. A.; BURIOL, G. A.; SCHNEIDER, F. M. Análise das
temperaturas mínimas do ar registradas em Santa Maria, RS. I- Estimativa das temperaturas mínimas do ar a 5 cm da superfície do solo relvado e do solo desnudo. Revista do Centro de Ciências Rurais, v.18, p.3–14, 1988.
HODGES, T. Predicting crop phenology. Boca Raton, Fla: CRC Press, 1991. 233p.
IPCC [Intergovernmental Panel on Climate Change]. Climate Change 2007: the physical science basis: contribution of Working Group I to the Fourth Assessment Repart of the Intergovernmental Panel on Climate Change. Cambridge University Press: Cambridge, 2007. 996p.
KIM, S. H.; GITZ, D. C.; SICHER, R. C.; BAKER, J. T.; TIMLIN, D. J.; REDDY, V. R. Temperature dependence of growth, development, and photosynthesis in maize under elevated CO2. Environmental and Experimental Botany,
v.61, p. 224 – 236, 2007.
LAGO, I.; STRECK, N. A.; ALBERTO, C. M.; OLIVEIRA, F. B.; PAULA, G. M. Impact of increasing mean air temperature on the development of rice and red rice. Pesquisa Agropecuária Brasileira, v.43, p.1441–1448, 2008.
LAL, M.; SINGH, K. K.; RATHORE, L. S.; SRINIVASAN, G.; SASEENDRAN, S. A. Vulnerability of rice and wheat yields in NW India to future change in climate. Agricultural and Forest Meteorology, v.89, p.101–114, 1998.
LEVITT, J. Responses of plants to environmental stresses. Academic Press: New York, 1972, 697p.
MANN, M. E.; BRADLEY, R. S.; HUGHES, M. K. Global-scale temperature patterns and climate forcing over the past six centuries. Nature, v.392, p.779–787, 1998.
MANN, M. E.; BRADLEY, R. S.; HUGHES, M. K. Northen Hemisphere temperatures during the past millennium: inferences, uncertainties, and limitations. Geophysical Research Letters, v.26, p. 759 – 762, 1999.
MANN, M.E.; ZHANG, Z.H.; HUGHES, M.K.; BRADLEY, R.S.; MILLER, S.K.; RUTHERFORDS, S.; NI, F. Proxy-based reconstructions of hemispheric and global surface temperature variations over the past two millennia. P Natl Acad USA, v.105, p.13252 – 13257, 2008.
MARENGO, J. A.; CAMARGO, C. C. Surface air temperature trends in Southern Brazil for 1960 – 2002. International Journal of Climatology, v.28, p.893–904, 2008.
MOLION, L. C. B. Aquecimento Global: mitos e verdades. In: Congresso Brasileiro de Arroz Irrigado, 6., 2009, Porto Alegre. Estresses e Sustentabilidade: desaios para a lavoura arrozeira. Anais.... Porto Alegre: Sociedade Sul-Brasileira de Arroz Irrigado, p. 526 – 539, 2009.
PENG, S.; HUANG, J.; SHEEHY, J. E.; LAZA, R. C.; VISPERAS, R. M.; ZHONG, X.; CENTENEO, G. S.; KHUSH, G. S.; CASSMAN, K. G. Rice yields decline with higher night temperature from global warming. Proceedings of the National Academy of Sciences of the United States of America, v.101, p. 9971 – 9975, 2004.
REUNIÃO TÉCNICA ANUAL DO MILHO, 53.; REUNIÃO TÉCNICA ANUAL DO SORGO, 36., 2008, Pelotas. Indicações técnicas para o cultivo de milho e sorgo no Rio Grande do Sul: 2008/2009. Embrapa Clima Temperado: Pelotas, 2008. 169p.
RITCHIE, S. W.; HANWAY, J. J.; BENSON, G. O. How a corn plant develops. Ames: Iowa State University of Science and Technology, 1997. 21p. (Special Report, 48).
SANSÍGOLO, C. A.; KAYANO, M. T. Trends of seasonal maximum and minimum temperatures and precipitation in Southern Brazil for the 1913 – 2006 period. Theoretical and Applied Climatology, v.101, p.209–216, 2010.
SEMENOV, M. A.; BROOKS, R. J.; BARROW, E. M.; RICHARDSON, C. W. Comparison of the WGEN and LARS-WG stochastic weather generators for tge diverse climates. Climate Research, v.10, p. 95 – 107, 1998. STRECK, N.A. Climate change and agroecosystems: the
effect of elevated CO2 and temperature on crop growth,
development, and yield. Ciência Rural, v.35, p. 730 – 740, 2005.
STRECK, N. A.; ALBERTO, C. M. Estudo numérico do impacto da mudança climática sobre o rendimento de trigo,
soja e milho. Pesquisa Agropecuária Brasileira, v.41, p. 1351–1359, 2006a.
STRECK, N. A., ALBERTO, C. M. Simulação do impacto da mudança climática sobre a água disponível do solo em
agroecossistemas de trigo, soja e milho em Santa Maria, RS. Ciência Rural, v.36, p. 424 – 433, 2006b.
STRECK, N. A.; LAGO, I.; GABRIEL, L. F.; SAMBORANHA, F. K. Simulating maize phenology as a function of air temperature with a linear and a nonlinear model. Pesquisa Agropecuária Brasileira, v.43, p.449–455, 2008.
STRECK, N. A.; GABRIEL, L. F.; HELDWEIN, A. B.; BURIOL, G. A.; PAULA, G. M. de . Temperatura mínima de relva em Santa Maria, RS: climatologia, variabilidade e
TAO, F.; YOKOZAWA, M.; XU, Y.; HAYASCHI, Y.; ZHANG, Z. Climate changes and trends in phenology and yields of
ield crops in China, 1981 – 2000. Agricultural and Forest Meteorology v.138, p. 82 – 92, 2006.
TRAVASSO, M. I.; MAGRON, G. O.; RODRIGUES, G. R.; SOLMAN, S.; NUÑEZ, M. Climate change impacts on Regional maize yields and possible adaptation measures in Argentina. International Journal of Global Warming, v.1, p.201–213, 2009.
USDA [United States Department Agriculture]. Disponível em
< http://www.fas.usda.gov/psdonline/ >. Accessed on: 21 March 2011.
WANG, E.; ENGEL, T. Simulation of phenological development of wheat crops. Agricultural Systems, v.58, p.1–24, 1998. WILHELM, W. W.; McMASTER, G. S. Importance of