CHARACTERIZATION OF NUTRIENT DEFICIENCY
IN
Hancornia speciosa
Gomes SEEDLINGS BY OMITTING
MICRONUTRIENTS FROM THE NUTRIENT SOLUTION
1LAYARA ALEXANDRE BESSA2, FABIANO GUIMARÃES SILVA3,
MARIALVA ALVARENGA MOREIRA4, JOÃO PAULO RIBEIRO TEODORO5,
FREDERICO ANTÔNIO LOUREIRO SOARES3
ABSTRACT - Hancornia speciosa Gomes (Mangaba tree) is a fruit tree belonging to the Apocynaceae
family and is native to Brazil. The production of seedlings of this species is limited by a lack of technical and nutritional expertise. To address this deficiency, this study aimed to characterize the visual symptoms of micronutrient deficiency and to assess growth and leaf nutrient accumulation in H. speciosa seedlings supplied
with nutrient solutions that lack individual micronutrients. H. speciosa plants were grown in nutrient solution
in a greenhouse according to a randomized block design, with four replicates. The treatments consisted of a group receiving complete nutrient solution and groups treated with a nutrient solution lacking one of the following micronutrients: boron (B), copper (Cu), iron (Fe), manganese (Mn), zinc (Zn), and molybdenum (Mo). The visual symptoms of nutrient deficiency were generally easy to characterize. Dry matter production was affected by the omission of micronutrients, and the treatment lacking Fe most limited the stem length,
stem diameter, root length, and number of leaves in H. speciosa seedlings as well as the dry weight of leaves, the total dry weight, and the relative growth in H. speciosa plants. The micronutrient contents of H. speciosa leaves from plants receiving the complete nutrient solution treatment were, in decreasing order,
Fe>Mn>Cu>Zn>B.
Index terms: Hancornia speciosa Gomes, mineral nutrition, symptoms, growth.
CARACTERIZAÇÃO DE DEFICIÊNCIA NUTRICIONAL DE
MUDAS DE MANGABEIRA
(Hancornia speciosa
Gomes) COM
OMISSÃO DE MICRONUTRIENTES EM SOLUÇÃO NUTRITIVA
RESUMO - A mangabeira (Hancornia speciosa Gomes) é uma frutífera pertencente à família Apocynaceae,
originária do Brasil. A produção de mudas desta espécie em grande escala ainda é limitada pela escassez de conhecimentos técnicos e nutricionais. Para obter maiores esclarecimentos sobre o assunto, este trabalho objetivou caracterizar os sintomas visuais de deficiência de micronutrientes, avaliar o crescimento e o acúmulo de nutrientes foliar de mudas de mangabeira, submetidas a diferentes soluções nutritivas com suspensão de
micronutrientes. Plantas de mangabeira foram cultivadas em solução nutritiva, dentro de casa de vegetação,
no delineamento de blocos casualizados, com quatro repetições. Os tratamentos foram constituídos de solução nutritiva completa e omissão individual de boro, cobre, ferro, manganês, zinco e molibdênio. Os sintomas visuais de deficiências de nutrientes mostraram-se, de maneira geral, facilmente caracterizáveis. A produção de matéria seca foi afetada pela omissão de micronutrientes, e o tratamento que mais limitou o
comprimento do caule, diâmetro do caule, comprimento da raiz, número de folhas de mudas de mangaba e massa seca das folhas, massa seca total e o crescimento relativo da mangabeira, foi a omissão de ferro. Os conteúdos de micronutrientes das plantas do tratamento completo obedeceram à seguinte ordem decrescente
de micronutrientes Fe>Mn>Cu>Zn>B em folhas de mangabeira.
Termos para indexação: Hancornia speciosa Gomes, nutrição mineral, sintomas, crescimento.
1(Trabalho 097-12). Recebido em: 27-02-2012. Aceito para publicação: 28-03-2013.
2Bióloga, mestra em Ciência Agrárias, Instituto Federal Goiano - Câmpus Rio Verde, caixa postal 66, CEP: 75901-970 - Rio Verde –
GO. E-mail: [email protected] (autor para correspondência)
3Professor do Instituto Federal Goiano - Câmpus Rio Verde – GO. E-mails: [email protected]; [email protected] 4Bolsista PNPD CAPES, Instituto Federal Goiano - Câmpus Rio Verde – GO
INTRODUCTION
The Hancornia speciosa Gomes tree
(Mangaba tree), from the Apocynaceae family, is
native to Brazil and has a wide geographical range, occurring in ecosystems such as the Amazon, Atlantic
Forest, and Cerrado (ROSA et al. 2005). This plant
produces edible fruits that can be consumed fresh and used to produce juices, candy, and ice cream
(SOARES et al. 2011).
In Brazil, the production of H. speciosa fruit
in 2010 was approximately 722 tons (IBGE, 2010). With the exception of the state of Minas Gerais, there
are only harvest records for this fruit in the Northeast region, and the states of Sergipe, Bahia, and Paraíba are currently the largest producers, with production totals of 401, 142, and 99 tons, respectively. The state of Minas Gerais produced only one ton of H. speciosa fruit, (IBGE, 2010).
Seedling quality is an essential factor
for homogeneity, rapid development, and early
production, thus ensuring the expansion of this crop in Brazil. To obtain high-quality seedlings, it is necessary to adequately meet their nutrient demands (NATALE et al. 2006). Currently, the management
of H. speciosa seedling nutrition is performed
empirically by the nursery workers, in view of the lack of expertise in the nutritional aspects of this crop, which results from a lack of scientific studies. The exploitation of a native species depends on technical expertise that is generally scarce; therefore, there is a need for research to make their exploitation and market insertion (ROSA et al. 2005).
To expand the production of the fruits,
productive factors, such as the nutrient supply, need
to be controlled because nutrient levels at specific
stages of plant development affect productivity.
(TAIZ; ZEIGER, 2009).
The nutrients perform specific functions in the life of the plant; thus, when plants are subjected
to nutrient-omission treatments, they show visual
symptoms of deficiency when the level received by the plant is below what is considered adequate. In general, each nutrient has specific functions in the
plants, and the different elements are associated
with different symptoms of deficiency or toxicity.
A deficiency in one specific nutrient does not necessarily affect the same metabolic process in all
plant species (TAIZ; ZEIGER, 2009).
The probability of a micronutrient deficiency is lower than that of a macronutrient deficiency. Zn (zinc) and B (boron) are the most commonly
deficient micronutrients in Brazilian soils, and
Fe deficiency may occur due to excessive liming
or due to competitive inhibition by metals such
as Mn (manganese), Cu (copper) and Zn (zinc) (MALAVOLTA, 2006 ).
Leaf analysis of fruit-bearing plants has been used to detect plant responses to several
types of management, thus enabling more efficient
interpretation of the relationships between nutrients in
the plant (SILVA; CARVALHO, 2005). Furthermore, it allows for the identification and correction of deficiencies (SARCINELLI et al. 2004), thus making
better use of fertilizers, leading to savings of this
input and, consequently, achieving better product quality.
Considering that H. speciosa is in the process
of being domesticated, it is necessary to know the best planting techniques and nutrient requirements
for this tree. Growing plants in nutrient solution has been an important tool in advancing plant nutrition research because the composition of the solution is
controlled and the complexity of soil composition
is eliminated. Furthermore, studies with plants in a controlled environment suggest that the effects of different nutrients on plant growth can be more easily
studied than in the field (TAIZ; ZEIGER, 2009).
Therefore, this study aimed to characterize the visual
symptoms of micronutrient deficiency and to evaluate
the growth and the leaf nutrient accumulation of
H. speciosa seedlings exposed to different nutrient
solutions with micronutrient omissions.
MATERIALS AND METHODS
The experiment was conducted in the greenhouse of the Laboratório de Cultura de Tecidos Vegetais at the Instituto Federal Goiano – Campus Rio Verde, from January to June 2011. The upper,
front and side portions of the structure were covered
with a 0.1mm thick transparent polyethylene film.
The H. speciosa plants used were taken from the
Gameleira farm, which is located in the municipality of Montes Claros, in the state of Goiás, at a height of 592 m above sea level and with the geographical
coordinates of 16° 06’ 20’’ S and 51° 17’ 11” W. The seeds were manually extracted, using a sieve to help remove the pulp, and subsequently
washed in running water. They were then planted
in 72 cell expanded polystyrene trays filled with vermiculite and carbonized rice husks at a ratio of
1:1. Thirty days after planting, seedlings with 3-4 full leaves were selected, roots were rinsed with
deionized water and transferred to 8L pots containing Hoagland and Arnon (1950) nutrient solution at 50%
of the original ionic strength, for a period of 30 days.
nutrient-omission treatment. The control group received the complete solution, and other groups were treated
with a nutrient solution lacking one of the following micronutrients: B, Cu, Fe, Mn, Zn, and Mo, for a total of 28 plots. Each experimental plot consisted of an 8-L pot of nutrient solution containing two plants. The treatments were arranged in randomized block
design, with four replicates.
During the experimental period, the plants
were grown under an average irradiance of 200 µmol×m-2s-1. The nutrient solution was kept under
constant aeration using compressed air, and the
pH was adjusted daily to 5.5 ± 0.5 by adding HCl or NaOH as needed. The nutrient solution was
replaced when the initial electrical conductivity value
decreased by 30%.
Every day, the visual symptoms of
nutrient deficiency were assessed, recorded, and
photographed.
Thirty days after transplantation (DAT),
the plant growth was assessed for each treatment
solution by examining the stem length, using a ruler graduated in centimeters (cm) from the root collar
to the terminal bud, and the diameter was measured
using a digital caliper graduated in millimeters; the
number of leaves was obtained by counting, and the length of the longest root was measured using a ruler graduated in cm. These measurements were
taken every 15 days until the plants were harvested, as the deficiencies caused by the nutrient omission
became more pronounced. The cultivation cycle
ended at 120 DAT for the treatments in which B, Zn,
and Mo were omitted and for the treatment with the complete nutrient solution, and the cycle ended at
60 and 105 DAT for the treatments in which Fe and
Cu were omitted, respectively, because the seedlings did not survive past these times. The plants were
harvested and taken to the laboratory, where they
were sectioned into leaves, stem and roots. These organs were weighed and then placed in an oven at
65 °C until they reached a constant mass, to obtain
their dry matter weights.
After drying, the leaves were crushed in a
Wiley mill equipped with a 20-mesh sieve and sent to
the leaf analysis laboratory to determine their B, Cu,
Mn, Zn and Fe contents, following the methodology proposed by Malavolta et al. (1997).
The amounts of each nutrient in the leaves were calculated by multiplying the dry weight of the leaves by the content of each nutrient in the leaves.
The shoot-to-root ratio (S/R) was calculated
by adding the dry matter weights of the stem and leaves and then dividing by the dry matter weight
of the root. The relative growth (RG) corresponds
to one hundred times the ratio of the total dry matter from the nutrient-omission treatments to the total dry matter from the complete nutrient treatment
(BENINCASA, 2003)
The data obtained were subjected to an analysis of variance, and the means were compared
by Tukey’s test at 5% probability. The observed
values for the stem dry matter, root dry matter, leaf dry matter, total dry matter, relative growth, and shoot-to-root ratio needed to be transformed into
the root of x+1 to obtain a normal distribution and
homogeneity of variances.
RESULTS AND DISCUSSION
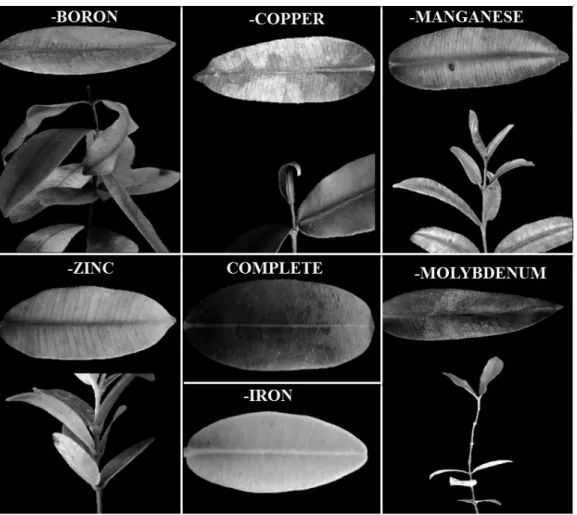
Visual symptoms of nutrient deficiency
The visual symptoms of B deficiency were
initially observed at 40 DAT. The younger leaves showed chlorosis followed by necrosis, which began in the leaves and moved towards the terminal buds,
with a loss of apical dominance (Figure 1). There
was also premature leaf abscission and reduction in
the length of the stem and roots. Neves et al. (2004)
observed that the symptoms of B deficiency in
Spondias tuberosa Arr plants (Umbu) were clearly
identifiable 20 days after starting treatment. The
deficiency was observed in the younger leaves, which showed mild internerval chlorosis that
subsequently expanded from the centers to the edges
of the leaves. Similar symptoms were observed by
Viégas et al. (2004) in camu-camu trees (Myrciaria dubia (H.B.K.) McVaugh) at 50 days after starting
treatment. Young leaves were twisted, atrophied, small, and thick. As the symptoms intensified, the
shoot apical meristem died.
For Cu, the visual symptoms of deficiency began at 35 DAT. Young leaves showed darkening with necrotic spots that began at the apex and
advanced towards the leaf base along the edges
(Figure 1). Wrinkling of the leaves was also observed.
The visual symptoms of Mn deficiency
were initially observed at 27 DAT. In older leaves, internerval chlorosis was observed under a thick
grid of veins that remained green. As the symptoms developed necrotic spots emerged and the leaves
Zn omission resulted in the first visual
symptoms of deficiency at 30 DAT. Initially,
new leaves showed chlorosis. As the deficiency intensified, the plants showed smaller, wrinkled
leaves, a shortening of internodes, and
well-developed roots (Figure 1). Neves et al. (2004)
observed similar symptoms in Spondias tuberosa
Arr plants, which produced small and narrow leaves,
with chlorotic areas between the veins. Zn deficiency
compromises important physiological events and,
consequently, the growth and development of the plant (ZABINI et al. 2007).
The Fe omission treatment was the first
to show deficiency symptoms at 25 DAT. Young
leaves showed chlorosis, which started at the base
of the petiole and progressed towards the apex of the
leaves. As the symptoms evolved, the leaves became
smaller and completely whitened (Figure 1). The
roots showed limited growth and light coloration.
Neves et al. (2004) observed that the symptoms of Fe deficiency in Spondias tuberosa Arr plants started at 30 days, with changes in the color of younger leaves and a purple hue in the stem, sharply contrasting with the yellow remainder of the lamina.
The consequences of an insufficient Fe supply in fruit species, such as peach, pear, citrus, and kiwi, include symptoms like chlorosis, with consequent limitations on productivity, fruit quality, and plant vigor (CESCO et al. 2006).
For Mo, the visual symptoms of deficiency were initially observed at 60 DAT. There was
chlorosis of older leaves evolving to necrosis, with
early leaf abscission (Figure 1). Mo deficiency can
decrease nitrogenase enzyme synthesis, promoting
a reduction in biological nitrogen fixation and, therefore, reducing productivity (MORAES et al. 2008).
Plant growth and Dry matter production
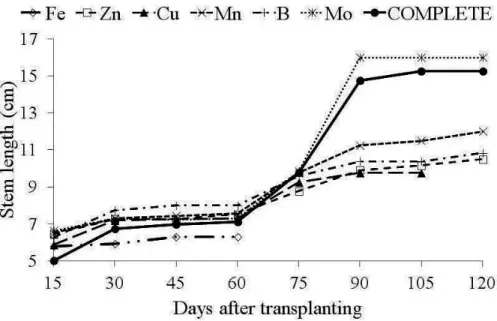
The stem length of plants grown in a
nutrient-lacking solution, with the exception of Mo omission,
was reduced relative to treatment with a complete nutrient solution. Over the production cycle of H. speciosa seedlings, plants grown in a solution lacking
Fe showed the greatest reduction in stem length at
60 days (6.33 cm) relative to plants grown in the complete solution (7.10 cm) (Figure 2).
The first visual symptoms of deficiency in
H. speciosa plants occurred in the Fe-omission
treatment, resulting in the harvest of plants at 60 DAT. The micronutrient deficiencies negatively
affected plant growth, reducing stem length during the production cycle of H. speciosa seedlings, in the
following order: Fe>Cu>Zn>B>Mn>Mo.
The micronutrient omission treatments restricted stem diameter development in H. speciosa
plants when compared to complete nutrient treatment
(Figure 3). Fe omission caused the greatest restriction
in stem diameter development for H. speciosa
seedlings; stem diameters averaged 0.77 mm at 60 days, compared to 1.59 mm for seedlings
receiving the complete treatment. Neves et al.
(2004) observed a similar behavior in Spondias tuberosa Arr seedlings. Micronutrient deficiency
in H. speciosa seedlings negatively affected the development of stem diameter, in the decreasing
order Fe>Mo>Mn>Zn>B>Cu.
With the exception of plants grown under
the Mn-omission treatment, the other treatments restricted the number of H. speciosa leaves produced compared with the complete nutrient solution
(Figure 4). The solution lacking Fe was the most
limiting in terms of the number of leaves, with
plants grown in this solution having 5 leaves at 60 days, compared with 7 leaves for plants grown in the complete solution. There was a 28.57% reduction in
the number of leaves for the Fe-omission treatment compared to the complete solution. Neves et al.
(2004) also observed that Fe was the most limiting
element for leaf number in Spondias tuberosa Arr. Micronutrient deficiency in H.speciosa
seedlings negatively affected the number of l ea v es p r o d u c ed , i n t h e d e c r e a s in g o r d e r
Fe>Mo>B>Cu>Zn>Mn.
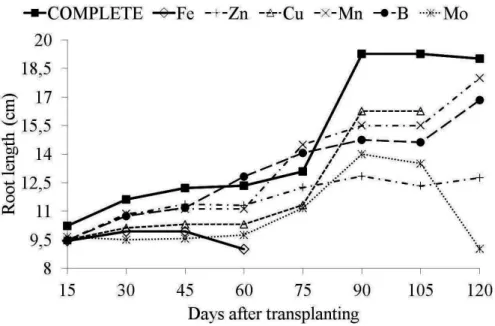
Root length was restricted in H. speciosa
plants under micronutrient omission treatment when compared to plants treated with the complete
nutrient solution (Figure 5). The Fe-deficient solution
caused the greatest restriction in root growth, with
roots averaging 9 cm in length at 60 days compared
with 12.34 cm for plants treated with the complete
nutrient solution. There was a 27.06% reduction
in root length for the Fe-omission treatment when compared with the values shown by the plants treated with the complete solution. Fruit species
that are Fe deficient show developmental, vigor, and productivity limitations (CESCO et al. 2006).
The micronutrient deficiency in H. speciosa
seedlings negatively affected root growth, according
to the following order Fe>Mo>Zn>B>Cu>Mn.
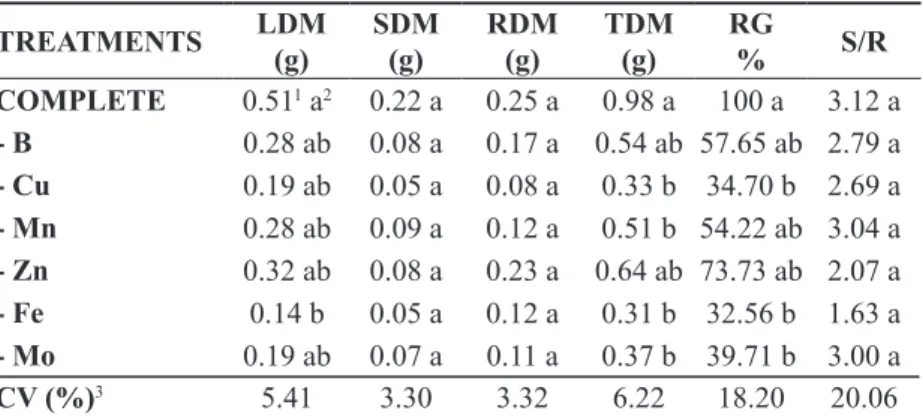
Fe omission in the nutrient solution was the most limiting treatment for the production of leaf dry matter, total dry matter, and relative growth, differing from the complete treatment in all of these
variables. There was a reduction of 72.54%, 68.36%, and 67.44%, respectively, when the Fe-omission
treatment (Table 1). Neves et al. (2004) observed
that Fe omission was the most limiting treatment for the accumulation of dry weight of leaves, total dry
weight, and relative growth, with reductions of 80%, 75%, and 74.93%, respectively, compared with the
complete nutrient treatment for Spondias tuberosa
Arr plants.
Leaf nutrient content
The micronutrient contents of plants under the complete nutrient treatment and those from the nutrient-omission treatments were: B = 2.0 and 1.0 mg plant-1; Cu = 8.0 and 0.04 mg plant-1; Mn = 20.0
and 0.6 mg plant-1; Zn = 7.0 and 3.0 mg plant-1; and
Fe = 41.0 and 2.00 mg plant-1, respectively (Table
2). The relative micronutrient contents of plants
treated with the complete solution followed the order
Fe>Mn>Cu>Zn>B.
All of the micronutrient contents in plants grown under micronutrient-omission treatments were lower than those found for the complete solution
treatment, except for the B (Table 2). A deficiency
in one nutrient may cause an imbalance in other
nutrients and consequently lead to morphological
changes that are translated into the characteristic
symptoms of deficiency of each nutrient (LANGE
et al. 2005).
Although Malavolta et al. (1997) considered competitive inhibition between Cu, Zn, and Fe
common, it was not observed in this study. The ability
of Cu to displace ions, especially Fe and Zn, from exchange sites is the main cause of this inhibition.
FIGURE 2 - Stem length (cm) of Hancornia speciosa Gomes plants, as a function of days after transplanting for the solution with the omission of micronutrients and nutrient solution.
FIGURE 4 - Number of leaves in Hancornia speciosa Gomes plants, as a function of days after transplanting for the solution with the omission of micronutrients and nutrient solution.
FIGURE 5 - Root length (cm) of Hancornia speciosa Gomes plants, as a function of days after transplanting for the solution with the omission of micronutrients and nutrient solution.
CONCLUSIONS
1-The visual symptoms of nutrient deficiencies
were generally easy to characterize.
2- Dry matter production was affected by micronutrient omission, and Fe omission was the treatment that most strongly affected the characteristic of plant.
3- The micronutrient contents of plants treated with the complete nutrient solution accumulated micronutrients in the following order:
Fe>Mn>Cu>Zn>B.
ACKNOWLEDGEMENTS
We thank the Brazilian Federal Agency for
the Support and Evaluation of Graduate Education
(Coordenação de Aperfeiçoamento de Pessoal de
Nível Superior — CAPES) for a post-doctoral scholarship and the Goias Research Foundation
(Fundação de Amparo à Pesquisa do Estado de
TABLE 1- Leaf dry matter (LDM), stem dry matter (SDM), root dry matter (RDM), total dry matter (TDM),
relative growth (RG), and shoot-to-root ratio (S/R) in Hancornia speciosa Gomes seedlings
grown in complete nutrient solution or in solutions lacking individual micronutrients. Rio Verde. Federal Institute of Goias. 2011.
TREATMENTS LDM(g) SDM(g) RDM(g) TDM(g) RG
% S/R
COMPLETE 0.511 a2 0.22 a 0.25 a 0.98 a 100 a 3.12 a
- B 0.28 ab 0.08 a 0.17 a 0.54 ab 57.65 ab 2.79 a
- Cu 0.19 ab 0.05 a 0.08 a 0.33 b 34.70 b 2.69 a
- Mn 0.28 ab 0.09 a 0.12 a 0.51 b 54.22 ab 3.04 a
- Zn 0.32 ab 0.08 a 0.23 a 0.64 ab 73.73 ab 2.07 a
- Fe 0.14 b 0.05 a 0.12 a 0.31 b 32.56 b 1.63 a
- Mo 0.19 ab 0.07 a 0.11 a 0.37 b 39.71 b 3.00 a
CV (%)3 5.41 3.30 3.32 6.22 18.20 20.06
1Means shown with original values; 2Means followed by the same letter in the same column are not significantly different according to
Tukey’s test at 5% probability; 3Coefficient of variation obtained with the data transformed into the root of x+1.
TABLE 2- Leaf content (mg plant-1) in Hancornia speciosa Gomes seedlings grown in complete nutrient
solution or in solutions lacking individual micronutrients. Rio Verde. Federal Institute of
Goias. 2011.
CONTENT (mg plant-1)
TREATMENTS B Cu Mn Zn Fe
COMPLETE 2.01a2 8.00 a 20.0 a 7.0 a 41.0 a - B 1.0 a 0.10 b 0.80 b 1.0 b 14.0 b
- Cu 1.0 a 0.04 b 2.00 b 0.5 b 10.0 b
- Mn 1.0 a 0.04 b 0.60 b 1.0 b 16.0 b
- Zn 1.0 a 2.00 b 10.0 a 3.0 b 24.0 ab
- Fe 0.6 a 0.01 b 0.20 b 0.1 b 2.00 b
CV (%)3 0.04 0.08 0.25 0.08 0.51
1Means shown with original values; 2Means followed by the same letter in the same column are not significantly different according to
Tukey’s test at 5% probability; 3Coefficient of variation obtained with the data transformed into the root of x+1.
Goiás — FAPEG) for financial support. We thank
the owner of Gameleira Farm for donating the plant material used in this study.
REFERENCES
BENINCASA, M. M. P. Análise de crescimento
de plantas: noções básicas. Jaboticabal: FUNEP, 2003. 42 p.
CESCO, S; ROMBOLA, A. D; TAGLIAVINI, M; VARANINI, Z; PINTON, R. Phytosiderophores
released by graminaceous species promote 59
Fe-uptake in citrus. Plant and Soil, Netherlands, v. 287, p.223-233, 2006.
IBGE. Produção extrativa vegetal. Disponível em:
HOAGLAND, D; ARNON, D. I. The water
culture method for growing plants without soil.
Davis: California Agriculture Experimental Station
Publications, 1950. 347 p.
LANGE, A; MARTINES, A. M; SILVA, M. A. C. da; SORREANO, M. C. M; CABRAL, C. P; MALAVOLTA, E. Efeito de deficiência de
micronutrientes no estado nutricional da mamoneira cultivar Iris. Pesquisa Agropecuária Brasileira,
Brasília, v. 40, n. 1, p.61-67, 2005.
MALAVOLTA, E; VITTI, G. C; OLIVEIRA, S.A.
Avaliação do estado nutricional das plantas princípios e aplicações. 2.ed. Piracicaba: Associação
Brasileira para Pesquisa da Potássio e do Fosfato, 1997. 319 p.
MALAVOLTA, E. Manual de nutrição mineral de plantas. São Paulo: Agronômica Ceres, 2006. 638 p.
MORAES, L. M. F; LANA, R. M. Q; MENDES, C; MENDES, E; MONTEIRO, A; ALVES, J. F. Redistribuição de molibdênio aplicado via foliar em diferentes épocas na cultura da soja. Ciência Agrotecnologia, Lavras, v.32, n.5, p.1496-1502, 2008.
NATALE, W; PRADO, R. de. M; ALMEIDA, E. V.de;
BARBOSA, J. C. Adubação nitrogenada e potássica no estado nutricional de mudas de maracujazeiro-amarelo. Acta Scientiarum Agronomy, Maringá,
v.28, n.2, p.187-192, 2006.
NEVES, O. S. C; SÁ, J. S; CARVALHO, J. G. Crescimento e sintomas visuais de deficiência de
micronutriente em umbuzeiros. Revista Brasileira
de Fruticultura, Jaboticabal, v.26, n.2, p.306-309,
2004.
ROSA, M. E. C. da; NAVES, R.V; JÚNIOR, J.
P. de. O. Produção e crescimento de mudas de
mangabeira (Hancornia speciosa gomez) em
diferentes substratos. Pesquisa Agropecuária
Tropical, Goiânia, v.35, n.2, p.65-70, 2005.
SARCINELLI, T. S; RIBEIRO JÚNIOR, E. S; Dias, L. E; Lynch, L. S. Sintomas de deficiência nutricional
em mudas de Acacia holosericea em respostas à omissão de macronutrientes. Árvore, Viçosa-MG,
v.28, n.2, p.173-181, 2004.
SILVA, J. T. A. da; CARVALHO, J. G. de. Avaliação nutricional de bananeira prata-anã (aab), sob
irrigação no semiárido do norte de Minas Gerais, pelo
método DRIS. Ciência e Agrotecnologia, Lavras,
v.29, n.4, p.731-739, 2005.
SOARES, F. P; PAIVA, R; ALVARENGA, A. A. de; NERY, F. C; VARGAS, D. P; SILVA, D. R. G. Taxa de multiplicação e efeito residual de diferentes
fontes de citocinina no cultivo in vitro de Hancornia speciosa gomes. Ciência e Agrotecnologia, Lavras,
v.35, n.1, p.152-157, 2011.
TAIZ, L.; ZEIGER, E. Fisiologia vegetal. 4. ed.
Porto Alegre: Artmed. 2009. 819 p.
VIEGAS, I. J. M; THOMAZ, M. A. A.; SILVA, J. F; CONCEIÇÃO, E. O; NAIFF, A. P. M. Efeitos da
omissão de macronutrientes e Boro no crescimento,
nos sintomas de deficiência nutricionais e na
composição mineral de plantas de camucamuzeiro.
Revista Brasileira de Fruticultura, Jaboticabal,
v.26, n.2, p.315-319, 2004.
ZABINI, A. V; MARTINÉZ, H. E. P; FINGER, F. L; SILVA, C. A. Concentração de micronutrientes e características bioquímicas de progênies de cafeeiro (Coffea arábica L.) eficientes no uso de zinco.
Bioscience Journal, Uberlândia, v.23, n.4,