GLYPHOSATE IN NATURAL WATERS
Desenvolvimento de amostragem para quantificação de glifosato em águas naturais
Danilla Fernanda Tzaskos1, Crislaine Marcovicz1,Nivea Maria Piccolomini Dias1, Neiva Deliberali Rosso2
ABSTRACT
Glyphosate is a systemic, post-emergent, non-selective herbicide widely used in agriculture. The objective of this study was to develop a method for sample preparation, to partially purified natural water samples contaminated with residues of glyphosate, and to quantify them by derivation and spectroscopically. To assess the accuracy of the method, samples of water from an artesian well and from a stream were fortified with known amounts of glyphosate. The concentration of glyphosate was determined using a standard curve concentration range from 4 to 14 mg L-1. From the concentration of glyphosate recovered, in both samples of fortified
water it was found that DOWEX MWA-1 resin and NaCl 0.100 mol L-1 eluent were effective in the purification of the samples. It was
found that the method is reproducible because the results are within the range acceptable for the analysis of residues of pesticides, with a percentage coefficient of variation below the allowed limit. It was found that in the water samples with suspected contamination, the concentration of glyphosate was greater than that permitted by the Ministry of Health.
Index terms: Residues, spectroscopic studies, systemic herbicide.
RESUMO
O glifosato é um herbicida sistêmico, pós-emergente e não seletivo largamente utilizado na agricultura. Neste trabalho, objetivou-se desenvolver um método para preparação de amostragem, purificar parcialmente amostras de água natural contaminadas com resíduos de glifosato e quantificar por derivação e espectroscopicamente. Para avaliar a precisão do método, amostras de água de poço artesiano e de um córrego foram fortificadas com quantidades conhecidas de glifosato. O teor de glifosato foi determinado a partir de uma curva padrão na faixa de concentração de 4 – 14 mg L-1. A partir dos teores de glifosato recuperado, em ambas as amostras de
água fortificada, constatou-se que a resina DOWEX MWA-1 e o eluente NaCl 0,100 mol L-1 foram eficientes na purificação das
amostras. Verificou-se que o método é reprodutível, pois os resultados encontram-se dentro da faixa aceita para análise de resíduos de pesticidas, com coeficiente de variação percentual, abaixo do limite permitido. Constatou-se que nas amostras de água, com suspeita de contaminação, o teor de glifosato foi superior ao estabelecido pelo Ministério da Saúde.
Termos para indexação: Resíduos, estudos espectroscópicos, herbicida sistêmico.
(Received in april 21, 2012 and approved in june 19, 2012)
1Universidade Estadual de Ponta Grossa/UEPG – Ponta Grossa – PR – Brasil
2Universidade Estadual de Ponta Grossa/UEPG – Avenida Carlos Cavalcanti – 4748 – 84030-900 – Ponta Grossa – PR – Brasil – [email protected]
INTRODUCTION
Glyphosate [N-(phosphonomethyl) glycine] is a systemic, post-emergent, non-selective herbicide widely used in agriculture (DANIELE et al. 1997). It features high efficiency control of annual and perennial weeds. Glyphosate is used in many cultures; the number of applications depends on the herbs to be eliminated (AMARANTE; SANTOS, 2002a). Several studies have shown that glyphosate forms stable complexes with metals essential to plant development. It forms complexes with transition metals by means of amino, carboxyl and phosphonate groups (UNDABEYTIA et al., 2002). Saturated solutions with complexes of glyphosate inhibit the development of tomato plants. Mg and Ca complexes promote a greater reduction than Fe(III), Zn(II), Cu(II) and Mn(II) complexes (SUNDARAM; SUNDARAM, 1997).
Sunflowers cultivated in the presence of glyphosate present chlorosis in the leaves and dark coloration in the roots. Glyphosate reduces the uptake and transport of Fe and Mn (SELIM et al., 2006). Ions such as Na+, K+ andMg2+ do
not affect the concentration of glyphosate, however, cations such as Cu2+, Fe2+ and Zn2+ reduce the rate of
SANTOS, 2002b). Glyphosate is a polar and low-observable compound (HOGENDOORN et al., 1999). BrØnstad and Friestad (1976) found residues of glyphosate in natural water by nitrosation and differential pulse polarography. Young, Khan and Marriage, (1977) also found glyphosate by nitrosation in weeds and they detected 10 ng of glyphosate in 2 mg of plants. Glass (1981) found glyphosate of the phosphate to orthophosphate group in water by oxidation with H2O2. The official method (ENVIRONMENTAL PROTECTION AGENCY – EPA, 1990) for glyphosate determination in waters uses high performance liquid chromatography (HPLC), with post column derivatization and fluorescence detection. Residues of glyphosate were found in samples of different cereals, (WIGFIELD; DENEAULT; FILION, 1994) and in different cultures (TSUJI; AKIYAMA; YANO, 1997). Ibáñez et al. (2005) found traces of glyphosate in water samples by liquid chromatography coupled to electron spray mass spectrometry (LC-ESI-MS/MS). The detection limit was 5 ng L-1 and recovery rate was 89-106%. Nagaraja,
Besagarahally and Bhaskara (2006) found traces of glyphosate in samples of water by UV-VIS. The method involves the reaction of glyphosate with ninhydrin in the presence of molybdate and the product has maximum absorption at 570 nm. Kodama et al. (2008) found glyphosate in tea beverages through the formation of the glyphosate-Cu(II) complex. The detection range was 5-1000 mg L-1 and
recovery was from 98 to 100%. Silva et al. (2011) proposed a method for monitoring glyphosate based on reflectance measurements of the colored compound produced from the spot test reaction between glyphosate and p-dimethylamino cinnamaldehyde. The limit of detection for glyphosate was 7.28 µg mL-1. Waiman et al. (2012) quantified glyphosate by
the UV-VIS spectrophotometric method, which comprises the derivatization step plus further measurement of the absorbance at 265 nm. This method is able to quantify glyphosate in the concentration range from 0.084 to 21.8 mg L-1. The objective of this present study was to develop a
method for sample preparation, to partially purify natural water samples contaminated with residues of glyphosate and quantify them by derivation and spectroscopically.
MATERIALS AND METHODS Materials
The solutions were prepared with distilled and deionized water (Millipore) and all reagents were of analytical grade. The resin used for purification of the glyphosate was DOWEX MWA-1 Cl-, 35.00 to 75.00 mesh
(Sigma-Aldrich). A solution of 0.1 mol L-1 NaCl
(Riedel-de-Haen) was used as eluent and a solution 0.10 mol L-1 of
AgNO3 (Merck) was used to control the free chloride. The reagents, glyphosate 95%, KOH (Merck), ninhydrin (Moechst) and sodium molybdate dihydrate (Carlo Erba) were used without prior purification.
Origin and preparation of samples
For testing the recovery of glyphosate, natural water samples were used. These were collected in sealed polypropylene vials from an artesian well and a stream located in the city of Arapoti, Paraná, Brazil. They were then placed under refrigeration at 4° C. The samples were filtered and fortified from the stock solution of glyphosate. The concentrations tested were 5.073 mg L-1, 8.455 mg L-1
and 13.528 mg L-1 in triplicate in a total volume of 5.0 mL.
Water samples with suspected contamination
Water samples with suspected contamination were collected in a stream in the city of Arapoti, Pananá, Brazil. This stream is located between transgenic soy plantations, which utilize the herbicide glyphosate. Approximately two days after spraying, precipitation occurred which lasted about 1 hour and the volume of water was 40 mm. Water samples were collected 18 hours after the rain, during which the stream received runoff stemming from the plantations. These samples were filtered and packaged in sealed polypropylene bottles and kept under refrigeration at 4° C. Purification of samples
The natural water solutions fortified with glyphosate were purified by ion exchange chromatography in a column of glass of 20.0 cm length and 1.0 cm diameter containing a metering valve. This was filled with 8.5 g Dowex MWA-1 free base. The column was first washed with 25.0 mL of 0.1 mol L-1 NaCl to ensure saturation of the chloride
in the resin. After 60 min it was washed with deionized water until the eluate was found to be free of chloride and it was tested with a solution of 0.1 mol L-1 AgNO
3. The pH
was adjusted to 11 with 1.0 mol L-1 KOH. At this pH value
the glyphosate is deprotonated and the interaction with the resin becomes more effective. Then the sample was applied in the column and eluted firstly with 25.0 mL of deionized water to remove impurities and finally eluted with 40 mL of 0.1 mol L-1 NaCl. The final volume of eluate
containing glyphosate was reduced in a water bath at a temperature of 40° C to around 5.0 mL. The column was recovered with 300 mL of deionized water and 50 mL of 0.1 mol L-1 NaCl and the resin remained in contact with this
performed in triplicate. A similar procedure was used to test the anion exchange resin Amberlite IRA-420 and Dowex 1-X8 for the purification of glyphosate. However, the results for these resins were not satisfactory.
Determination of glyphosate
The method used was that which has been proposed by Nagaraja, Besagarahally and Bhaskara (2006) with some modifications. A calibration curve was prepared from a stock solution of 500 mg L-1 glyphosate. Aliquots ranging from 40
to 140 µL were transferred to test tubes and 500 µL of 5% ninhydrin and 500 µL of 5% sodium molybdate were added to each of the tubes. The tubes were sealed and kept in a water bath at a temperature of 85-95° C for 12 minutes. Then the samples were cooled to room temperature and were quantitatively transferred to 5 mL volumetric flasks. The volume was completed with distilled and deionized water. Then the reading was performed by MultiSpec-1501, SHIMADZU spectrophotometer at 570 nm. From this data we constructed a calibration curve with the absorbance as a function of glyphosate concentration in the range from 4 to 14 mg L-1. For the baseline of the instrument 500 µL of
ninhydrin and sodium molybdate solution was used, to a total volume of 5 mL.
Detection and qualification of glysophate
The method for detection and quantification of glyphosate was performed as suggested by Nagaraja, Besagarahally and Bhaskara (2006) with modifications in the sample, as described above. The reaction of glyphosate with ninhydrin and sodium molybdate formed a product of purple color with maximum absorption at 570 nm. From the calibration curve, the amount of glyphosate present in each sample was determined. To compare data, the glyphosate
was also measured in samples of the natural fortified water and the unpurified water, as reported for the purified samples. Water samples with suspected contamination
The 10 mL water samples were first purified as described above. The volume of the eluate was reduced in a water bath at a temperature of 40° C to around 3.5 mL. Then glyphosate was determined as described above. Assays were performed in triplicate. The quantification of glyphosate reaction was also performed with the unpurified water samples where the volume used was 50 mL.
RESULTS AND DISCUSSION
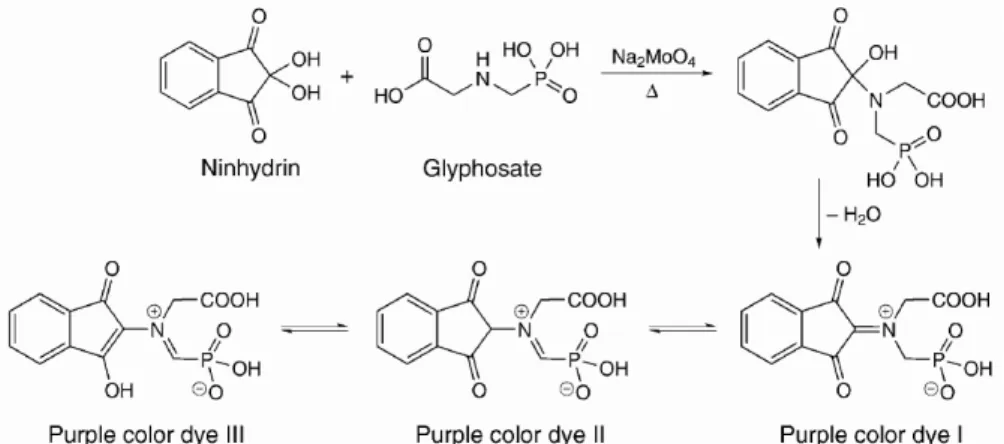
The reaction between ninhydrin, glyphosate and sodium molybdate, proposed by Nagaraja, Besagarahally and Bhaskara (2006) is shown in figure 1. The product is a purple color dye with maximum absorption at 570 nm.
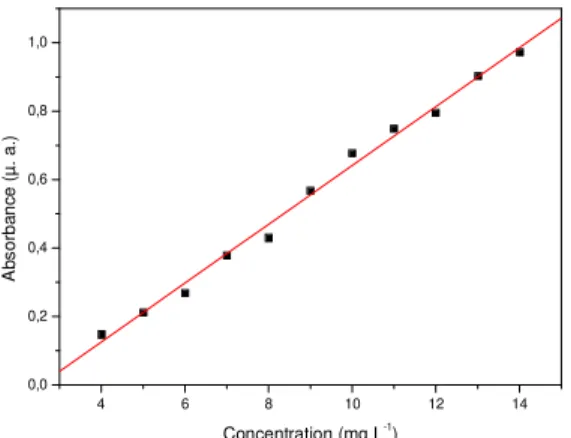
Figure 2 shows the absorption curves of the solutions containing different concentrations of glyphosate in the presence of sodium molybdate and ninhydrin. There was an increase in absorbance proportional to the concentration of glyphosate. The baseline of the instrument was recorded using a solution containing ninhydrin and molybdate sodium dihydrate. The analytical curve shown in figure 3 was derived from the absorbances and the different concentrations of glyphosate. It can be noted that in the concentration range 4 to 14 mg L-1 of glyphosate, the experiment followed
the Beer-Lambert Law. The correlation coefficient for the curve was 0.99679, showing a good correlation between the concentrations studied and the signal generated by the equipment. From the calibration curve the equation: Y = - 0.21837 + 0.08598X was obtained, where Y is the absorbance and X is the concentration of glyphosate.
The limits of detection (LD) and quantitation (LQ) of the method were calculated by the signal/noise ratio of 3 and 10 times respectively (BRITO et al., 2003). The analytical conditions obtained were LD = 0.093 mg L-1 and
LQ = 0.309 mg L-1. The LD is the lowest concentration of
the analyte that can be detected but not necessarily quantified and the LQ is defined as the lowest concentration of the analyte which can be quantified in the sample, with acceptable accuracy and precision under the adopted experimental conditions.
Glyphosate recovery tests
The recovery tests were performed to investigate the precision and accuracy of the method. According to the National Institute of Metrology, Quality and
Technology Instituto Nacional de Metrologia, Normalização e Qualidade Industrial – INMETRO (2011), recovery can be calculated from equation 1.
500 550 600 650 700
0,0 0,2 0,4 0,6 0,8 1,0 A b s o rb a n c e ( µ . a .) Wavelength (nm) Baseline 4.026 mg L-1
5,032 mg L-1
6,038 mg L-1
7,045 mg L-1
8,051 mg L-1
9,059 mg L-1
10,065 mg L-1
11,071 mg L-1
12,077 mg L-1
13,085 mg L-1
14,091 mg L-1
4 6 8 10 12 14
0,0 0,2 0,4 0,6 0,8 1,0 A b s o rb a n c e ( µ . a .)
Concentration (mg L-1 )
Figure 2 – Variation in the concentration of glyphosate from 4.026 to 14.091 mg L-1 in the presence of ninhydrin
and sodium molybdate.
Figure 3 – Analytical curve of glyphosate in the concentration range from 4.026 to 14.091 mg L-1 with
ninhydrin and sodium molybdate.
1 2
3 C -C
Recovery(%)= x100
C (1)
Where: C1 = concentration determined in the enriched sample; C2 = concentration determined in the un-enriched sample; C3 = concentration added.
For the purification, the pH of the samples containing glyphosate or suspected contamination was adjusted to 11. At this pH value, the carboxylic, phosphonate and amino groups are deprotonated. Thus the interaction with the resin becomes more effective. Three different types of resins and eluents were tested. The Amberlite IRA-420 and Dowex 1-X8 resins did not produce satisfactory results. The DOWEX MWA-1 free base resin showed consistent results. Eluents such as HCl 0.60 mol L-1
were tested but this solution changes the pH of the reaction and consequently the color of the product as well as the maximum absorption. A solution of NaCl was tested as an eluent at concentrations of 0.10 and 1.00 mol L-1. The results
obtained with both concentrations were satisfactory and the values of recovery of glyphosate were identical for both concentrations of the eluent. Thus we chose to use the solution of NaCl at a concentration of 0.10 mol L-1 to
elute the glyphosate from the chromatographic column. We found no reports in the literature regarding the use of DOWEX MWA-1 resin or NaCl solution as an eluent in the purification of glyphosate.
According to Brito et al. (2003), the percentage coefficient of variation (Equation 2) is one of the parameters that express the accuracy of an analytical process. For analysis of pesticide residues the percentage of recovery can be between 70 and 120% with a coefficient of variation of up to 20%.
samples of water from the artesian well the values remained between 78.12 and 115.81%. For the samples of unpurified water from the stream, the recovery of glyphosate was 90.65 to 112.51%.
It was observed that both the samples of well water and that from the stream (both unpurified) showed the highest recovery values with respect to the purified samples. This was attributed to two factors: the possibility of small losses of glyphosate during the purification process, and the unpurified samples presenting substances which interfered with the final result. According to Nagaraja, Besagarahally and Bhaskara (2006), depending on the concentration, metal ions such as Fe(II) and Cu(II) can significantly affect the results.
Detection and quantification of glyphosate in water samples with suspected contamination
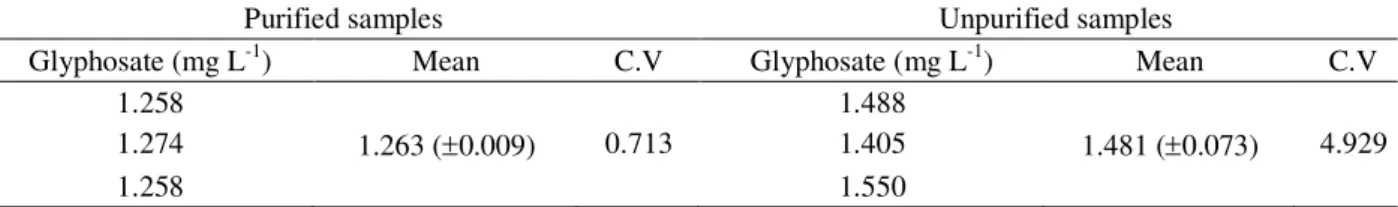
The purified and unpurified water samples suspected of contamination by the herbicide were tested for th e pr esen ce of glyph osate. Th e concentration of glyphosate in the samples was determined from the calibration curve. The analyses for both samples were performed in triplicate. As can be seen in table 3, the higher values of the level of glyphosate refer to the unpurified water samples.
s
CV(%)= x100
M
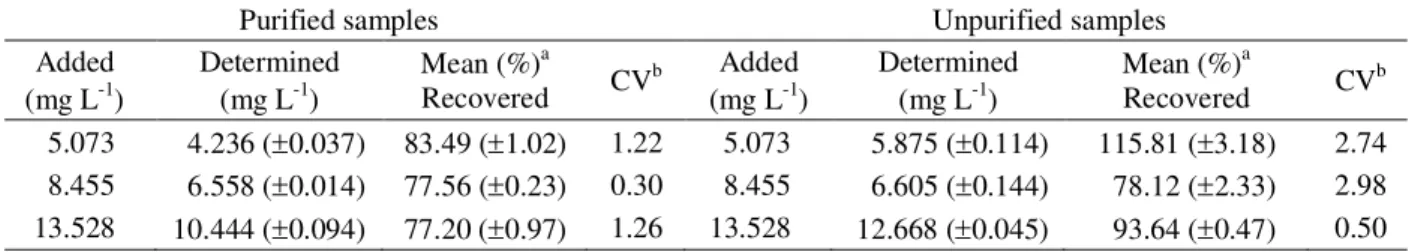
Table 1 – Test results obtained for the recovery of glyphosate in fortified water from an artesian well, purified and unpurified samples.
Table 2 – Test results obtained for the recovery of glyphosate in fortified stream water, purified and unpurified samples.
aPercentage of glyphosate recovered for each level of fortification; values in parentheses represent the standard deviation for each
fortification level; b percentage coefficient change for each fortification level.
(2)
Where s = standard deviation of recoveries and M = mean recoveries.
Thus, the results obtained in the recovery of glyphosate for the samples of purified water, both from the artesian well and the stream may be considered satisfactory, since the recovery of glyphosate from the well water was between 77.20 to 83.49% and for the stream water it was from 78.49 to 90.55%. It was found that in the samples of purified stream water with a fortification level of 13.528 mg L-1 there was greater
variation between the triplicates, which raised the values of standard deviation and coefficient of variation percentage. The unpurified water samples also showed satisfactory recovery values - for the
Purified samples Unpurified samples
Added
(mg L-1) Determined (mg L-1) Mean (%)
a
Recovered CVb
Added
(mg L-1) Determined (mg L-1) Mean (%)
a
Recovered CVb
5.073 4.236 (0.037) 83.49 (1.02) 1.22 5.073 5.875 (0.114) 115.81 (3.18) 2.74
8.455 6.558 (0.014) 77.56 (0.23) 0.30 8.455 6.605 (0.144) 78.12 (2.33) 2.98
13.528 10.444 (0.094) 77.20 (0.97) 1.26 13.528 12.668 (0.045) 93.64 (0.47) 0.50
Purified samples Unpurified samples
Added
(mg L-1) Determined (mg L-1) Mean (%)
a
Recovered CVb
Added
(mg L-1) Determined (mg L-1)a Mean (%)
a
Recovered CVb
5.073 4.593 (0.192) 90.55 (5.39) 5.95 5.073 4.598 (0.241) 90.65 (6.73) 7.42
8.455 6.636 (0.283) 78.49 (4.74) 6.04 8.455 7.970 (0.130) 94.26 (2.17) 2.30
From the content of glyphosate detected in the water samples suspected of contamination, it was found that they contained glyphosate in excess of the level established. According to ordinance 518 Brasil (2004), the maximum value allowed for this herbicide is up to 500 µg L-1
in potable water for human consumption. The levels of glyphosate were also above the value established by Resolution No. 357/2005 of the National Council on the Environment Conselho Nacional do Meio Ambiente – CONAMA (2005), where the upper limit for glyphosate in class 1 or 2 fresh water is 65 µg L-1 and 280 µg L-1 in class
3 fresh water. According to the National Agency of Sanitary Surveillance Agência Nacional de Vigilância Sanitária – ANVISA (2011), the acceptable daily intake of glyphosate is 0.042 mg/Kg p.c.
CONCLUSION
From the values of glyphosate recovered in the samples of water from an artesian well and the fortified samples from a stream, it was found that the resin and the eluent used for purification were effective. The method for quantification of this compound was also effective. The unpurified water samples showed the highest recovery values with respect to the purified samples. From the data it was concluded that the method is reproducible because the results are within the range acceptable for the analysis of residues of pesticides, with a percentage coefficient of variation below the stipulated limit. These data support the possibility of the determination of residues of glyphosate by spectrophotometric techniques. Thus, the method and conditions used in this work may be appropriately used as alternatives for analyzing samples of glyphosate in natural waters. In water samples with suspected contamination, the concentration of glyphosate was higher than the level set by the Ministry of Health.
ACKNOWLEDGMENTS
The authors are grateful for the financial support of CAPES and the Fundação Araucária.
REFERENCES
AGÊNCIA NACIONAL DE VIGILÂNCIA SANITÁRIA – ANVISA. Índice Monográfico G01, available at
www.anvisa.gov.br, accessed February 2011. AMARANTE, O.P.J.; SANTOS, T.C.R. Glifosato: propriedades, toxicidade, usos e legislação. Química Nova, São Paulo v. 25, n. 4, p. 589-593, 2002a.
____________. Métodos de extração e determinação do herbicida glifosato: breve revisão. Química Nova, São Paulo, v. 25, n. 3, p. 420-428, 2002b.
ARANTES, S.A. do C.M.; LAVORENTI, A.;
TORNISIELO, V. L. Efeito da calagem na mineralização de
14c-glifosato em solos. Ciência e Agrotecnologia, Lavras,
v. 35, n. 2, p. 234-241, mar./abr., 2011.
BRITO, N.M. et al. Validação de métodos analíticos: estratégia e discussão. Pesticidas: Revista Ecotoxicologia e Meio Ambiente, Curitiba, v. 13, p. 129-146, 2003.
BRASIL. Ministério da Saúde, Portaria nº 518, de 25 de março de 2004.
BRØNSTAD, J.O.; FRIESTAD, H.O. Method for determination of glyphosate residues in natural waters based on polarography of the n-nitroso deiivative. Analyst, Cambridge, v. 101, p. 820-824, 1976. CONSELHO NACIONAL DO MEIO AMBIENTE – CONAMA. Resolução CONAMA nº 357, de 17 de março de 2005. Brasília. Disponível em: <http://www.mma.gov.br/ port/conama/index.cfm >. Acesso em: 10 de Ago. de 2006. DANIELE, P.G. et al. Copper(II) complexes of
N-(phosphonomethyl)glycine in aqueous solution: a thermodynamic and spectrophotometric study. Talanta, Oxford, v. 45, p. 425-431, 1997.
Table 3 – Results of analyses of purified and unpurified samples of stream water suspected of contamination by glyphosate.
Purified samples Unpurified samples
Glyphosate (mg L-1) Mean C.V Glyphosate (mg L-1) Mean C.V
1.258 1.488
1.274 1.263 (0.009) 0.713 1.405 1.481 (0.073) 4.929
ENVIRONMENTAL PROTECTION AGENCY – EPA Method 547, Determination of glyphosate in drinking water by direct-aqueous injection HPLC, post-column derivatization, and fluorescence detection. Office of Research and Development, United States, Cincinnati, 1990.
FREUZE, I.; JADAS-HECART, A.; ROYER, A. Influence of complexation phenomena with multivalent cations on the analysis of glyphosate and aminomethyl phosphonic acid in water. Journal of Chromatography A,
Amsterdam, v. 1175, p. 197-206, 2007.
GLASS, R.L. Colorimetric determination of glyphosate in water after oxidation to orthophosphate. Analytical Chemistry, Washington, v. 53, n. 6, p. 921-923, 1981. HOGENDOORN, E.A. et al. Rapid determination of glyphosate in cereal samples by means of pre-column derivatisation with 9-fluorenylmethyl chloroformate and coupled-column liquid chromatography with
fluorescence detection. Journal of Chromatography A, Amsterdam, v. 833, p. 67–73, 1999.
IBÁÑEZ, M. et al. Residue determination of glyphosate, glufosinate and aminomethylphosphonic acid in water and soil samples by liquid chromatography coupled to electrospray tandem mass spectrometry. Journal of Chromatography A, Amsterdam, v. 1081, p. 145-155, 2005. INSTITUTO NACIONAL DE METROLOGIA,
NORMALIZAÇÃO E QUALIDADE INDUSTRIAL – INMETRO. Available at http://www.inmetro.gov.br/kits/ doqcgcre008r01.pdf, accessed in June 2011.
KODAMA, S. et al. A fast and simple analysis of glyphosate in tea beverages by capillary electrophoresis with on-line copper(II)-glyphosate complex formation. Journal of Health Science, Tokyo, v. 54, n. 5, p. 602-606, 2008.
NAGARAJA, P.; BESAGARAHALLY L.; BHASKARA. Direct sensitive spectrophotometric determination of glyphosate by using ninhydrin as a chromogenic reagent in formulations and environmental water
samples. Helvetica Chimica Acta, Weinheim, v. 89, p. 2686-2693, 2006.
SELIM, E. et al. Foliar-applied glyphosate substantially reduced uptake and transport of iron and manganese in sunflower (Helianthus annuus L.) plants. Journal of Agricultural and Food Chemistry, Washington, v. 54, p. 10019-10025, 2006.
SILVA, A.S. et al. A simple and green analytical method for determination of glyphosate in commercial
formulations and water by diffuse reflectance
spectroscopy. Spectrochimica Acta Part A, Kansas, v. 79, p. 1881– 1885, 2011.
SUNDARAM, A.; SUNDARAM, K.M.S. Solubility products of six metal-glyphosate complexes in water and forestry soils, and their influence on glyphosate toxicity to plants. Journal of Environmental Science and Health, PartB, Philadelphia, v. 32, n. 4, p. 583- 598, 1997.
TSUJI, M.; AKIYAMA, Y.; YANO, M. Simultaneous determination of glufosinate and its metabolite, and glyphosate in crops. Analytical Sciences, Tokyo, v. 13, p. 283-285, 1997.
UNDABEYTIA, T. et al. FTIR study of glyphosate-copper complexes. Journal of Agricultural and Food Chemistry, Washington, v.50, p. 1918–1921, 2002. WAIMAN, C.V. et al. A simple and rapid
spectrophotometric method to quantify the herbicide glyphosate in aqueous media. Application to adsorption isotherms on soils and goethite. Geoderma, Amsterdam, v. 170, p. 154–158, 2012.
WIGFIELD, Y.Y.; DENEAULT, F.; FILLION, J. Residues of glyphosate and its principle metabolite in certain cereals, oilseeds, and pulses grown in Canada, 1990-1992. Bulletin of Environmental Contamination and Toxicology, New York, v. 53, p. 543-547, 1994. YOUNG, J.C.; KHAN, S.U.; MARRIAGE, P.B.
Fluorescence detection and determination of glyphosate via its N-nitroso derivative by thin-layer