Article
Printed in Brazil - ©2017 Sociedade Brasileira de Química 0103 - 5053 $6.00+0.00
*e-mail: [email protected]
Proximate Composition, Mineral Contents and Fatty Acid Composition of
the Different Parts and Dried Peels of Tropical Fruits Cultivated in Brazil
Damila R. Morais,ª Eliza M. Rotta,ª Sheisa C. Sargi,b Elton G. Bonafe,c Rúbia M. Suzuki,c Nilson E. Souza,ª Makoto Matsushitaª and Jesuí V. Visentainer*,ª
aDepartamento de Química and bDepartamento de Ciências Básicas da Saúde, Universidade
Estadual de Maringá, UEM, Av. Colombo, 5790, 87020-900 Maringá-PR, Brazil
cDepartamento de Química, Universidade Tecnológica Federal do Paraná, R. Marcílio Dias, 635,
86812-460 Apucarana-PR, Brazil
The proximate composition, mineral contents and fatty acid composition of different parts (peel, pulp and seeds) of seven tropical fruits were evaluated. Beyond that, this study aims to evaluate the effect of drying processing on peels. Pulp and peel showed highest moisture values (65.7-93.3%), while the seed ranged from 5.8 to 67.2%. The drying processing of peels decreased moisture values (2.3-18.7%). Furthermore, drying processing did not affect ash contents, total crude protein, lipids and fiber values and fatty acid composition for avocado, pineapple, banana, papaya, passion fruit, watermelon and melon. A wide range of mineral contents was noted in different parts of fruit and calcium and potassium were found in larger quantities (25.4 to 4808 mg per 100 g). The fruits exhibited essential fatty acids as omega-6 and omega-3 with the largest contents observed in the peels and seeds (31.4 to 1970 mg per 100 g).
Keywords: fruit composition, pulp, seed, raw peel, oven dried peel, freeze dried peel
Introduction
Fruit consumption has increased worldwide because of taste, disease prevention and health benefits due to the presence of nutrients such as vitamins, minerals, fiber and other bioactive compounds needed by the human body for a healthy life.1-3 However, the increase in consumption
of these fruits also implies an increment in the volume of waste generated, especially peels and seeds. Furthermore, byproducts (peel and seed) from different fruits can be important sources for valuable chemicals.4
According to the related literature,4-6 peels and seeds can
present higher nutrient contents than pulp fruits. However, the peels are highly perishable, mainly due to the large amount of water in their composition. Different drying techniques such as air circulation oven6 and freeze drying
can be applied in fruit peels to delay perishing.
Neri-Numa et al.7 related that Brazil has a wide variety
of cultivated fruits, such as, avocado (Persea americana), pineapple (Ananas comosus), banana (Musa sp.), papaya
(Carica papaya), passion fruit (Passiflora edulis), watermelon (Citrullus lanatus) and melon (Cucumis melo). Berto et al.8 reported that food waste and hunger are
problems faced by Brazil, therefore the study of pulp, peel and seed of fruits cultivated in this country can reveal important natural sources of nutrients for human health. They also reported that data food composition is important for the development of food composition tables and to estimate population nutritional and country economic indexes.
Experimental
Sampling
Different types of tropical fruit: avocado (P. americana), p i n e a p p l e (A . c o m o s u s) , b a n a n a (M u s a s p.) , papaya (C. papaya), passion fruit (P. edulis), watermelon (C. lanatus), and melon (C. melo) grown in Brazil, were obtained in three different periods during 2010. Ripe fruits were washed in tap water, dried with paper towel then, manually separated into peels, pulps, and seeds. Seeds were placed on a watch glass and dried for 120 h in the ambient conditions of pressure and temperature (25 °C). Peels were divided among three groups: raw, oven dried and freeze dried. Oven dried peels were dried in oven drier (Q314M-Quimis) with air circulation at 60 °C by 24 h for avocado and banana peels, and by 48 h for papaya, pineapple, passion fruit, melon and watermelon peels. Peels were freeze dried during 24 h in a bench lyophilizer (Christ model Alpha 1-2 LDplus). Each part of the different fruits: pulp, seed, raw peel, oven dried peel and lyophilized peel was, one by one, subsequently ground and stored in different polyethylene bags under a vacuum at −18 °C until analysis. All analyses were done in triplicate for each sampling period.
Chemicals and standards
T h e r e a g e n t s w e r e : m e t h a n o l ( M e O H ) , chloroform (CHCl3), isooctane (2,2,4-trimethylpentane),
sulfuric acid (H2SO4), boric acid (H3BO3), hydrochloric
acid (HCl), nitric acid (HNO3), sodium hydroxide
(NaOH), copper sulfate (CuSO4), sodium sulfate (Na2SO4),
sodium chloride (NaCl), selenium metal, ammonium molybdate ((NH4)6Mo7O24.4H2O), and ammonium
vanadate (NH4VO3).
Fatty acid methyl ester (FAME) standard (mixture 189-19, Sigma®) and tricosanoic FAME (23:0, Sigma®)
were used. Ultrapure water was obtained from a Milli-Q ultrapure water purification system (Millipore, Bedford, MA, USA). Minerals (Mn, Zn, Fe, Cu, Mg, and Na; Qhemis®, Specsol®), and dibasic potassium phosphate
(K2HPO4·3H2O, Merck®) were used. All other chemicals
and solvents were of analytical reagent grade.
Proximate composition
Moisture, ash, and crude protein content were determined according to the literature.9 A factor of 6.25
was used to convert the total nitrogen in protein in all samples. Crude fiber was determined by the Instituto Adolfo Lutz method.10 Total lipids (TL) were extracted by
the method of Bligh and Dyer.11 All analyses were carried
out in triplicate and values were expressed as percentages on a dried basis (%DB), except for moisture, which was expressed as a percentage on a wet basis (%WB).
Mineral contents
The digestion of the samples was carried out by drying in an oven at 600 °C for 4 hours, the ashes and the crucibles were previously decontaminated with a solution of 10% nitric acid at rest for a night and rinsed. Then, 10 mL of 5% nitric acid was added to the sample, and this mixture was heated until complete dissolution of the ash, which was then filtered. After the sample had reached room temperature, the solution was put into a 25 mL volumetric flask and the volume thereof was supplemented with deionized water.
The determination of calcium (Ca), magnesium (Mg), potassium (K), sodium (Na), copper (Cu), iron (Fe), manganese (Mn) and zinc (Zn) contents was performed according to Instituto Adolfo Lutz,10 using an atomic
absorption spectrophotometer flame (Varian® model
AA 240FS). Calibration curves for each element were plotted using standard mineral diluted with deionized water. All analyses were performed in triplicate; the results were expressed in milligrams per 100 g of sample on a dry basis (mg per 100 g DB).
Fatty acid composition
FAME were prepared by methylation of TL as described by Joseph and Ackman,12 and analyses were
carried out in duplicate. Methyl esters were separated by gas chromatography in a Trace Ultra 3300 model (Thermo Scientific) equipped with a flame ionization detector (FID) and a cyanopropyl capillary column (100 m × 0.25 internal diameter, 0.25 µm film thickness, CP 7420 Varian, EUA). The injector and detector temperatures were 240 °C. The gas flow rates used were 1.2 mL min-1 for carrier gas (H
2),
30 mL min-1 for make-up gas (N
2), and 35 and 300 mL min-1
for flame gases (H2 and synthetic air, respectively). The
sample splitting rate was 1:80 and the samples (2 µL) were injected in duplicate. The operational parameters were as follows: the column temperature was held at 185 °C for 7.5 min, programmed to increase at 4 °C min-1 to 235 °C,
and maintained at this temperature for 1.5 min; the total run time was 25 min. The peak areas were determined by ChromQuest 5.0 software. For FA identification, retention times were compared with those of standard methyl esters.
an internal standard (23:0), as described by Joseph and Ackman.12 Theoretical FID correction factor values13
were used to obtain concentration values. FA content was calculated in milligrams per gram of TL by using the equation 1:
(1)
where FA is expressed as milligrams per gram of TL, AX
is the peak area (FA), AIS is the peak area of the internal
standard (IS) methyl ester of tricosanoic acid (23:0), WIS
is the IS weight (mg) added to the sample (in mg), WX is
the sample weight (in mg), CFX is the theoretical correction
factor, and CFAE is the conversion factor necessary to express
results as milligrams of FA rather than as methyl esters. The results were converted to milligrams of FA per 100 g of sample on a dried basis (mg per 100 g DB).
Statistical analysis
Results were reported as mean ± standard deviation (SD). Data were analyzed by one-way analysis of variance (ANOVA). The Tukey test, at p = 0.05, was used to assess significant differences between means of samples.
Results and Discussion
Chemical composition
Table 1 shows the chemical composition values obtained. The analyses showed significant differences among different fruit parts. Pulps and raw peels presented higher moisture content (varied from 65.8 ± 3.1 to 93.3 ± 0.2 g per 100 g in wet basis, WB) than seeds analyzed. The fruit pulps moisture values reported in Table 1 are according to Tabela Brasileira de Composição de Alimentos (TACO)14 values: 83.8, 86.3, 73.8, 82.9, 90.7
and 91.3% WB of avocado, pineapple, banana, passion fruit, watermelon and melon, respectively, and 88.6% BU of papaya. Mooz et al.15 evaluated the moisture content of
different variety avocado pulps and obtained the values: 79.37 to 83.47% WB. Lopes et al.16 also reported 7% WB
of moisture to seed of passion fruit different varieties. Tripathi et al.17 evaluated the moisture content in pulps of
papaya different varieties and reported values (85.0 ± 0.1 and 87.7 ± 0.7% WB) similar to Table 1.
According to Celestino,18 products with lower moisture
content, generally, are less subject to degradation by microorganisms and chemical changes. The high moisture peel contents observed suggests that the peels require
drying process for better conservation of the product. Both drying methodologies decreased the peel moisture (raw peels moisture range of 65.6 ± 1.4 to 92.5 ± 1.0% WB, oven dried peels moisture range of 4.3 ± 0.4 to 12.3 ± 2.9% WB, and freeze dried peels moisture range of 2.4 ± 0.2 to 18.8 ± 0.2% WB). Guimarães et al.19 evaluated the moisture
content in watermelon dried peel and reported the value 9.1 ± 0.3% WB, similar to Table 1.
The sample ash values (Table 1) varied from 1.5 ± 0.1 to 14.3 ± 0.2% in dry basis (DB). Peels presented the largest ash values (range of 1.6 ± 0.3 to 12.8 ± 0.9 g per 100 g DB), without statistically significant differences among raw and dried peel values on a dry basis (DB). The fruit pulps ash values reported in Table 1, when converted to wet basis, are according to TACO14 values.
Guimarães et al.19 evaluated ash in watermelon dried
peel and obtained the value 12.7 ± 0.1%, and El-Adawy and Taha20 evaluated watermelon seed and reported 3.6%
DB, these values are similar to Table 1. It is important to note that the ash composition is the amount of mineral elements in food.21
Crude protein values varied from 4.4 ± 1.0 to 23.3 ± 0.5% DB (Table 1). Seeds presented the highest crude protein content (varying from 9.7 ± 1.6 to 23.3 ± 0.5 g per 100 g DB), except for avocado. When values in Table 1 are converted to wet basis it is possible to compare and to affirm that the fruit pulps moisture values reported in this study (1.6 ± 0.3, 0.7 ± 0.3, 1.2 ± 0.2, 0.8 ± 0.1, 1.2 ± 0.3, 1.1 ± 0.2, 0.8 ± 0.1% WB of avocado, pineapple, banana, papaya, passion fruit, watermelon and melon, respectively) are in accordance with TACO values: 1.2, 0.9, 1.4, 0.5, 2.0, 0.9 and 0.7% WB of avocado, pineapple, banana, papaya, passion fruit, watermelon and melon, respectively. Mooz et al.15 evaluated the crude
protein in different varieties of avocado pulp and reported values in the range of 1.1 to 1.8% WB values, which are similar to obtained in this study. Tripathi et al.17 reported
values of 0.7 ± 0.0 and 0.8 ± 0.0% WB of crude protein in different cultivars and ripeness stage of papaya pulp, similar to Table 1. It is important to remark here that fruit values of crude protein are low because the fruit in general are not potential sources of proteins.22
Different parts of fruits presented total lipids (TL) values in the range of 1.1 ± 0.2 to 28.7 ± 7.9% DB. Seeds (range of 14.0 ± 2.0 to 27.5 ± 1.4 g per 100 g DB) presented the highest TL, except for avocado, because avocado seed presented low TL value, 3.9 ± 0.3% DB, and avocado pulp the highest TL value, 28.7 ± 7.9% DB. The TL are generally low in fruits, particularly in peel and pulp, however, it can be found in higher concentrations in seeds.23 When the Table 1
0.2 ± 0.0, 25.9 ± 1.5 and 18.1 ± 3.2% WB, avocado pulp, pineapple pulp, papaya pulp, passion fruit seed, watermelon seed, respectively) it is possible to affirm that these values are similar to: reported by Mooz et al.15 for avocado pulp
TL of variety “Butter pear”, 4.8% WB; reported by TACO14
for pineapple pulp, 0.1% WB, and papaya pulp, 0.1% WB; reported by Lopes et al.16 for passion fruit seed, 23% WB;
and reported by Jarret and Levy24 for watermelon seed in
the range of 15.0 to 29.8% WB.
Samples crude fiber contents ranged values of 1.9 ± 0.3 to 56.7 ± 0.5% DB (Table 1). Pulp fruits presented the lowest values (range of 1.9 ± 0.3 to 12.2 ± 0.4% DB). Seeds (range of 41.6 ± 7.3 to 56.7 ± 0.5 g per 100 g DB) and raw peels (varied from 16.3 ± 2.5 to 39.2 ± 7.6 g per 100 g DB) presented the highest values of crude fiber, except for avocado. The values reported in Table 1 for TL values
are similar to: TACO,14 38.9, 7.3 and 6.4% DB pulps of
avocado, pineapple and passion fruit, respectively; and the reported by Emaga et al.25 for banana peel, 50% DB.
It is important to highlight that neither freeze drying nor oven drying methodologies decreased the nutrient amount (ash, crude protein, total lipids, and crude fiber).
Mineral contents
The results of calcium, magnesium, potassium, sodium, copper, iron, manganese, and zinc are presented in Table 2. According to ash contents (Table 1), processing fruit peels ashes represented similar values. Thus, the mineral contents were analyzed only processed peel.
Minerals are essential for the maintenance of human health. The average daily reference values of recommended
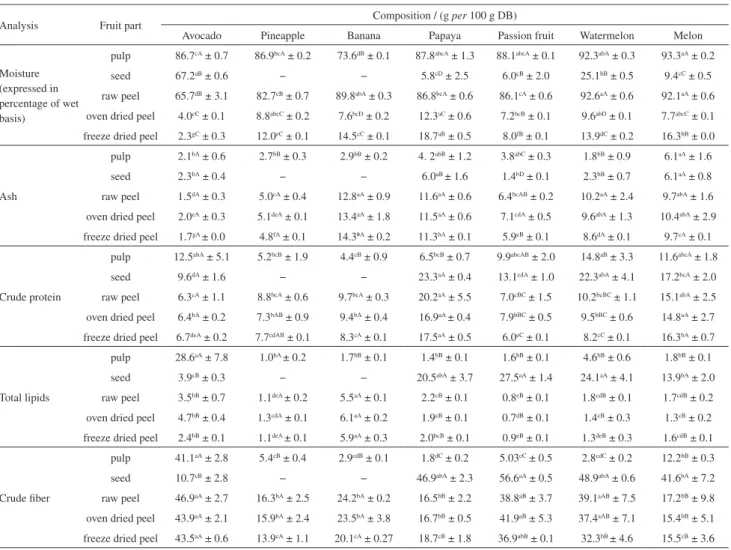
Table 1. Proximate composition in pulp, seed, raw peel, oven dried peel, freeze dried peel of avocado (Persea americana), pineapple (Ananas comosus), banana (Musa sp.), papaya (Carica papaya), passion fruit (Passiflora edulis), watermelon (Citrullus lanatus) and melon (Cucumis melo), expressed in percentage fruit part in dried basis (g per 100 g DB), except moisture which were expressed in percentage of wet basis (%WB)
Analysis Fruit part Composition / (g per 100 g DB)
Avocado Pineapple Banana Papaya Passion fruit Watermelon Melon
Moisture (expressed in percentage of wet basis)
pulp 86.7cA ± 0.7 86.9bcA ± 0.2 73.6dB ± 0.1 87.8abcA ± 1.3 88.1abcA ± 0.1 92.3abA ± 0.3 93.3aA ± 0.2
seed 67.2aB ± 0.6 − − 5.8cD ± 2.5 6.0cB ± 2.0 25.1bB ± 0.5 9.4cC ± 0.5
raw peel 65.7dB ± 3.1 82.7cB ± 0.7 89.8abA ± 0.3 86.8bcA ± 0.6 86.1cA ± 0.6 92.6aA ± 0.6 92.1aA ± 0.6
oven dried peel 4.0cC ± 0.1 8.8abcC ± 0.2 7.6bcD ± 0.2 12.3aC ± 0.6 7.2bcB ± 0.1 9.6abD ± 0.1 7.7abcC ± 0.1
freeze dried peel 2.3gC ± 0.3 12.0eC ± 0.1 14.5cC ± 0.1 18.7aB ± 0.5 8.0fB ± 0.1 13.9dC ± 0.2 16.3bB ± 0.0
Ash
pulp 2.1bA ± 0.6 2.7bB ± 0.3 2.9bB ± 0.2 4. 2abB ± 1.2 3.8abC ± 0.3 1.8bB ± 0.9 6.1aA ± 1.6
seed 2.3bA ± 0.4 − − 6.0aB ± 1.6 1.4bD ± 0.1 2.3bB ± 0.7 6.1aA ± 0.8
raw peel 1.5dA ± 0.3 5.0cA ± 0.4 12.8aA ± 0.9 11.6aA ± 0.6 6.4bcAB ± 0.2 10.2aA ± 2.4 9.7abA ± 1.6
oven dried peel 2.0eA ± 0.3 5.1deA ± 0.1 13.4aA ± 1.8 11.5aA ± 0.6 7.1cdA ± 0.5 9.6abA ± 1.3 10.4abA ± 2.9
freeze dried peel 1.7gA ± 0.0 4.8fA ± 0.1 14.3ªA ± 0.2 11.3bA ± 0.1 5.9eB ± 0.1 8.6dA ± 0.1 9.7cA ± 0.1
Crude protein
pulp 12.5abA ± 5.1 5.2bcB ± 1.9 4.4cB ± 0.9 6.5bcB ± 0.7 9.9abcAB ± 2.0 14.8aB ± 3.3 11.6abcA ± 1.8
seed 9.6dA ± 1.6 − − 23.3aA ± 0.4 13.1cdA ± 1.0 22.3abA ± 4.1 17.2bcA ± 2.0
raw peel 6.3cA ± 1.1 8.8bcA ± 0.6 9.7bcA ± 0.3 20.2aA ± 5.5 7.0cBC ± 1.5 10.2bcBC ± 1.1 15.1abA ± 2.5
oven dried peel 6.4bA ± 0.2 7.3bAB ± 0.9 9.4bA ± 0.4 16.9aA ± 0.4 7.9bBC ± 0.5 9.5bBC ± 0.6 14.8aA ± 2.7
freeze dried peel 6.7deA ± 0.2 7.7cdAB ± 0.1 8.3cA ± 0.1 17.5aA ± 0.5 6.0eC ± 0.1 8.2cC ± 0.1 16.3bA ± 0.7
Total lipids
pulp 28.6aA ± 7.8 1.0bA ± 0.2 1.7bB ± 0.1 1.4bB ± 0.1 1.6bB ± 0.1 4.6bB ± 0.6 1.8bB ± 0.1
seed 3.9cB ± 0.3 − − 20.5abA ± 3.7 27.5aA ± 1.4 24.1aA ± 4.1 13.9bA ± 2.0
raw peel 3.5bB ± 0.7 1.1deA ± 0.2 5.5aA ± 0.1 2.2cB ± 0.1 0.8eB ± 0.1 1.8cdB ± 0.1 1.7cdB ± 0.2
oven dried peel 4.7bB ± 0.4 1.3cdA ± 0.1 6.1aA ± 0.2 1.9cB ± 0.1 0.7dB ± 0.1 1.4cB ± 0.3 1.3cB ± 0.2
freeze dried peel 2.4bB ± 0.1 1.1deA ± 0.1 5.9aA ± 0.3 2.0bcB ± 0.1 0.9eB ± 0.1 1.3deB ± 0.3 1.6cdB ± 0.1
Crude fiber
pulp 41.1aA ± 2.8 5.4cB ± 0.4 2.9cdB ± 0.1 1.8dC ± 0.2 5.03cC ± 0.5 2.8cdC ± 0.2 12.2bB ± 0.3
seed 10.7cB ± 2.8 − − 46.9abA ± 2.3 56.6aA ± 0.5 48.9abA ± 0.6 41.6bA ± 7.2
raw peel 46.9aA ± 2.7 16.3bA ± 2.5 24.2bA ± 0.2 16.5bB ± 2.2 38.8aB ± 3.7 39.1aAB ± 7.5 17.2bB ± 9.8
oven dried peel 43.9aA ± 2.1 15.9bA ± 2.4 23.5bA ± 3.8 16.7bB ± 0.5 41.9aB ± 5.3 37.4aAB ± 7.1 15.4bB ± 5.1
freeze dried peel 43.5aA ± 0.6 13.9cA ± 1.1 20.1cA ± 0.27 18.7cB ± 1.8 36.9abB ± 0.1 32.3bB ± 4.6 15.5cB ± 3.6
dietary allowances (RDA) for adults established by USA National Institute of Health (NIH)26 for men and
women, from 19 to 70 years, are: 1,000-1,200, 310-420, 4,700, 1,200-1,500, 0.9, 8-14, 1.8-2.3 and 8-11 mg per day of Ca, Mg, K, Na, Cu, Fe, Mn and Zn, respectively.
The calcium content was the highest in peels and seeds (332.1-9770.9 mg per 100 g) followed by pulps (25.4-202.7 mg per 100 g). Papaya seed and watermelon dried peel were considered excellent natural sources of Ca, 15 g of these samples content more than the RDA of Ca (1,200 mg per day).
Magnesium concentration was similar among parts of fruits for avocado (46.9-82.15 mg per 100 g), pineapple (107.6-145.6 mg per 100 g) and passion fruit (76.8-106.2 mg per 100 g). For others fruits studied, peels and seeds showed highest magnesium content than pulp. Concentrations higher than 50% of the RDA of Mg
(420 mg per day) were found only in papaya seed and watermelon dried peel.
Potassium was the most abundant mineral studied in parts of fruits ranging from 362.6 to 4808.1 mg per 100 g. Papaya, passion fruit and watermelon dried peel samples presented K contents > 40% of the RDA of this element (4,700 mg per day). It can be observed that potassium and sodium content was the highest in peels and pulps. Sodium content was the lowest among macrominerals analyzed. The most samples content less than 10% of the RDA of Na (1,500 mg per day), except melon dried peel (20% of the RDA of Na) and passion fruit dried peel (22% of the RDA of Na).
Regarding the microminerals, the values ranged from 0.4 to 17.5 mg per 100 g for the fruit. The highest amount of copper, followed by iron, manganese and zinc. These minerals are important for health status and it can
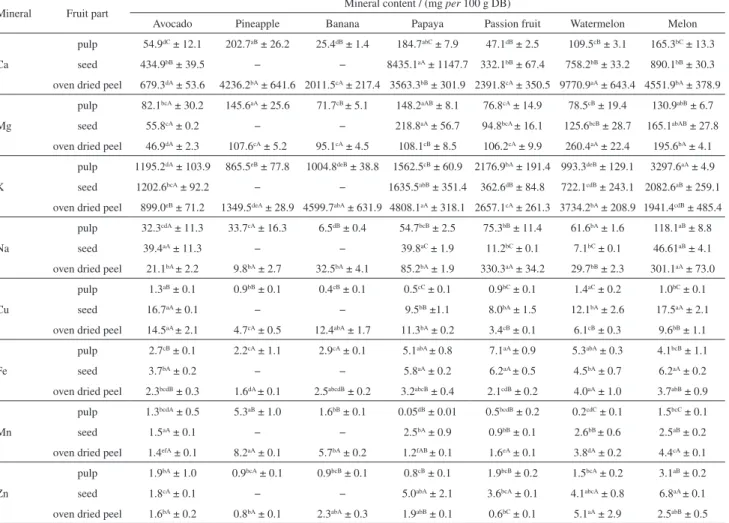
Table 2. Mineral contents in pulp, seed, and oven dried peel of avocado (Persea americana), pineapple (Ananas comosus), banana (Musa sp.), papaya (Carica papaya), passion fruit (Passiflora edulis), watermelon (Citrullus lanatus) and melon (Cucumis melo) in mg of mineral per 100 g of fruit part in dried basis (mg per 100 g DB)
Mineral Fruit part Mineral content / (mg per 100 g DB)
Avocado Pineapple Banana Papaya Passion fruit Watermelon Melon
Ca
pulp 54.9dC ± 12.1 202.7aB ± 26.2 25.4dB ± 1.4 184.7abC ± 7.9 47.1dB ± 2.5 109.5cB ± 3.1 165.3bC ± 13.3
seed 434.9bB ± 39.5 − − 8435.1aA ± 1147.7 332.1bB ± 67.4 758.2bB ± 33.2 890.1bB ± 30.3
oven dried peel 679.3dA ± 53.6 4236.2bA ± 641.6 2011.5cA ± 217.4 3563.3bB ± 301.9 2391.8cA ± 350.5 9770.9aA ± 643.4 4551.9bA ± 378.9
Mg
pulp 82.1bcA ± 30.2 145.6aA ± 25.6 71.7cB ± 5.1 148.2aAB ± 8.1 76.8cA ± 14.9 78.5cB ± 19.4 130.9abB ± 6.7
seed 55.8cA ± 0.2 − − 218.8aA ± 56.7 94.8bcA ± 16.1 125.6bcB ± 28.7 165.1abAB ± 27.8
oven dried peel 46.9dA ± 2.3 107.6cA ± 5.2 95.1cA ± 4.5 108.1cB ± 8.5 106.2cA ± 9.9 260.4aA ± 22.4 195.6bA ± 4.1
K
pulp 1195.2dA ± 103.9 865.5eB ± 77.8 1004.8deB ± 38.8 1562.5cB ± 60.9 2176.9bA ± 191.4 993.3deB ± 129.1 3297.6aA ± 4.9
seed 1202.6bcA ± 92.2 − − 1635.5abB ± 351.4 362.6dB ± 84.8 722.1cdB ± 243.1 2082.6aB ± 259.1
oven dried peel 899.0eB ± 71.2 1349.5deA ± 28.9 4599.7abA ± 631.9 4808.1aA ± 318.1 2657.1cA ± 261.3 3734.2bA ± 208.9 1941.4cdB ± 485.4
Na
pulp 32.3cdA ± 11.3 33.7cA ± 16.3 6.5dB ± 0.4 54.7bcB ± 2.5 75.3bB ± 11.4 61.6bA ± 1.6 118.1aB ± 8.8
seed 39.4aA ± 11.3 − − 39.8aC ± 1.9 11.2bC ± 0.1 7.1bC ± 0.1 46.61aB ± 4.1
oven dried peel 21.1bA ± 2.2 9.8bA ± 2.7 32.5bA ± 4.1 85.2bA ± 1.9 330.3aA ± 34.2 29.7bB ± 2.3 301.1aA ± 73.0
Cu
pulp 1.3aB ± 0.1 0.9bB ± 0.1 0.4cB ± 0.1 0.5cC ± 0.1 0.9bC ± 0.1 1.4aC ± 0.2 1.0bC ± 0.1
seed 16.7aA ± 0.1 − − 9.5bB ±1.1 8.0bA ± 1.5 12.1bA ± 2.6 17.5aA ± 2.1
oven dried peel 14.5aA ± 2.1 4.7cA ± 0.5 12.4abA ± 1.7 11.3bA ± 0.2 3.4cB ± 0.1 6.1cB ± 0.3 9.6bB ± 1.1
Fe
pulp 2.7cB ± 0.1 2.2cA ± 1.1 2.9cA ± 0.1 5.1abA ± 0.8 7.1aA ± 0.9 5.3abA ± 0.3 4.1bcB ± 1.1
seed 3.7bA ± 0.2 − − 5.8aA ± 0.2 6.2aA ± 0.5 4.5bA ± 0.7 6.2aA ± 0.2
oven dried peel 2.3bcdB ± 0.3 1.6dA ± 0.1 2.5abcdB ± 0.2 3.2abcB ± 0.4 2.1cdB ± 0.2 4.0aA ± 1.0 3.7abB ± 0.9
Mn
pulp 1.3bcdA ± 0.5 5.3aB ± 1.0 1.6bB ± 0.1 0.05dB ± 0.01 0.5bcdB ± 0.2 0.2cdC ± 0.1 1.5bcC ± 0.1
seed 1.5aA ± 0.1 − − 2.5bA ± 0.9 0.9bB ± 0.1 2.6bB ± 0.6 2.5aB ± 0.2
oven dried peel 1.4efA ± 0.1 8.2aA ± 0.1 5.7bA ± 0.2 1.2fAB ± 0.1 1.6eA ± 0.1 3.8dA ± 0.2 4.4cA ± 0.1
Zn
pulp 1.9bA ± 1.0 0.9bcA ± 0.1 0.9bcB ± 0.1 0.8cB ± 0.1 1.9bcB ± 0.2 1.5bcA ± 0.2 3.1aB ± 0.2
seed 1.8cA ± 0.1 − − 5.0abA ± 2.1 3.6bcA ± 0.1 4.1abcA ± 0.8 6.8aA ± 0.1
oven dried peel 1.6bA ± 0.2 0.8bA ± 0.1 2.3abA ± 0.3 1.9abB ± 0.1 0.6bC ± 0.1 5.1aA ± 2.9 2.5abB ± 0.5
be observed that peels and seed showed major contents than pulps. All samples can be considered natural sources of Cu, however banana pulp and papaya pulp, which presented concentrations lower than 100% of the RDA of Cu 0.9 mg per day. Pulp and seeds of papaya, passion fruit, watermelon and melon concentrations of Fe are higher than 28% of the RDA of Fe (14 mg per day). Based on the RDA, ca. 30 g of banana peel presents more than 100% of the RDA of Mn 2.3 mg per day. Papaya seed, watermelon dried peel and melon seed samples present concentrations higher than 45% of the RDA of Zn 11 mg per day.
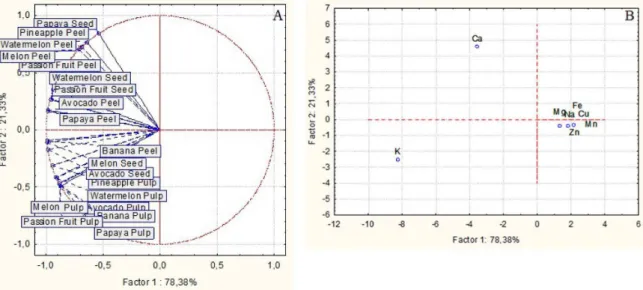
It notes that all mineral concentrations obtained (Table 2) to pulps were similar to those of TACO.14 The
principal component analysis (PCA) was used to obtain additional information about the mineral contents of the different parts of tropical fruits. The combination of two components explained approximately 99.71% of the original data variability.
As shown in Figures 1A and 1B, the samples were grouped in two distinct groups. The first one was formed by peels of pineapple, papaya, melon, avocado, passion fruit and watermelon and seeds of papaya, passion fruit and watermelon, all strongly correlated with calcium. The second group was formed by pulps, banana peel and seeds of melon and avocado that showed a strong correlation with potassium. Other minerals analyzed were not correlated with the samples.
It should be noted in Figure 1 that contents of calcium and potassium were highest greater than others minerals analyzed. In general, it can be observed that pulps showed highest values of potassium and seeds and peels showed highest values of calcium. From the results obtained, it can be seen that peels and seeds of fruits showed significant amount of minerals evaluated, which suggests that
analyzed peel and seeds of the fruits can be considered as a source alternative nutrients. Parts of tropical fruits are a source of minerals16 and these results can encourage their
consumption.
Fatty acid composition
Table 3 shows that a total of 15 FA were evaluated in samples as saturated fatty acids (SFA), monounsaturated fatty acids (MUFA) and polyunsaturated fatty acids (PUFA). The major FAs in samples were the SFA:palmitic acid (16:0) and stearic acid (18:0). Avocado and other fruit seeds presented the largest amounts of FA. The main MUFA in samples was oleic acid (18:1n-9); and, according to Mooz et al.,15 oleic acid reduces the levels of total cholesterol,
low density proteins (LDL), triglycerides, and high density proteins (HDL).
According to Coimbra and Jorge,27 the presence of
unsaturated fatty acids, mainly the essentials omega-3 and omega-6, are very important for human health. Linoleic acid (LA, 18:2n-6) was the main PUFA. Alpha-linolenic acid (LNA, 18:3n-3) was present in all samples (Table 3). The average daily reference values of recommended dietary allowances (RDA) and adequate intakes (AI) for adults established by NIH for men and women, from 19 to 70 years, are 11,000-17,000 mg per day for n-6 PUFA (linoleic acid) and 1,100-1,600 mg per day for n-3 PUFA (linolenic acid). All samples contained less than 20% of the RDA of n-3 PUFA (linolenic acid) 1,600 mg per day. Only three samples, passion fruit seed, watermelon seed and melon seed, presented concentrations higher than the RDA of n-6 PUFA (linoleic acid) (17,000 mg per day), the values were 93, 77 and 46%, respectively.
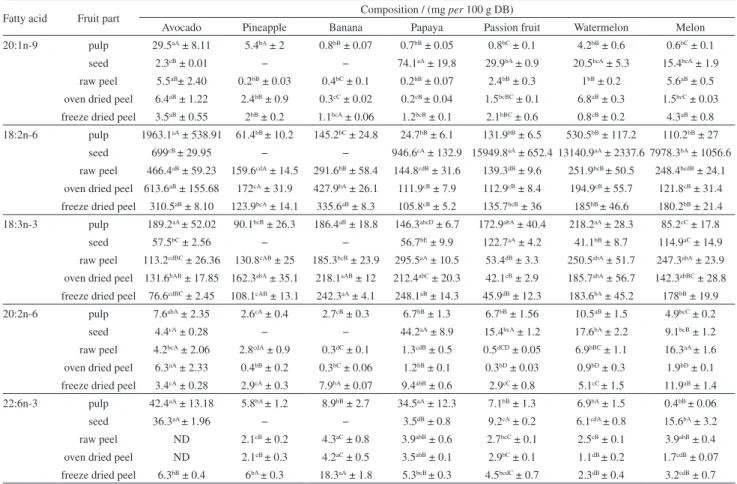
Table 3. Fatty acid composition in pulp, seed, raw peel, oven dried peel, freeze dried peel of avocado (Persea americana), pineapple (Ananas comosus), banana (Musa sp.), papaya (Carica papaya), passion fruit (Passiflora edulis), watermelon (Citrullus lanatus) and melon (Cucumis melo) in mg of fatty acid per 100 g of fruit part in dried basis (mg per 100 g DB)
Fatty acid Fruit part Composition / (mg per 100 g DB)
Avocado Pineapple Banana Papaya Passion fruit Watermelon Melon
14:0 pulp 12.6bA ± 3.5 2.3cB ± 0.6 6.2cB ± 2.2 36.6aB ± 2.6 2.2cC ± 0.2 4.35cB ± 0.6 2.6cC ± 0.6
seed 7bB ± 0.3 − − 52.7aAB ± 18.1 21.6bA ± 0.7 14.4bA ± 2.1 14.3bA ± 1.5
raw peel 5.2bB ± 1.3 3.6bAB ± 0.1 8.6bAB ± 1.4 69.7aA ± 6.9 3.1bBC ± 0.4 4.0bB ± 0.7 9.9bB ± 0.9
oven dried peel 5.6cB ± 0.9 3.7cA ± 0.8 12bA ± 1.1 47.9aAB ± 5.6 2.5cC ± 0.3 4.1cB ± 1 6.9bcB ± 2.3
freeze dried peel 4.8cdB ± 0.2 2.6dAB ± 0.1 9.6bAB ± 0.1 56.9aAB ± 3.0 4.9cdB ± 1.3 3dB ± 0.9 7.1bcB ± 1.2
16:0 pulp 2751.2aA ± 755.0 124.8bA ± 24.3 242.6bB ± 32.9 202.5bB ± 21.5 161.1bB ± 17.8 458.3bB ± 67.9 114.8bB ± 22.5
seed 241.6cB ± 10.4 − − 3234.7aA ± 899.4 3245.5aA ± 93.1 2639.1abA ± 408.6 1486.2bA ± 195.6
raw peel 588.5aB ± 147.1 174.4cA ± 17.5 411.2abA ± 62.7 270.9bcB ± 5.7 98.6cB ± 6.5 241.2bcB ± 43.1 238.0bcB ± 23.1
oven dried peel 782.3aB ± 240.7 157.7bcA ± 26.3 407.5bA ± 48.4 203.9bcB ± 22.4 81.2cB ± 8.7 201.8bcB ± 47.2 124.4cB ± 29.8
freeze dried peel 368.9aB ± 22.5 136.9cA ± 15.9 359.9aA ± 16.8 230.1bB ± 11.3 115.0cB ± 31.1 178.5bcB ± 48.8 176.2bcB ± 24.1
17:0 pulp ND ND ND ND ND ND ND
seed ND − − ND ND ND ND
raw peel ND 5.8aA ± 1.9 4abA ± 0.7 4.6abA ± 0.1 2.5bA ± 0.1 ND ND
oven dried peel ND 5.6aA ± 1.3 4abA ± 0.2 3.7bcB ± 0.5 1.9cB ± 0.2 2.5bc ± 0.6 2.8bc ± 0.5
freeze dried peel ND ND ND ND ND ND ND
18:0 pulp 91.4aA ± 25.1 14.9bB ± 3.1 16.9bC ± 4.2 10.8bB ± 0.05 20.4bB ± 0.8 130.9aB ± 31.3 14.6bB ± 3.7
seed 30.6cB ± 1.5 − − 837.6bA ± 212.3 796.2bA ± 31.3 1855.2aA ± 318.7 581.1bA ± 94.6
raw peel 22.6cdB ± 8.8 29.9bcA ± 3.4 43abAB ± 5.1 20.9cdB ± 0.9 9.7dB ± 1.1 40.5bB ± 7.1 55.3aB ± 5.4
oven dried peel 30.2bB ± 9.0 29.1bA ± 6 55.4aA ± 10.8 17.7bcB ± 2.4 7.3cB ± 0.6 35.2bB ± 6.4 27.9bB ± 6.2
freeze dried peel 16.1cB ± 0.8 21bcAB ± 2 36.7aB ± 1.9 16.9cB ± 1.1 15.1cB ± 4.4 30abB ± 8.3 41.1aB ± 5.7
20:0 pulp 32.6aA ± 10.4 4.4bB ± 0.9 3.4bC ± 0.7 1.0bB ± 0.3 4.5bB ± 0.4 10.7bB ± 1.8 3.3bD ± 0.7
seed 20.0bA ± 4.4 − − 74.4aA ± 18.7 44.8bA ± 1.3 75.4aA ± 9.3 32.4bA ± 4.5
raw peel ND 10.5bAB ± 1.4 5.5cB ± 0.8 6.0cB ± 0.6 1.3dC ± 0.03 5.6cB ± 1.2 13.7aB ± 1.4
oven dried peel ND 15.9aA ± 4.9 6.9bcAB ± 0.6 5.0bcB ± 0.2 1.2cC ± 0.1 6.1bcB ± 1 7.2bCD ± 1.5
freeze dried peel 22.9aA ± 2.1 7.4bcB ± 0.7 8.4bA ± 0.2 4.9cdB ± 0.3 1.5eC ± 0.4 4.1deB ± 1 10.1bBC ± 1.4
22:0 pulp 6aB ± 1.9 0.9cB ± 0.2 0.3cC ± 0.05 0.3cC ± 0.04 3.3bA ± 0.3 2bcB ± 0.3 0.2cB ± 0.01
seed 5.9abB ± 0.7 − − 6.7abB ± 1.4 3.1bA ± 0.2 5.2abB ± 2.9 9.0aA ± 0.9
raw peel ND 3.2cA ± 0.2 6.1bA ± 0.7 12.7aA ± 1.4 3cdA ± 0.08 5.8bB ± 1.1 1.1dB ± 0.1
oven dried peel ND 5.1cA ± 1.4 6.7bcA ± 0.7 11.1aA ± 0.1 2.5cA ± 0.09 12.1aA ± 2.5 9.7abA ± 2.4
freeze dried peel 19.8aA ± 1.7 1.3cB ± 0.4 2bcB ± 0.1 1.0cC ± 0.1 3.1bcA ± 0.9 4.3bB ± 1.1 1cB ± 0.2
24:0 pulp 99.5aA ± 30.9 11.3bAB ± 2.4 5.9bB ± 1.3 5.4bC ± 0.9 6.2bBC ± 0.8 31.7bA ± 4.1 3.7bB ± 0.4
seed 6.6bB ± 0.3 − − 18.1aA ± 2.7 15.2aA ± 1.1 20.2aB ± 2.8 15.9aA ± 3.6
raw peel ND 11.5bAB ± 1.1 12.8bA ± 1.1 15.1aAB ± 0.05 6.9cBC ± 0.2 7.5cC ± 1 7.3cB ± 0.7
oven dried peel ND 13.8bA ± 2.6 12.1bcA ± 0.7 12.9bB ± 0.8 8.5cB ± 1.9 18.4aB ± 1 12bcA ± 0.7
freeze dried peel 4.9cB ± 0.5 8.5bB ± 1.3 11.9aA ± 0.4 6.4bcC ± 0.5 5.1cC ± 0.7 5.6cC ± 1.7 5.4cB ± 0.7
16:1n-9 pulp 384.aA ± 105.8 1.2bA ± 0.5 20.6bB ± 3.1 100.7bA ± 16.4 20.2bB ± 3.1 4.2bB ± 0.7 8.63bB ± 0.3
seed 18.4cB ± 0.2 − − 88.3aA ± 20.7 58.5bA ± 6.7 13.9cA ± 1.7 12.4cA ± 1.6
raw peel 71.abB ± 59.5 3.2cA ± 2.1 2.64B ± 0.9 94.5aA ± 4.1 2.9cC ± 0.4 3.3cB ± 0.6 8.9bcB ± 1.1
oven dried peel 97.6aB ± 84.5 1.4bA ± 0.4 3.7bB ± 0.2 66.1abA ± 7.9 2.5bC ± 0.7 3.8bB ± 0.5 2.6bC ± 0.8
freeze dried peel 37.5bB ± 10.5 1.5cA ± 0.1 3.3cB ± 0.1 65.8aA ± 12.4 8.5cC ± 2.3 2.4cB ± 0.6 8.3cB ± 1.5
18:1n-9 pulp 3667.7aA ± 1006.6 142.3bA ± 25.8 26.5bC ± 1.3 70.1bB ± 11.3 59.4bB ± 11 625.2bB ± 97.5 20bB ± 2
seed 262.7bB ± 11.2 − − 12620aA ± 3276.7 4229.4bA ± 65.6 3282.6bA ± 329.8 2222.5bA ± 276.6
raw peel 822.7aB ± 309.3 85.3bB ± 14.8 43.1bBC ± 6.8 105.1bB ± 2.9 27.4bB ± 3.5 31.8bC ± 6.1 109.4bB ± 10.6
oven dried peel 1192.8aB ± 599.4 65.7bB ± 17.5 88.2bA ± 22.3 82.0bB ± 14.6 18.8bB ± 2.4 58.8bC ± 14.7 54.4bB ± 15.7
freeze dried peel 417.7aB ± 25.8 57.7bcB ± 6.5 57.3bcB ± 2.2 94.4bB ± 5.8 60.4bcB ± 16.6 23.4cC ± 6.1 85.9bB ± 15.9
18:1n-7 pulp 332.2aA ± 91.18 3.7bA ± 0.5 39.9bA ±9.1 22.6bB ± 2.1 70bB ± 7.2 18.2bB ± 3.6 13.7bB ± 1.5
seed 22cB ± 1.07 − − 221.4aA ± 49 158.6abA ± 3.6 119.5bA ± 14.8 106.2bA ± 13.7
raw peel 86.8aB ± 37.12 4.9bA ± 0.8 9.9bB ± 2.1 26.3bB ± 1.8 6.1bC ± 0.6 4.7bB ± 0.9 12.1bB ± 1.2
oven dried peel 114.1aB ± 55.88 4.1bA ± 0.9 14.6bB ± 1.4 19.5bB ± 1.1 6bC ± 2 5.2bB ± 1.3 4.3bB ± 2
Fatty acid Fruit part Composition / (mg per 100 g DB)
Avocado Pineapple Banana Papaya Passion fruit Watermelon Melon
20:1n-9 pulp 29.5aA ± 8.11 5.4bA ± 2 0.8bB ± 0.07 0.7bB ± 0.05 0.8bC ± 0.1 4.2bB ± 0.6 0.6bC ± 0.1
seed 2.3cB ± 0.01 − − 74.1aA ± 19.8 29.9bA ± 0.9 20.5bcA ± 5.3 15.4bcA ± 1.9
raw peel 5.5aB± 2.40 0.2bB ± 0.03 0.4bC ± 0.1 0.2bB ± 0.07 2.4bB ± 0.3 1bB ± 0.2 5.6aB ± 0.5
oven dried peel 6.4aB ± 1.22 2.4bB ± 0.9 0.3cC ± 0.02 0.2cB ± 0.04 1.5bcBC ± 0.1 6.8aB ± 0.3 1.5bcC ± 0.03
freeze dried peel 3.5aB ± 0.55 2bB ± 0.2 1.1bcA ± 0.06 1.2bcB ± 0.1 2.1bBC ± 0.6 0.8cB ± 0.2 4.3aB ± 0.8
18:2n-6 pulp 1963.1aA ± 538.91 61.4bB ± 10.2 145.2bC ± 24.8 24.7bB ± 6.1 131.9bB ± 6.5 530.5bB ± 117.2 110.2bB ± 27
seed 699cB ± 29.95 − − 946.6cA ± 132.9 15949.8aA ± 652.4 13140.9aA ± 2337.6 7978.3bA ± 1056.6
raw peel 466.4aB ± 59.23 159.6cdA ± 14.5 291.6bB ± 58.4 144.8cdB ± 31.6 139.3dB ± 9.6 251.9bcB ± 50.5 248.4bcdB ± 24.1
oven dried peel 613.6aB ± 155.68 172cA ± 31.9 427.9bA ± 26.1 111.9cB ± 7.9 112.9cB ± 8.4 194.9cB ± 55.7 121.8cB ± 31.4
freeze dried peel 310.5aB ± 8.10 123.9bcA ± 14.1 335.6aB ± 8.3 105.8cB ± 5.2 135.7bcB ± 36 185bB ± 46.6 180.2bB ± 21.4
18:3n-3 pulp 189.2aA ± 52.02 90.1bcB ± 26.3 186.4aB ± 18.8 146.3abcD ± 6.7 172.9abA ± 40.4 218.2aA ± 28.3 85.2cC ± 17.8
seed 57.5bC ± 2.56 − − 56.7bE ± 9.9 122.7aA ± 4.2 41.1bB ± 8.7 114.9aC ± 14.9
raw peel 113.2cdBC ± 26.36 130.8cAB ± 25 185.3bcB ± 23.9 295.5aA ± 10.5 53.4dB ± 3.3 250.5abA ± 51.7 247.3abA ± 23.9
oven dried peel 131.6bAB ± 17.85 162.3abA ± 35.1 218.1aAB ± 12 212.4abC ± 20.3 42.1cB ± 2.9 185.7abA ± 56.7 142.3abBC ± 28.8
freeze dried peel 76.6cdBC ± 2.45 108.1cAB ± 13.1 242.3aA ± 4.1 248.1aB ± 14.3 45.9dB ± 12.3 183.6bA ± 45.2 178bB ± 19.9
20:2n-6 pulp 7.6abA ± 2.35 2.6cA ± 0.4 2.7cB ± 0.3 6.7bB ± 1.3 6.7bB ± 1.56 10.5aB ± 1.5 4.9bcC ± 0.2
seed 4.4cA ± 0.28 − − 44.2aA ± 8.9 15.4bcA ± 1.2 17.6bA ± 2.2 9.1bcB ± 1.2
raw peel 4.2bcA ± 2.06 2.8cdA ± 0.9 0.3dC ± 0.1 1.3cdB ± 0.5 0.5dCD ± 0.05 6.9bBC ± 1.1 16.3aA ± 1.6
oven dried peel 6.3aA ± 2.33 0.4bB ± 0.2 0.3bC ± 0.06 1.2bB ± 0.1 0.3bD ± 0.03 0.9bD ± 0.3 1.9bD ± 0.1
freeze dried peel 3.4cA ± 0.28 2.9cA ± 0.3 7.9bA ± 0.07 9.4abB ± 0.6 2.9cC ± 0.8 5.1cC ± 1.5 11.9aB ± 1.4
22:6n-3 pulp 42.4aA ± 13.18 5.8bA ± 1.2 8.9bB ± 2.7 34.5aA ± 12.3 7.1bB ± 1.3 6.9bA ± 1.5 0.4bB ± 0.06
seed 36.3aA ± 1.96 − − 3.5dB ± 0.8 9.2cA ± 0.2 6.1cdA ± 0.8 15.6bA ± 3.2
raw peel ND 2.1cB ± 0.2 4.3aC ± 0.8 3.9abB ± 0.6 2.7bcC ± 0.1 2.5cB ± 0.1 3.9abB ± 0.4
oven dried peel ND 2.1cB ± 0.3 4.2aC ± 0.5 3.5abB ± 0.1 2.9bC ± 0.1 1.1dB ± 0.2 1.7cdB ± 0.07
freeze dried peel 6.3bB ± 0.4 6bA ± 0.3 18.3aA ± 1.8 5.3bcB ± 0.3 4.5bcdC ± 0.7 2.3dB ± 0.4 3.2cdB ± 0.7
Results are expressed as mean ± standard deviation of nine replicates; means followed by different uppercase letters in the same column are significantly different by Tukey test at 5% probability; means followed by different lowercase letters in the same line are significantly different by Tukey test at 5% probability; (−) fruit does not have this part; ND = not detected.
Table 3. Fatty acid composition in pulp, seed, raw peel, oven dried peel, freeze dried peel of avocado (Persea americana), pineapple (Ananas comosus), banana (Musa sp.), papaya (Carica papaya), passion fruit (Passiflora edulis), watermelon (Citrullus lanatus) and melon (Cucumis melo) in mg of fatty acid per 100 g of fruit part in dried basis (mg per 100 g DB) (cont.)
Another important PUFA, the docosahexaenoic acid (DHA, 22:6n-3), which is important in the formation, development, and function of brain and retina,15,28 was
found in most samples.
Villa-Rodríguez et al.29 reported lower values of 14:0,
16:0, 18:0, 16:1, 18:1, 18:2 and 18:3 FA compared to Table 3 values in avocado pulps of different varieties. Villaverde et al.30 reported similar values of 14:0, 16:0,
18:0, 20:0, 22:0, 24:0, 16:1, 18:1, 18:2 and 18:3 FA compared to values obtained in this work in banana freeze dryer peel. Malacrida et al.31 evaluated lipid profile of
papaya seeds and reported that 18:1n-9 (71.30%), 16:0 (16.16%), 18:2n-6 (6.06%) and 18:0 (4.73%) were the major FA similar to the results shown by Table 3. Malacrida and Jorge32 and Lopes et al.16 evaluated lipid profile of
passion fruit seed and reported that linoleic and oleic FA were the major FA, similar to the results obtained in this work. Jarret and Levy24 evaluated FA profile of different
varieties of watermelon seed and reported that the major FA
were: 16:0 (range of 10.6 to 11.15%), 18:0 (range of 8.05 to 10.1%), 18:1 (range of 12.88 to 16.42%) and 18:2 (range of 63.37 to 65.17%), similar to results shown by Table 3.
Table 4 shows the sum of n-6, n-3, saturated fatty acid (SFA), MUFA, and PUFA in addition to the omega-6: omega-3 (n-6:n-3) and PUFA:SFA ratios. In relation to the sum of n-3 FA, passion fruit parts presented the highest values. The n-6:n-3 ratio was higher than 16:1 (Table 4) in the seeds of papaya, passion fruit, watermelon, and melon. According to Martin et al.,33 an n-6:n-3 ratio value higher
than 10:1 is not good, since healthy diets present values between 1:1 and 10:1.
Avocado pulp and papaya, passion fruit, watermelon, and melon seeds presented higher sums of SFA, MUFA, and PUFA than other parts of these fruits (Table 4). The PUFA:SFA ratio in samples varied from 0.3 ± 0.0 to 3.9 ± 0.2. Martin et al.33 recommended that PUFA:SFA
In general, the freeze drying and oven drying processes did not differ in relation to FA composition and did not affect the amounts of individual SFA and MUFA or the sums of n-6, SFA, MUFA, and PUFA in most fruits.
The drying processes decreased the values of the PUFAs 18:3n-3, 20:2n-6, and 22:6n-3 individually and reduced the value of the sum of n-3 FA for some fruit. After processing the peels, the values of PUFA:SFA increased for most fruits.
Table 4. Sum and ratio of fatty acid composition in pulp, seed, raw peel, oven dried peel, freeze dried peel of avocado (Persea americana), pineapple (Ananas comosus), banana (Musa sp.), papaya (Carica papaya), passion fruit (Passiflora edulis), watermelon (Citrullus lanatus) and melon (Cucumis melo) in mg of fatty acid per 100 g of fruit part in dried basis (mg per 100 g DB)
Sum and
ratio Fruit part
Composition / (mg per 100 g DB)
Avocado Pineapple Banana Papaya Passion fruit Watermelon Melon
n-6
pulp 1970.7aA ± 541.1 64bB ± 10.5 147.8bC ± 25.1 31.5bB ± 7.4 138.7bB ± 6.7 540.9bB ± 118.5 115.1bB ± 27
seed 703.4cB ± 30.2 − − 990.9cA ± 141.9 15965.2aA ± 651.3 13158.5aA ± 2339.7 7987.4bA ± 1057.8
raw peel 470.5aB ± 61.3 162.5cdA ± 13.9 291.9bB ± 58.5 146.1dB ± 32.1 8.6eB ± 0.9 258.8bcdB ± 51.5 264.7bcB ± 25.7
oven dried peel 619.9aB ± 157.9 173.1cA ± 32.6 428.2bA ± 26 113.1cB ± 7.7 113.2cB ± 8.4 195.8cB ± 56.1 123.7cB ± 31.5
freeze dried peel 313.9aB ± 8.4 126.8bcA ± 14.4 343.4aAB ± 8.4 115.2cB ± 5.6 138.7bcB ± 36.9 190.2bB ± 48.2 192bB ± 22.8
n-3
pulp 231.6aA ± 64.3 96bA ± 27.5 195.3aB ± 21.1 173.4abC ± 15.3 180.1abA ± 41.7 225.1aA ± 29.1 85.5bC ± 17.8
seed 93.8bB ± 4.5 − − 60.2cD ± 10.6 131.8aA ± 4.2 47.2cB ± 9.5 128.6aBC ± 18
raw peel 113.2cB ± 26.4 132.9cA ± 25.3 189.6bcB ± 24.7 299.4aA ± 9.8 141.9cA ± 9.5 253.2abA ± 51.9 251.3abA ± 24.3
oven dried peel 131.6bB ± 17.8 164.4abA ± 35.3 222.3aAB ± 11.9 215.9aB ± 20.2 44.9cB ± 2.9 186.8abA ± 56.9 144abBC ± 28.9
freeze dried peel 82.9cdB ± 2.9 114.2cA ± 13.3 260.6aA ± 5.9 253.4aB ± 14.6 50.5dB ± 13 185.9bA ± 45.6 181.2bB ± 20.6
n-6/n-3
pulp 8.5aA ± 0.2 0.7dB ± 0.1 0.7cdD ± 0.07 0.2dB ± 0.06 0.8cdB ± 0.1 2.4bB ± 0.5 1.3cB ± 0.04
seed 7.5dAB ± 0.04 − − 16.5dA ± 0.6 121.2bA ± 7.9 279.5aA ± 7.3 62.2cA ± 0.63
raw peel 4.4aC ± 1.4 1.2bA ± 0.2 1.5bB ± 0.1 0.5bB ± 0.1 0.06bB ± 0 1bB ± 0 1bB ± 0
oven dried peel 4.9aBC ± 1.7 1.1bcAB ± 0.1 1.9bcA ± 0.02 0.5cB ± 0.09 2.5bB ± 0.02 1bcB ± 0.02 0.8bcB ± 0.05
freeze dried peel 3.8aC ± 0.03 1.1dA ±0 1.3cC ± 0 0.4fB ± 0.02 2.7bB ± 0.02 1eB ± 0.01 1.1eB ± 0.01
AGS
pulp 2993.2aA ± 822.7 158.7bB ± 30.2 275.3bB ± 40.2 256.7bB ± 17.6 197.8bB ± 19.9 638.1bB ± 102.7 139.4bB ± 26.9
seed 311.6cB ± 16.2 − − 4224.4aA ± 1152.7 4126.2aA ± 80.4 4609.5aA ± 743.3 2138.9bA ± 299.1
raw peel 616.3aB ± 157.1 239.5cdA ± 18.7 491.2abA ± 72 399.9bcB ± 9.8 165.1dB ± 10.4 304.6bcdB ± 54.1 324.6bcdB ± 31.6
oven dried peel 817.5aB ± 250.6 230.2bcAB ± 41.9 504.7bA ± 61.3 302.6bcB ± 30.5 105.2cB ± 7.9 280.3bcB ± 59.6 190.9cB ± 43.4
freeze dried peel 437.1aB ± 27.8 177.8cdAB ± 19.6 428.5aA ± 19.7 316.5bB ± 15.6 144.7dB ± 38.7 225.6bcdB ± 61.9 240.9bcB ± 33.4
AGMI
pulp 4413.4aA ± 1211.6 152.7bA ± 25.4 87.8bAB ± 13.1 194.1bB ± 2.9 151.5bB ± 18.9 651.8bB ± 98.5 43bB ± 2.4
seed 305.5cB ± 12.4 − − 13003.7aA ± 3366.3 4476.4bA ± 71 3436.6bcA ± 347.7 2356.6bcA ± 293.8
raw peel 986.2aB ± 404.4 94bB ± 18.2 56.2bB ± 9.6 226.2bB ± 1 41.4bC ± 4.9 40.9bC ± 7.9 1368bB ± 12.2
oven dried peel 1410.8aB ± 720.4 73.2bB ± 20.1 106.8bA ± 23.7 167.3bB ± 23.7 28.8bC ± 5.1 74.7bC ± 16.7 62.8bB ± 18.5
freeze dried peel 504.7aB ± 39.9 64.8cdB ± 7.2 73.8cdAB ± 2.9 182.3bB ± 11.9 78.5cdBC ± 21.7 30.1dC ± 7.8 107.9cB ± 19.9
AGPI
pulp 2202.3aA ± 605.1 160bB ± 35.5 343.1bC ± 44.7 204.9bC ± 7.9 318.8bB ± 44.1 766bB ± 135.4 200.7bB ± 44.8
seed 797.2cB ± 34.7 − − 1051.2cA ± 152.6 16097.1aA ± 648.7 13205.7aA ± 2349.2 8115.9bA ± 1075.8
raw peel 583.8aB ± 44.6 295.4bcA ± 33.2 481.4aB ± 83.1 445.5abB ± 22.3 150.5cB ± 10.4 512.1aB ± 103.5 515.9aB ± 49.9
oven dried peel 751.6aB ± 144.1 337.5bcA ± 65.1 650.5aA ± 37.8 329bcBC ± 12.4 158.2cB ± 11.4 382.6bB ± 113.1 267.7bcB ± 60.4
freeze dried peel 396.8bB ± 11.2 240.9cAB ± 27.7 604.1aAB ± 14.3 368.6bBC ± 19.4 189.2cB ± 49.9 376.1bB ± 93.8 373.3bB ± 43.4
AGPI/AGS
pulp 0.7eB ± 0 1dC ± 0.04 1.2cB ± 0.03 0.8eB ± 0.02 1.6aB ± 0.09 1.2cC ± 0.03 1.4bC ± 0.04
seed 2.6cA ± 0.02 − − 0.25dC ± 0.03 3.9aA ± 0.2 2.9bA ± 0.06 3.8aA ± 0.04
raw peel 0.9cB ± 0.16 1.2bB ± 0.08 0.9cC ± 0.05 1.1bcA ± 0.08 0.9cD ± 0.01 1.7aB ± 0.1 1.6aB ± 0.00
oven dried peel 0.9cB ± 0.1 1.5aA ± 0.05 1.3abAB ± 0.1 1bcA ± 0.07 1.5aBC ± 0 1.3aC ± 0.1 1.4aC ± 0.00
freeze dried peel 0.9fB ± 0.03 1.3cdAB ± 0.01 1.4cA ± 0.03 1.2eA ± 0.01 1.3dC ± 0 1.7aB ± 0.04 1.5bB ± 0.04
Additionally, fruits peels and seeds evaluated are excellent sources of bioactive compounds, therefore it is recommended more studies to evaluate these samples antinutritional and toxic factors, which are considered nutritionally undesirable, before add this as food ingredient (Ayala-Zavala et al.).34 It is also important
to emphasize the need of future studies on the minerals bioaccessibility.
Conclusions
The proximate composition, mineral contents and fatty acids composition of the evaluated fruit parts (peel, pulp and seeds) are different. Peel and seeds of fruits have higher amounts of evaluated nutrients than their pulps. The findings of this study highlight the potential of all parts of papaya, watermelon and passion fruit, and, melon pulp, melon seed and banana peel as a valuable source of nutrients such as essential minerals and fatty acids. Both drying technologies are adequate for reducing the perishability of peels and industry losses, because they do not decrease peel nutrients. This study data also contribute to the knowledge of Brazilian cultivated fruit composition.
Acknowledgments
The authors thank CNPq for the financial support.
References
1. Guo, C.; Yang, J.; Wei, J.; Li, Y.; Xu, J.; Jiang Y.; Nutr. Res.
2003, 23, 1719.
2. Hossain, M. A.; Rahman, S. M. M.; Food Res. Int. 2011, 44, 672.
3. Ribeiro, A. B.; Bonafé, E. G.; Silva, B. C.; Montanher, P. F.; Santos Jr., O. S.; Boeing, J. S.; Visentainer, J. V.; J. Braz. Chem. Soc. 2013, 24, 797.
4. Morais, D. R.; Rotta, E. M.; Sargi, S. C.; Schimidt, E. M.; Bonafé, E. G.; Eberlin, M. N.; Sawaya, A. C. H. F.; Visentainer, J. V.; Food Res. Int. 2015, 77, 392.
5. Moo-Huchin, V. M.; Moo-Huchin, M. I.; Estrada-León, R. J.; Cuevas-Glory, L.; Estrada-Mota, I. A.; Ortez-Vázquez, E.; Betancur-Ancona, D.; Sauri-Duch, E.; Food Chem. 2015, 166, 17.
6. Santos, L. P.; Morais, D. R.; Souza, N. E.; Cottica, S. M.; Boroski, M.; Visentainer, J. V.; J. Food Res. 2011, 44, 1414. 7. Neri-Numa, I. A.; Carvalho-Silva, L. B.; Morales, J. P.; Malta,
L. G.; Muramoto, M. T.; Ferreira, J. E. M.; de Carvalho, J. E.; Ruiz, A. L. T. G.; Junior, M. R. M.; Pastore, G. M.; Food Res. Int. 2013, 50, 70.
8. Berto, A.; Silva, A. F.; Visentainer, J. V.; Matsushita, M.; Souza, N. E.; Food Res. Int. 2015, 77, 441.
9. Association of Official Analytical Chemists International (AOAC); Official Methods of Analysis of AOAC International, 16th ed.; Cunniff, P. A., ed.; Association of Official Analytical Chemists: Arlington, Washington, USA, CD-Rom, 1998. 10. Instituto Adolfo Lutz; Métodos Químicos e Físicos para Análise
de Alimentos, 5ª ed.; Instituto Adolfo Lutz: São Paulo, Brasil,
2008, p. 641.
11. Bligh, E. G.; Dyer, W. J.; Can. J. Biochem. Physiol. 1959, 37, 911.
12. Joseph, J. D.; Ackman, R. G.; J. AOACInt.1992, 75, 488. 13. Visentainer, J. V.; Quim. Nova2012, 35, 274.
14. Núcleo de Estudos e Pesquisas em Alimentação (NEPA)
Unicamp; Tabela Brasileira de Composição de Alimentos
(TACO), 2a ed.; NEPA-Unicamp: Campinas, 2006, http://www.
unicamp.br/nepa/taco/contar/taco_versao2.pdf, accessed in May 2016.
15. Mooz, E. D.; Gaino, N. M.; Shimano, M. Y. H.; Amancio, R. D.; Spoto, M. H. F.; Ciênc. Tecnol. Aliment. 2012, 32, 274. 16. Lopes, R. M.; Sevilha, A. C.; Faleiro, F. G.; Silva, D. B.; Vieira, R.
F.; Agostini-Costa, T. S.; Rev. Bras. Fruticultura2010, 32, 498. 17. Tripathi, S.; Suzuki, J. Y.; Carr, J. B.; McQuate, G. T.; Ferreira, S. A.; Manshardt, R. M.; Pitz, K. Y.; Wall, M. M.; Gonsalves, D. J.; J.Food Compos. Anal. 2011, 24, 140.
18. Celestino, S. M. C.; Princípios de Secagem de Alimentos; Embrapa: Planaltina, Brasil, 2010.
19. Guimarães, R. R.; Freitas, M. C. J.; Silva, V. L. M.; Ciênc. Tecnol. Aliment. 2010, 30, 354.
20. El-Adawy, T. A.; Taha, K. M.; Food Chem. 2001, 74, 47. 21. Pereda, J. A. O.; Tecnologia de Alimentos, Componentes dos
Alimentos e Processos, Vol. 1; Artmed: Porto Alegre, Brasil,
2005.
22. Almeida, V. V.; Canesin, E. A.; Suzuki, R. M.; Palioto, G. F.;
Quim. Nova Esc. 2012, 35, 34.
23. Roesler, R.; Catharino, R. R.; Malta, L. G.; Eberlin, M. N.; Pastore, G. M.; Food Chem. 2008, 110, 711.
24. Jarret, R. L.; Levy, I. J.; J. Agric. Food Chem. 2012, 60, 5199. 25. Emaga, T. H.; Robert, C.; Ronkart, S. N.; Wathelet, B.; Paquot,
M.; Bioresour. Technol. 2008, 99, 4346.
26. USA National Institute of Health, available at https://ods. od.nih.gov/Health_Information/Dietary_Reference_Intakes. aspx, accessed in June 2016.
27. Coimbra, M. C.; Jorge, N.; J. Sci. Food Agric. 2012, 92, 679. 28. Kolanowski, W.; Int. J. Food Prop. 2010, 13, 498.
29. Villa-Rodríguez, J. A.; Molina-Corral, F. J.; Ayala-Zavala, J. F.; Olivas, G. I.; González-Aguilar, G. A.; Food Res. Int. 2011,
44, 1231.
30. Villaverde, J. J.; Oliveira, L.; Vilela, C.; Domingues, R. M.; Freitas, N.; Cordeiro, N.; Freire, C. S. R.; Silvestre, A. J. D.;
31. Malacrida, C. R.; Kimura, M.; Jorge, N.; Ciênc. Tecnol. Aliment.
2011, 31, 2.
32. Malacrida, C. R.; Jorge, N.; Braz. Arch. Biol. Technol. 2012,
55, 127.
33. Martin, C. A.; Almeida, V. V.; Ruiz, M. R.; Visentainer, J. E. L.; Matshushita, M.; Souza, N. E.; Visentainer, J. V.; Rev. Nutr.
2006, 19, 761.
34. Ayala-Zavala, J. F.; Vega-Vega, V.; Rosas-Dominguez, C.; Palafox-Carlos, H.; Villa-Rodriguez, J. A.; Siddiqui, M. W.; Dávila-Aviña, J. E.; González-Aguilar, G. A.; Food Res. Int.
2011, 44, 1886.
Submitted: February 22, 2016