SUMMARY
Objective: To evaluate the efects of the progressive increase in body weight on lung function by oxygen peripheral saturation, spirometry and maximal respiratory pressures in diferent degrees of obesity. Methods: Cross-sectional study including 140 patients in clinical and surgical evaluation for obesity treatment. he selected patients were divided into six groups of body mass index (BMI), including a control group of non-obese and a subdivision for the morbidly obese into three subgroups. Results: Signiicant diferences were demonstrated between the groups regarding oxygen peripheral saturation (SpO2) (p ≤ 0.001), forced vital capacity (FVC) (p ≤ 0.002, p ≤ 0.02) and forced expiratory vol-ume in one second (FEV1) (p ≤ 0.001, p ≤ 0.03) in relative and absolute values, respec-tively. Group VI (BMI ≥ 50.9 kg/m²) showed signiicant diferences (SpO2, FVC and FEV1) when compared with the other groups (except group V) and group V (BMI ≥ 45 to 49.9 kg/m²) with the group control. he other variables (FEV1/FVC ratio, forced ex-piratory low 25-75 [FEF25-75] and maximal resex-piratory pressure) did not show any sta-tistical diferences. Conclusion: Lung function is inluenced by the progressive increase in BMI, with changes in lung function better demonstrated when BMI ≥ 45 kg/m²; these changes are more evident when BMI > 50.9 kg/m².
Keywords: Spirometry; respiratory function tests; obesity; morbid obesity; cross-sec-tional studies; body mass index.
Study conducted at Universidade Federal de Sergipe, Hospital Universitário, Aracaju, SE, Brazil
Submitted on: 12/14/2010
Approved on: 07/28/2011
Correspondence to:
Saulo Maia D’Ávila Melo Rua José Olívio do Nascimento, 82 Edifício Parque da Sementeira Apto. 201 Jardins - Aracaju- SE CEP: 49025-730 Phone: 55 (79) 9971 3316 55 (79) 3214 3593 Phone/Fax: 55 (79) 3214-3491 [email protected]
Conlict of interest: None.
©2011 Elsevier Editora Ltda. All rights reserved
Effects of progressive increase in body weight on lung function in six
groups of body mass index
SAULO MAIA D’ÁVILA MELO1, VALDINALDO ARAGÃODE MELO2, RAIMUNDO SOTERODE MENEZES FILHO3, FÁBIO ALMEIDA SANTOS4 1 PhD in Health Sciences, Universidade Federal de Sergipe (UFS); Physician, UFS, Aracaju, SE, Brazil
2 PhD; Adjunct Professor, Department de Medicine, UFS, Aracaju, SE, Brazil
INTRODUCTION
he alarming worldwide increase in the prevalence of obe-sity has been a concern to the World Health Organization (WHO), being one of the most serious public health prob-lems in recent years, with threatening projections for the 21st century1.
In Brazil, similar to developed countries, the preva-lence of obesity has shown a signiicant increase in all age groups, especially in the female sex2. Obesity prevention and control have been a priority for the WHO due to the fact that obesity is a systemic disease associated with vari-ous comorbidities, being an important independent risk factor for chronic diseases (cardiovascular diseases, dia-betes, musculoskeletal disorders and some cancers), with high risk of premature death1,3.
Obesity promotes deterioration of respiratory mechan-ics by decreasing the chest expansibility due to the increase in adipose tissue in the chest wall and abdominal cavity. hat increases and impairs diaphragmatic mobility, caus-ing decrease in lung compliance and chest wall, resultcaus-ing in decreased pulmonary volumes and inspiratory muscle overload. he decrease in lung ventilation may lead to pe-ripheral lung occlusion, ventilation-perfusion abnormali-ties and arterial hypoxemia3-6.
he worsening in lung function in obese patients is associated with increased morbidity and mortality, simi-lar to other diseases such as cancer, cardiovascusimi-lar and chronic respiratory diseases and heart attack3,4; however, very oten the inluence of obesity on respiratory disor-ders goes unrecognized3-6.
Lung function tests are essential for the management of patients with respiratory disorders, as well as those with potential to develop them, providing objective data on lung function and determining their correlation with the patient’s clinical complaints7,8.
Spirometry is the most frequent and useful lung func-tion test carried out in clinical practice9. he peripheral oxygen saturation (SpO2) performed by pulse oximetry is a noninvasive, safe, practical and inexpensive method. It is a sensitive indicator of abnormal gas exchange and can be used as a screening test for arterial gasometry8,10.
he respiratory muscle strength assessment through maximal respiratory pressure measurement has been in-corporated into clinical practice. he MIP (maximum inspiratory pressure) is an index of diaphragm strength, while the MEP (maximal expiratory pressure) measures the strength of the abdominal and intercostal muscles6,11,12.
Previous studies of pulmonary function in obese patients are limited to assessing functional changes in three obese classes, considering the morbidly obese (BMI ≥ 40 kg/m²) as a single group, according to the WHO classiication by BMI (body mass index): under-weight ≤ 18.5 kg/m²; normal from 18.5 to 24.9 kg/m²; overweight: 25 to 29.9 kg/m²; obesity grade I: 30 to
34.9 kg/m²; obesity grade II : 35 to 39.9 kg/m² and obesity grade III ≥ 40 kg/m²)13-15.
he aim of this study was to evaluate the efects of the progressive increase in body weight on lung function by spirometry, SpO2, MIP and MEP in diferent degrees of obesity. he group of morbidly obese patients has been subdivided into three subgroups to better demonstrate the efect of the progressive increase in BMI on the respiratory functional variables studied.
METHODS
his is a cross-sectional study carried out at the Outpa-tient Clinic of Universidade Federal de Sergipe (UFS), in the city of Aracaju, Sergipe. Data were collected between January and December 2007. he study was approved by the Ethics Committee in Research of the UFS (CAAE-0050.0.107.000-07) and a signed free and informed con-sent form was obtained from all patients.
he sample was selected among patients undergoing clinical and surgical evaluation for the treatment of obesity in the obesity outpatient clinics of Hospital São Lucas and UFS, where the clinical assessment and lung function tests were conducted by an assistant pneumologist. We selected a control group of 26 healthy subjects with no respiratory symptoms, who had normal lung function according to the criteria of the Brazilian Guidelines for Lung Func-tion Test16, consisting of volunteers (family members and friends of patients, healthcare professionals).
he 140 selected individuals were divided into six groups according to BMI level: Group I: 26 (normal weight and overweight) with BMI: 18.5 to 29.9 kg/m2; Group II: 18 individuals (class I obesity) with BMI 30 to 34,9 kg/m2; Group III: 24 subjects (class II obesity) with BMI 35 to 39.9 kg/m2; Group IV: 30 patients (class III obesity) with BMI 40 to 44.9 kg/m2; Group V: 23 individuals (class III obesity) with BMI 45 to 50.9 kg/m2; Group VI: 19 indi-viduals (class III obesity) with BMI ≥ 51 kg/m2.
Patients aged 18 years and older were included. All pa-tients from the obese group under evaluation for surgical treatment of obesity (groups III to VI) had previously tried at least three clinical treatments, experiencing failure and frustration. hey were compensated from the clinical point of view with diet and/or drugs and had been approved to undergo the surgical treatment of obesity.
he exclusion criteria were used for patients with acute or chronic pulmonary disease, unable to perform the lung function tests, those with neuromuscular disease, heart fail-ure, severe or poorly controlled hypertension, chronic kid-ney disease, severe systemic disease, systemic corticosteroid use, decompensated diabetesmellitus, current smokers or former smokers who had smoked more than 10 packs/year.
hose who had never smoked were considered non-smokers and ex-non-smokers those who had stopped smok-ing for at least six months and had smoked less than 10 packs/year. Active smokers were those who consumed tobacco products at any amount at the time of the study or over the last six months.
Regarding physical activity, individuals were consid-ered non-sedentary when they performed regular physical activity at least three times a week, with a minimum dura-tion of 30 minutes. Sedentary were considered those who did not perform any physical activity or did so for shorter periods of time.
Body weight was measured with the individual wear-ing light clothes and no shoes and height was obtained us-ing an anthropometer attached to the scale that met the criteria for measuring weight of morbidly obese patients. BMI was calculated as weight in kilograms divided by height in meters squared.
Ater the patient had been sitting at rest for at least ten minutes, SpO2 was measured using a Medical Onyx II 9500 portable digital oximeter (Nonin, Plymouth, Minne-apolis, USA) in one of the ingers, without enamel, ater a waiting period of at least two minutes until the reading. hen, with the patient in the sitting position and using a nose clip, lung function tests were sequentially performed: MIP, MEP and spirometry.
he MIP was measured from the residual volume and MEP from total lung capacity, with a minimum of ive maneuvers being performed for each of them and using the highest value. he reference equation for the maximal respiratory pressures was expressed as a percentage of normality for the Brazilian population, according to the equation by Neder et al.17; for spirometry, the equation of references by Hankinson18 was used, with the maneuvers being performed in accordance with current recommen-dations by the SBPT16. During the spirometric test, forced expiratory maneuver was performed at least three times, ater which the best one was chosen.
Spirometry was performed using a computerized spi-rometer (model Microlab-3500) and maximal respiratory pressures using a digital Micro Respiratory Pressure Meter manovacuometer (Micro RPM), both from Micro Medical Ltd., Kent, UK.
he variables analyzed were sex, age, ethnicity, height, smoking status, BMI, physical activity level, SpO2, MIP, MEP (cmH2O), FVC, FEV1, FEF25-75, FEV1/FVC ratio, in absolute and relative values.
Statistical analysis was performed using the Statistical Package for Social Sciences, release 13 (SPSS Inc., Chicago, IL, USA). Continuous variables were described as mean and standard deviation and categorical variables were summarized by means of simple and relative frequencies, and the Chi-square or Fisher’s exact test was used as ap-propriate. he comparison between the diferent BMI
cat-egories was performed using one-way ANOVA followed by Tukey’s post-test and calculation of 95% CI. Two-tailed tests were used and the level of statistical signiicance was set at p < 0.05.
RESULTS
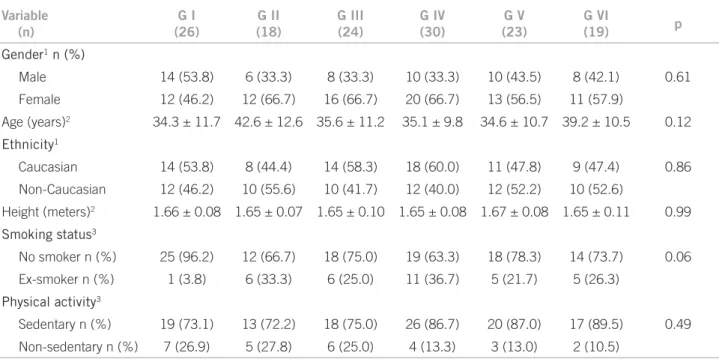
A total of 140 patients with a mean age of 36.4 ± 11.2 years was evaluated, ranging from 18 to 63 years, of which 84 (60.0%) were females. Regarding ethnicity, 74 (52.9%) were Caucasians. he mean BMI was 39.91 ± 10.57 kg/m² (range 19.3 to 65.6 kg/m²), with a signiicant diference between the groups (p < 0.001). he groups had a homo-geneous distribution regarding sex, age, ethnicity, height, smoking status and physical activity (Table 1).
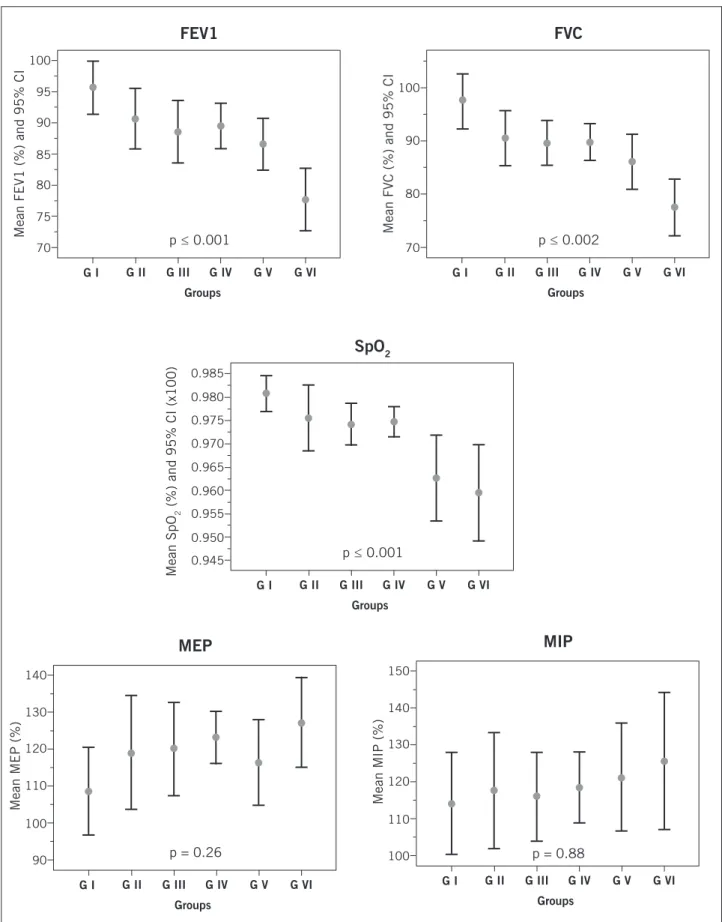
Table 2 compares the spirometric variables, maximal respiratory pressures and oxygen saturation in the six groups. he mean SpO2 was 97.18 ± 1.6%, ranging from 89% to 100%, with a signiicant diference between the groups (p ≤ 0.001).
Group VI showed lower SpO2 with signiicant dif-ferences with the other groups (group I: p ≤ 0.006 and 95% CI: 0.9 to 3.4, group II: p ≤ 0.01 and 95% CI: 0.2 to 3.0; group III: p ≤ 0.02 and 95% CI: 0.2 to 2.8), except for group V, which showed lower SpO2, with signiicant difer-ences with groups I (p ≤ 0.004 and 95% CI: 0.6 to 3.0) and IV (p ≤ 0.003 and 95% CI: 0.03 to 2.4). Group IV showed a homogeneous distribution with groups I, II and III (Ta-ble 2, Figure 1).
he mean FVC was 3.72 ± 0.87 liters in absolute val-ues, ranging from 1.74 to 5.97 liters and in relative valval-ues, 88.97 ± 0.12%, ranging from 48% to 119%. As for FEV1, the mean absolute value was 3.03 ± 0.72 L, ranging from 1.34 to 5.36 L and the relative value was 88.55 ± 11.41%, ranging from 51% to 119%.
he groups showed statistical diferences regarding the mean FVC in absolute and relative values (p ≤ 0.02, p ≤ 0.002, respectively), with a progressive reduction in FVC between the groups. Regarding absolute values of FVC, only Group I was superior to Group VI (p ≤ 0.008 and 95% CI: 0.15 to 1.63). As for relative values of FVC, Group VI was statistically lower than the groups: I (p ≤ 0.001 and 95% CI: 10.4 to 29.4), Group II (p ≤ 0.006 and 95% CI: 2.6 to 23.3), Group III (p ≤ 0.006 and 95% CI: 2.4 to 21.7) and Group IV (p ≤ 0.003 and 95% CI: 3.0 to 21.4). Group V was statistically lower than Group I (p ≤ 0.005 and 95% CI: 2.3 to 20.4) (Table 2, Figure 1).
II (p ≤ 0.03 and 95% CI: 3.1 to 22, 8), III (p ≤ 0.01 and 95% CI: 1.7 to 20.1) and IV (p ≤ 0.002 and 95% CI: 3.0 to 20.6). Group V was statistically lower than Group I (p ≤ 0.03 and 95% CI: 0.52 to 17.6) (Table 2, Figure 1).
With respect to maximal respiratory pressures, the mean MIP in absolute values was 105.79 ± 27.10 cmH2O, ranging from 50 to 196 cmH2O and as for relative values, a mean of 118.37 ± 31.41% was demonstrated, ranging from 53.02% to 218.51%. he MEP showed a mean value of 129.15 ± 32.97 cmH2O for absolute values , ranging from 60 to 254 cmH2O and for relative values, a mean of
118.82 ± 26.94% was demonstrated, ranging from 58.72% to 209.57%.
he groups had a homogeneous distribution regard-ing FEV1/FVC ratio, FEF25-75, MEP and MIP (abso-lute and relative values), with no signiicant diferences (Table 2).
DISCUSSION
Previous studies evaluating lung function in obesity have generally considered the morbidly obese as a single group and only assessed lung function alterations in two
Table 1 – Distribution of demographic characteristics, physical activity and smoking status, stratiied by BMI
Variable (n)
G I (26)
G II (18)
G III (24)
G IV (30)
G V (23)
G VI
(19) p
Gender1 n (%)
Male 14 (53.8) 6 (33.3) 8 (33.3) 10 (33.3) 10 (43.5) 8 (42.1) 0.61
Female 12 (46.2) 12 (66.7) 16 (66.7) 20 (66.7) 13 (56.5) 11 (57.9)
Age (years)2 34.3 ± 11.7 42.6 ± 12.6 35.6 ± 11.2 35.1 ± 9.8 34.6 ± 10.7 39.2 ± 10.5 0.12
Ethnicity1
Caucasian 14 (53.8) 8 (44.4) 14 (58.3) 18 (60.0) 11 (47.8) 9 (47.4) 0.86
Non-Caucasian 12 (46.2) 10 (55.6) 10 (41.7) 12 (40.0) 12 (52.2) 10 (52.6)
Height (meters)2 1.66 ± 0.08 1.65 ± 0.07 1.65 ± 0.10 1.65 ± 0.08 1.67 ± 0.08 1.65 ± 0.11 0.99
Smoking status3
No smoker n (%) 25 (96.2) 12 (66.7) 18 (75.0) 19 (63.3) 18 (78.3) 14 (73.7) 0.06
Ex-smoker n (%) 1 (3.8) 6 (33.3) 6 (25.0) 11 (36.7) 5 (21.7) 5 (26.3)
Physical activity3
Sedentary n (%) 19 (73.1) 13 (72.2) 18 (75.0) 26 (86.7) 20 (87.0) 17 (89.5) 0.49
Non-sedentary n (%) 7 (26.9) 5 (27.8) 6 (25.0) 4 (13.3) 3 (13.0) 2 (10.5)
BMI, body mass index; values expressed in means ± SD. Pearson’s chi-square test1. One-way ANOVA test, Tukey’s test2. Fisher’s exact test3.
Variable (n)
G I (26)
G II (18)
G III (24)
G IV (30)
G V (23)
G VI
(19) p
FEV1, L FEV1 %
3.39 ± 0.72 95.7 ± 10.5
2.88 ± 0.43 90.6 ± 9.7
3.02 ± 0.78 88.5 ± 11.8
3.05 ± 0.67 89.5 ± 9.8
3.06 ± 0.69 86.5 ± 9.5
2.67 ± 0.76 77.6 ± 10.4
0.03 0.001
FVC, L FVC %
4.18 ± 0.86 97.4 ± 12.5
3.56 ± 0.57 90.5 ± 10.4
3.72 ± 0.85 89.5 ± 9.9
3.73 ± 0.81 89.7 ± 9.2
3.70 ± 0.90 86.1 ± 11.7
3.20 ± 0.99 77.5 ± 11.1
0.02 0.002
FEV1/FVC % 81.1 ± 5.8 81.2 ± 6.6 80.9 ± 4.3 82.0 ± 4.9 83.1 ± 5.3 81.7 ± 5.0 0.72
FEF25-75, L/s FEF 25 / 75 %
3.60 ± 1.22 97.4 ± 23.4
3.57 ± 1.32 107.9 ± 32.9
3.29 ± 1.20 92.2 ± 22.0
3.47 ± 0.94 98.6 ± 22.7
3.61 ± 0.95 100.2 ± 22.2
3.02 ± 0.88 88.8 ± 21.8
0.45 0.21
MEP 126.5 ± 39.3 120.2 ± 27.6 127.4 ± 32.4 131.1 ± 21.5 131.5 ± 41.8 137.6 ± 33.8 0.70
MEP % 108.6 ± 29.4 119.1 ± 30.8 120.0 ± 29.9 123.1 ± 19.0 116.4 ± 26.8 127.2 ± 25.2 0.26
MIP 102.4 ± 27.4 98.6 ± 19.6 105.1 ± 26.3 107.9 ± 23.8 109.4 ± 29.8 110.5 ± 35.6 0.73
MIP % 114.0 ± 34.1 117.4 ± 31.5 115.7 ± 28.5 118.4 ± 25.6 121.0 ± 33.7 125.4 ± 38.5 0.88
SpO2 98.1 ± 0.9 97.6 ± 1.4 97.4 ± 1.1 97.5 ± 0.9 96.3 ± 2.1 95.9 ± 2.1 0.001
Figure 1 – Distribution of mean values and 95% CI of SpO2, FEV1, FVC, MEP, MIP in relative values, between the groups,
in the sample.
SpO2, peripheral oxygen saturation; FEV1, forced expiratory volume in one second; FVC, forced vital capacity; MEP, maximum
expiratory pressure; MIP, maximum inspiratory pressure.
Groups
SpO 2
p ≤ 0.001
Mean SpO
2
(%) and 95% CI (x100)
0.945
G I G II G III G IV G V G VI
0.950 0.955 0.960 0.965 0.970 0.975 0.980 0.985
FEV1
p ≤ 0.001
Mean FEV1 (%) and 95% CI
70
G I G II G III Groups
G IV G V G VI
75 80 85 90 95 100
MEP
p = 0.26
Mean MEP (%)
90
G I G II G III Groups
G IV G V G VI
100 110 120 130 140
MIP
p = 0.88
Mean MIP (%)
100
G I G II G III Groups
G IV G V G VI
110 120 130 140 150
FVC
p ≤ 0.002
Mean FVC (%) and 95% CI
70
G I G II G III Groups
G IV G V G VI
or three classes of obesity, without respiratory functional evaluation over all classes of obese individuals6,13-15,19-21.
In this study, we aimed at demonstrating pulmonary function impairment secondary to the progressive increase in body weight in six BMI groups. We kept the WHO clas-siication of obesity until the BMI ≤ 40 kg/m2; however, to diferentiate our study from those previously reported, we established a control group of non-obese individuals and subdivided the group of morbidly obese patients into three subgroups, thus being able to observe the progressive im-pairment of respiratory function as BMI rises.
Our results demonstrated an inverse relationship be-tween BMI and the respiratory functional variables stud-ied, with a modest efect on lung function up to a BMI ≤ 45 kg/m², noting that Group IV (BMI 40 to 44.9 kg/m²) presented characteristics of respiratory function more similar to Groups II and III (obesity grade I and II) than the morbidly obese Groups V and VI (BMI ≥ 45 kg/m²).
Signiicant alterations in lung function were observed only when the BMI exceeded 45 kg/m², increasing when the BMI reached values above 50.9 kg/m², characterizing the group of morbidly obese patients as a heterogeneous group in terms of respiratory function, justifying its subdi-vision into subgroups for the assessment of lung function. hese alterations difer from previous studies, which re-ported minimal changes in respiratory function up to the BMI ≤ 40 kg/m²; however, in these studies, the group of morbidly obese patients has always been considered as a single group (BMI ≥ 40 kg/m2)3,6,19,22.
In recent years, there has been a marked increase in the number of obese patients undergoing surgical treat-ment of obesity. he good performance of inspiratory and expiratory muscles in the postoperative period of these pa-tients is essential for the cough relex and an adequate and efective tracheobronchial cleaning, contributing to good pulmonary oxygenation and ventilation2,23,24.
here are controversies in the literature on the efect of obesity on maximal respiratory pressures6,11,12. Some stud-ies state that the maximal respiratory pressures are usually normal in healthy individuals, in several degrees of obe-sity and particularly in morbidly obese individuals in the sitting position6,11,25. he reason is that obese individuals compensate for the respiratory load by doubling the re-spiratory efort and diaphragmatic pressure, increasing the contribution of the rib cage in the respiratory movement, by performing rapid and shallow breaths11.
With an opposing view, Poulain et al.26 reported that respiratory muscle strength may be impaired in obesity, with reduced maximal inspiratory pressure in the obese when compared with the non-obese control group, as a consequence of reduced chest wall compliance or lower lung volumes or both.
he results of the present study showed normal maxi-mal respiratory pressures, with an upward trend as the
BMI increases, although with a homogeneous distribution in the studied groups.
One limitation of a cross-sectional study such as this one is the lack of observation over time, not allowing de-termining prognostic considerations on the various sub-groups of obese individuals.
CONCLUSION
In conclusion, lung function is inluenced by the progres-sive increase in BMI, with changes in lung function being better demonstrated when BMI ≥ 45 kg/m²; these changes in lung function are more evident when BMI > 50.9 kg/m².
REFERENCES
1. World Health Organization. Obesity and overweight. Geneva: World Health Organization; Updated 2009. [cited 2009 May 17]. Available at: http://www.who.int/mediacentre/factsheets/fs311/en/index.html . 2. Ministério da Saúde. Obesidade. Brasília (DF); 2010. [cited 30
Sep 2010]. Available at: http://portal.saude.gov.br/portal/apli-cacoes/reportagensEspeciais/default.cfm?pg=dspDetalhes&id_ area=124&CO_NOTICIA=10078.
3. McClean KM, Kee F, Young IS, Elborn JS. Obesity and the lung: 1. Epidemiology. horax 2008;63:649-54.
4. Canoy D, Luben R, Welch A, Bingham S, Wareham N, Day N et al. Abdominal obesity and respiratory function in men and wom-en in the EPIC-Norfolk study, United Kingdom. Am J Epidemiol 2004;159:1140-9.
5. Kaw R, Aboussouan L, Auckley D, Bae C, Gugliotti D, Grant P et al. Challenges in pulmonary risk assessment and perioperative man-agement in bariatric surgery patients. Obes Surg 2008;18:134-8. 6. Koenig SM. Pulmonary complications of obesity. Am J Med Sci
2001;321:249-79.
7. Enright PL, Adams AB, Boyle PJ, Sherrill DL. Spirometry and max-imal respiratory pressure references from healthy Minnesota 65- to 85- year old women and men. Chest 1995;108:663-9.
8. Evans SE, Scanlon PD. Current practice in pulmonary function testing. Mayo Clin Proc 2003;78:758-63.
9. European Respiratory Society. he year of the Lung, 2010. [cited 2010 Apr 25]. Switzerland: World Spirometry Day; 2010. Available from: http://www.yearothelung.org/.
10. American horacic Society/American College of Chest Physicians. ATS/ACCP statement on cardiopulmonary exercise testing. Am J Respir Crit Care Med 2003;167:211-77.
11. Laghi F, Tobin MJ. Disorders of the respiratory muscles. Am J Resp Crit Care Med 2003;168:10-48.
12. Enright PL, Kronmal RA, Manolio TA, Schenker MB, Hyatt RE. Respiratory muscle strength in the elderly. Correlates and reference values.Cardiovascular Health Study Research Group. Am J Respir Crit Care Med 1994;149:430-8.
13. Snow V, Barry P, Fitterman N, Qaseem A, Weiss K. Pharmacologic and surgical management of obesity in primary care: a clinical practice guideline from the American College of Physicians. Ann Intern Med 2005;142:525-31.
14. Teixeira CA, Santos JE, Silva G A, Souza EST, Martinez JAB. Pre-valência de dispnéia e possíveis mecanismos isiopatológicos en-volvidos em indivíduos com obesidade graus 2 e 3. J Bras Pneumol 2007;331:28-35.
15 Yanovski SZ, Yanovski JA. Obesity. N Engl Med 2002;346:591-602. 16. Sociedade Brasileira de Pneumologia e Tisiologia. Diretrizes para
testes de função pulmonar. J Bras Pneumol 2002;28(Supl 3):2-238. 17. Neder JA, Andreoni S, Lerario MC, Nery LE. Reference values for
lung function tests. Maximal respiratory pressures and voluntary ventilation. Braz J Med Biol Res1999;32:719-727.
19. Sahebjami H. Dyspnea in obese heathy men. Chest 1998;114:1373-7. 20. Rasslan Z, Saad Jr. R, Stirbulov R, Fabbri RMA, Lima CAC. Avalia-ção da funAvalia-ção pulmonar na obesidade graus I e II. J Bras Pneumol 2004;30:508-514.
21. Domingos-Benício NC, Gastaldi AC, Perecin JC, Avena KM, Gui-marães RC, Sologuren MJJ et al. Medidas espirométricas em pes-soas eutróicas e obesas nas posições ortostática, sentada e deitada. Rev Assoc Med Bras 2004;50:142-7 .
22. Ochs-Balcom HM, Grant BJ, Muti P, Sempos CT, Freudenheim JL, Trevisan M et al. Pulmonary function and abdominal adiposity in the general population. Chest 2006;129:853-62.
23. Costa TH, Lima TP, Gontijo PL, Carvalho HA, Cardoso FPF, Faria
OP et al. Correlação da força muscular respiratória com variáveis
antropométricas de mulheres eutróicas e obesas. Rev Assoc Med Bras 2010;56:403-8.
24. Puglia CR. Indicações para o tratamento operatório da obesidade mórbida. Rev Assoc Med Bras 2004;50:118-18 .
25. Sahebjami H, Gartside PS. Pulmonary function in obese subjects with a normal FEV1/FVC ratio. Chest 1996;110:1425-9.