THE MOMENTUM EFFECT EXEMPLIFIES THE
INFLUENCE OF INVESTORS’ IRATIONAL BEHAVIOUR
ON CHANGING PRICES OF SHARES AND STOCKS:
AN ANALYSIS OF THE MOMENTUM EFFECT ON THE
WARSAW STOCK EXCHANGE
Paweł Merło1
, Patryk konarzewski
2Abstract
JEL classiicaion: G02,G11, G14
Keywords: capital market, investments, stock exchange, behavioural inances, investors’ irraional acions, the momentum efect
An eicient market should show no anomalies that could lead to achieving extraordinary gains when using the stock exchange data, especially historic data (Samuelson, 1965). However, studies across the world indicate that such anomalies are rather widespread (Agrawal, Tandon, 1994; Balaban, 1994; Keong, Yat, 2010; Laif et al., 2011; Choudhry, 2000).
The literature dedicated to this subject disinguishes ive categories which - according to the classical inance theories - do not relect correctly prices of stocks and shares. These are (Szyszka, 2003):
1) ime anomaly,
2) anomalies connected with the speciic nature of companies,
3) anomalies connected with a delayed response of investors to new informaion,
4) overreacion of the market, 5) the momentum strategy.
Time anomalies, which belong to the irst group, are the basic category of anomalies. They are characterized by the dependence which appears in the irst weeks of the year. It has been veriied that unusually high gains are achievable in speciic moments of ime. The principal cause is said to be taxaion, namely a tendency to sell stocks in late December and resume investment in the new year. Another theory claims that the approach to pricing among professional investors changes at the end of a year, which is most probably due to paying more atenion to the next year’s forecasts (Haugen, Lakonishok, 1988).
Buczek demonstrated the presence of the January efect at the Stock Exchange in Warsaw in 1994-1995 and in 1999-2004 (Buczek, 2005). In the former period, certain forms of anomalies were noiced, but an insuicient amount of data did not allow the researcher to demonstrate any staisical signiicances. In the later ime period, the rate of return in the early months of each year was on average 6.2%, falling to 0.8% in the later months. Addiionally, another period of above average returns on investment was December, which may have been caused by the growing awareness of the January efect among investors, who tried to buy stocks ‘awaiing the January efect’. Thus, it is possible to claim that the Polish stock exchange experiences a December-January efect.
The second type of anomaly menioned arises from speciic characterisics of companies. An example of this sort of anomaly is the efect of small companies, which was documented in 1981 by R. Banz (Banz, 1981), who noiced that stocks of small companies gained higher rates of return than large ones. The founders of the eicient markets theory, Fama and French, also pointed to the occurrence of such anomalies. This is paricularly important in view of the contradicion of the results with the CAMP model, broadly accepted by academic circles (Fama, French, 1992). Another example is the anomaly associated with the book to market value raio (known as the book-to-price B/P raio) or its reverse variant (the P/B raio). The book value is the shareholders’ input higher by the historic proits of the company but less by the dividends paid, whereas the market price relects past and future prospects of the company. When the market price is much higher than the book value, it means that investors consider a given company a prospecive one (companies with growth potenial). In turn, when the B/P raio is high, it means than its book value is high but the market price relaively low. Such companies are known as ‘companies with value potenial’. Companies with a high B/P raio enable one to obtain above average rates of return compared to companies with a low B/P raio. This regularity has been widely examined on the American market, giving rise to numerous controversies, mainly by being inexplicable with the aid of the beta coeicient (Capaul, Rowley, Sharpe, 1993).
The third group of anomalies are the ones connected with a delayed response of investors to new informaion. This category embraces numerous and diverse reacions on behalf of investors observed over many years all across the world, including on the Warsaw Stock Exchange. An example could be an excessively slow response to changing inancial results. It has been determined that despite the fact that investors observe atenively the inancial posiion of a company, when new informaion appears (be it even crucial), its inluence on prices may be considerably ime shited. It is esimated that more or less three months elapse before new informaion is incorporated within the price of the company’s shares. The reason is most probably an excessively conservaive aitude of investors to companies (Bernard, Thomas, 1989).
A similar development takes place when details on the level of a dividend emerge. Studies on the American
stock exchange market have shown that assets of companies which begin to pay dividends generate above average proits in three consecuive years. In contrast, once they cease to pay dividends, they achieve smaller beneits in the following three years (Michaely, Thaler, Womack, 1995). On the Warsaw Stock Exchange, this anomaly began to emerge ater 2004; prior to that year, probably because of the insuicient knowledge of inance among investors, dividends had not had any essenial efect on prices of stocks (Buczek, 2005).
The market’s overreacion is an anomaly exempliied by the loser-winner efect. It means that using only historic data it is possible to atain above average proits. This strategy has been detected in many countries around the world. Studies on the Polish market have shown that the loser-winner efect was absent from the Warsaw Stock Exchange in 1995-2003. This may have been a result of the then highly volaile economic situaion in Poland in contrast to European or American markets (Buczek, 2005).
The last group of anomalies is the momentum strategy/efect. This strategy consists of buying stocks with the highest return rate in the last n-months and selling ones which had the lowest rate of return in the same period (De Bondt, Thaler, 1985; Johnson, 2002; Kelsey, Kozhan, Pang, 2011; Lehmann, 1990, Rouwenhorst, 1999). The occurrence of this efect is atributed to an insuicient response of investors to the informaion about given companies. As a result, prices are not adjusted immediately and it is possible to obtain above average return rates from invesing in winners’ stocks and short selling losers’ stocks. Studies carried out on this subject in 2001-2004 by Buczek (2005) and in 2003-2010 by Wójtowicz (2011) demonstrated the existence of the momentum efect during the analyzed ime periods on the Warsaw Stock Exchange.
The objecive of this study has been to idenify and possibly assess the power, nature and determinants of the momentum efect on the Warsaw Stock Exchange. The following hypotheses were assumed:
H1: The momentum efect occurs at the Warsaw Stock Exchange;
H2: The momentum efect is the strongest in short ime periods when a porfolio is being formed;
H3: The power of the momentum efect at the Warsaw Stock Exchange is variable;
H4: The changing efeciveness of strategies based on the momentum efect at the Stock Exchange in Warsaw is caused by other factors apart from the changing economic situaion;
H5: The momentum efect at the Warsaw Stock Exchange is inluenced by the January efect.
The subject of this research was the luctuaion of prices noted on the Warsaw Stock Exchange. The analysis used data originaing from 2000 to 2013. The results of coninuous trading according to closing prices on the 15th day of each month were submited to the analysis. Whenever it was impossible to form ten complete porfolios due to the lack of data, a given ime period was excluded from the study. Only companies which paricipated in coninuous trading while a porfolio was being formed were analyzed. The unit value of a stock was over 5 PLN, which was done in order to eliminate distorion of results by junk companies and companies with litle liquidity. Another group of irms excluded from the research consisted of the ones in which a change in the stock exchange price while creaing and holding a porfolio exceeded 200%. The reason was to eliminate the companies which had been an object of extreme speculaion, as they could also distort the analyical results.
In order to detect the occurrence of the momentum efect on the Warsaw Stock Exchange, porfolios of stocks and shares were made depending on how long it took to form a porfolio (K) and how long it was kept (J). The ime periods analyzed were 3, 6, 9 and 12 months for both factors. The creaion of a porfolio commenced at ime t0 and was repeated every month unil ime t0+K. In the ime
t0+K, the returns obtained during the porfolio formaion
period were calculated from the formula (1):
%
100
⋅
−
=
− − K t t K t xv
v
v
w
(1) where:wx – percent change in the value of an asset during
the porfolio formaion period,
vt-K – value of the asset during the ime period t-K,
vt – value of the asset at ime t.
the PUrPose anD working hyPotheses
resUlts anD DisCUssion
Next, the results obtained from the assets were divided into deciles, where companies with the highest returns were gathered in the decile D1, and those with the lowest returns were aggregated in the decile D10. This segregaion was carried out unil the period t+J, in which the results were averaged (2):
(2)
where,
πK,J,D – average returns of decile D in the analyzed period for strategy K/J,
wx,t,D – per cent change in asset x during ime t, assigned to decile D,
NK,J,D – number of assets in decile D for strategy K/J.
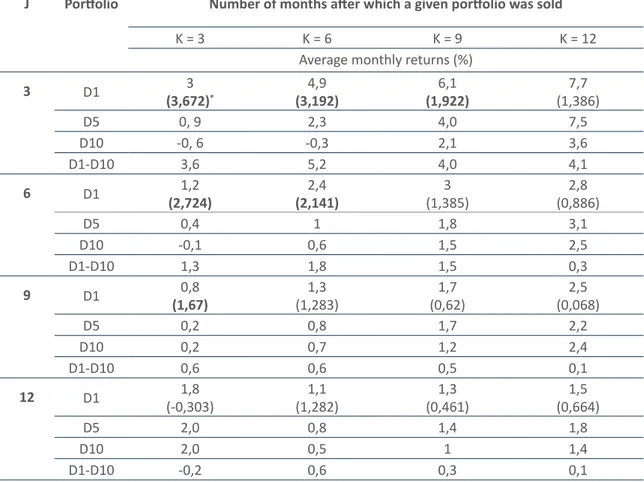
Table 1: Average monthly returns for individual momentum efect strategies
Source: Own studies based on performed research
D J K
D t x D
J K
N
w
, ,
, , ,
,
Σ
=
p
Data for 16 strategies, each of which contained averaged results for all ten deciles, were eventually obtained. Aterwards, staisical veriicaion was performed by tesing the signiicance of means.
The analysis comprised 939 assets of companies which were quoted on the stock exchange in 146 ime periods.
The observaions of the prices of assets on the Warsaw Stock Exchange enabled the author to detect some untypical changes, which are referred to as short-term momentum efect (Tab. 1).
J Porfolio Number of months ater which a given porfolio was sold
K = 3 K = 6 K = 9 K = 12
Average monthly returns (%)
3 D1 3
(3,672)*
4,9
(3,192)
6,1
(1,922)
7,7
(1,386)
D5 0, 9 2,3 4,0 7,5
D10 -0, 6 -0,3 2,1 3,6
D1-D10 3,6 5,2 4,0 4,1
6 D1 1,2
(2,724)
2,4
(2,141)
3
(1,385) (0,886)2,8
D5 0,4 1 1,8 3,1
D10 -0,1 0,6 1,5 2,5
D1-D10 1,3 1,8 1,5 0,3
9 D1 0,8
(1,67)
1,3
(1,283) (0,62)1,7 (0,068)2,5
D5 0,2 0,8 1,7 2,2
D10 0,2 0,7 1,2 2,4
D1-D10 0,6 0,6 0,5 0,1
12 D1 1,8
(-0,303) (1,282)1,1 (0,461)1,3 (0,664)1,5
D5 2,0 0,8 1,4 1,8
D10 2,0 0,5 1 1,4
D1-D10 -0,2 0,6 0,3 0,1
Column J shows the duraion of porfolio formaion ater which returns from individual stocks are juxtaposed relaive to the ime period, and stock porfolios are created based on this juxtaposiion. The value K stands for the number of months ater which a given porfolio is sold and the averaged value of these returns is set in a table. All the results were divided between the deciles, although – for the sake of simplicity – only the porfolios of ‘past winners’, i.e. the companies in D1decile, the 10% of companies which had demonstrated the highest returns, the past losers (D10 decile) and the D5 middle porfolio stocks were presented. In addiion, the D1-D10 column shows the average diference between returns from the extreme 1st and 10th deciles. For strategy D1, the result of t-Student test showing the staisical diference between the average values for D1 and D10 is given in brackets under the returns.
The results show that all the analyzed strategies except one (12/3; J = 12, K = 3) generated a higher proit for the past winners than past losers, but the diference was staisically signiicant in only six out of sixteen cases. Taking such responses of the market as evidenced in this research, it is impossible to speak about any eiciency of the market, even in its weakest form.
Despite the results, it was only in the case of short-term strategies that a signiicant diference between porfolios D1 and D10 appeared. This means that the momentum efect on the Polish stock exchange market is observable only in short periods of ime.
The analysis of the results achieved by the companiesrevealed that the momentum efect is the strongest under strategies 3/3, 3/6 and 6/3, 6/6. The highest inancial proits are generated by strategies 3/3 and 3/6, where the diference in the average return between the extreme porfolios is 0.036 and 0.052, respecively, which translates to an output over 3.6 and 5.2% higher per month.
The results show some diferences in the speciic
nature of the efect versus the American stock exchange market, examined by Jegadeesh and Titman, which may have been due to certain diferences between the applied methodologies. Undeniably, however, the momentum efect can be said to appear in a short ime horizon (Jegadeesh, Titman, 2001).
In order to verify the short-lasing presence of the momentum efect, its stability in ime was checked. It was therefore necessary to check whether the diferences in rates of return on stocks ater K ime period (months of creaing a porfolio) were not incidental, single price luctuaions. Unfortunately, due to a severe shortage of informaion, it was impossible to divide the data originaing from the years 2000-2003 into deciles. The reason was the lack of data about some of the companies, which prevented the formaion of ten complete porfolios.
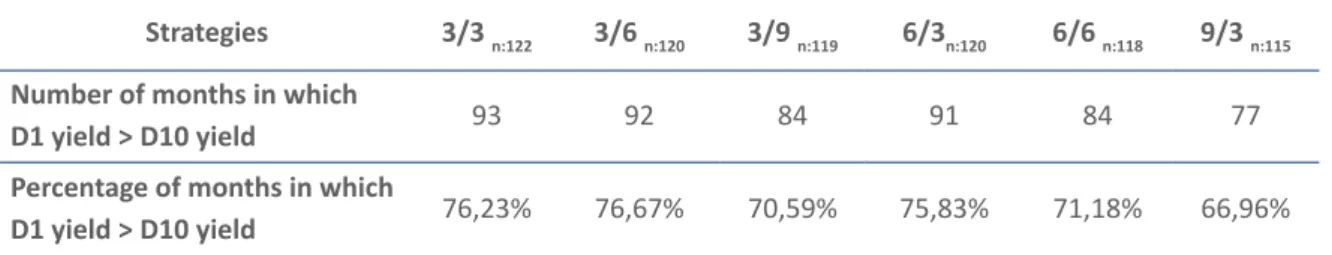
Within the 12 years covered by the research, the D1 porfolio yielded higher proits in all the three strategies than the porfolio of losers (D10). In all strategies except 9/3, the D1 yield to D10 yield raio was over 70% (Table 2).
It is important to underline that the momentum efect was present in all the years covered by the research and did not disappear in ime. Both porfolios were strongly correlated with each other in terms of the direcions of trends, although the Decile 1 porfolio was more sensiive to posiive growth simulants. At the end of 2003 two very big diferences in returns from both porfolios were notable, which stemmed from intense speculaive growths among groups of companies. However, these increases did not afect the staisical signiicance of diferences between the porfolios, inluencing only the proitability of strategies.
The winners’ porfolios, in each of the analyzed strategies, throughout most of the ime, generated higher monthly rates of return than the losers’ porfolios. The said raio ranged from 66.96% in strategy 9/3 to 76.67%
Table 2: Diferences in returns from porfolios in momentum efect strategies
Strategies 3/3 n:122 3/6 n:120 3/9 n:119 6/3n:120 6/6 n:118 9/3 n:115
Number of months in which
D1 yield > D10 yield 93 92 84 91 84 77
Percentage of months in which
D1 yield > D10 yield 76,23% 76,67% 70,59% 75,83% 71,18% 66,96%
Source: Own studies based on performed research
in strategy 3/6.
The results of our analysis imply that the momentum efect is not constant in ime. It is possible to noice such ime periods when rates of return on stocks in the winners’ porfolio are very high, but in other ime periods gains from porfolios based on the momentum efect are near zero or rates of return are negaive.
One of the factors that can have a strong efect on seasonality is the situaion on the stock exchange market.
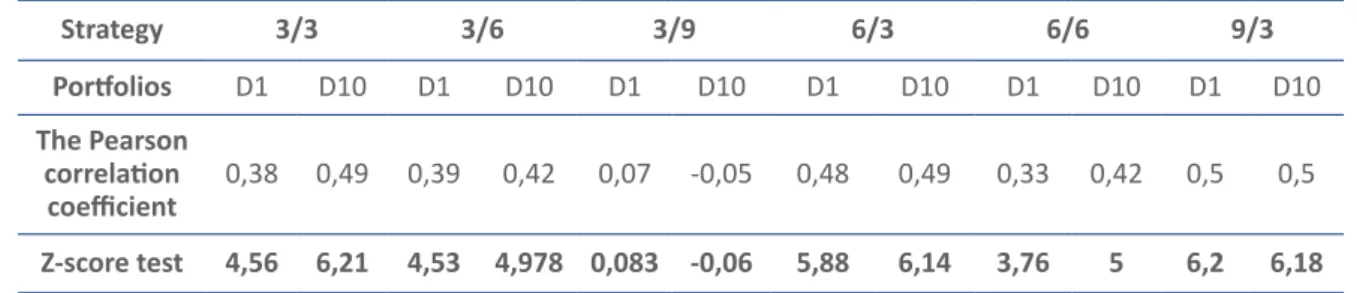
For all the strategies except strategy 3/9 the correlaion between the proits obtained from the porfolios and the situaion on the stock exchange (expressed as the luctuaions of the WIG index) was staisically signiicant. The study showed that there is a semi-strong correlaion, meaning that the situaion on the stock exchange has some efect on returns from the porfolios. However, there were more determinants. Especially wherever the strength of correlaion for two extreme porfolios is idenical, it is impossible to claim that the stock exchange current situaion is the factor that is responsible for the presence and changes in the strength of the momentum efect. Changes in the porfolios would be almost idenical and such strong luctuaions would not occur unless other factors were involved. In such a situaion it is impossible to explain discrepancies in a one-zloty investment in both porfolios. The diferences prove that the stock exchange situaion alone cannot jusify the momentum efect and there must be other factors which induce changes in the strength of the said efect. Should the stock exchange situaion be insuicient to explain these changes, then a behavioural factor needs to be considered. This would require quaniicaion of the efects of underesimaing and overreacing to new stock exchange informaion (posiive and negaive) by investors. Among such behavioural factors there is the January efect, indicated by Jegadeesh and Titman as having a strong impact on returns from porfolios during
Obviously, the momentum efect cannot be unafected by what happens at the stock exchange. It is vital to determine whether the untypical gains of the strategy based on the momentum efect are just a result of the higher increase in the value of companies with strong standing during an upward market trend. In the case of the Warsaw Stock Exchange, a study was carried out on the correlaion of changes in the WIG index relaive to changes in the rates of return from porfolios D1 and D10 (Table 3).
Table 3: The correlaion of porfolios with the situaion on the stock exchange
Strategy 3/3 3/6 3/9 6/3 6/6 9/3
Porfolios D1 D10 D1 D10 D1 D10 D1 D10 D1 D10 D1 D10
The Pearson correlaion
coeicient 0,38 0,49 0,39 0,42 0,07 -0,05 0,48 0,49 0,33 0,42 0,5 0,5 Z-score test 4,56 6,21 4,53 4,978 0,083 -0,06 5,88 6,14 3,76 5 6,2 6,18
the ime it occurred (Jegadeesh, Titman, 2001).
Addiionally, a more detailed study by Glaser and Weber (2003) enabled the researchers to observe an equally strong January efect on results of momentum strategies on the US market. Their invesigaions showed that because of a high overreacion of the market in January, momentum strategies during the formaion of a porfolio generated much higher returns than an average return during the remaining periods of ime (Glaser, Weber, 2003).
All staisically signiicant strategies showed a higher return rate in the early months of a year rather than later (Table 4).
The momentum effect is a subject thoroughly analyzed by researchers in countries around the world. More and more studies highlight its statistically significant influence on stock exchanges in many developed and developing economies, e.g. in the USA, South Korea, Canada, India and Germany. The current research has demonstrated that the momentum effect occurred also on the Warsaw Stock Exchange. An investment strategy based on its occurrence yielded positive investment results. Moreover, it has been shown that the momentum effect was stable in time. Similar results in a short-time period were achieved by Jegadeesh and Titman in studies carried out on the US stock market (Jegadeesh, Titman, 2001). Our study has shown that the winners’ portfolios surpassed the future losers’ portfolios in all the analyzed strategies except for strategy 12/3. However, the statistical analysis proved that only the differences in portfolios for strategies 3/3, 3/6, 3/9, 6/3, 6/6 and 9/3 could be considered significant. We may therefore speak about the presence of the momentum effect on the Polish capital market. These results overlap in the shortest time period with the results generated by investigations carried out in other countries, but there are divergences appearing in the long run. This may be due to the Polish stock market not yet being as developed as the American market.
ConClUsions
Source: Own studies based on performed research
Table 4: The average return rate in a month
Strategy The average return rate in a month (%) The diference between January and the rest of the year (%) January February – December
3/3 3,93 0,75 3,18
3/6 4,06 2,49 1,57
3/9 6,15 4,05 2,1
6/3 1,71 0,36 1,35
6/6 2,14 1,27 0,87
9/3 1,28 0,3 0,98
At the Warsaw Stock Exchange, particularly large differences between the extreme portfolios appeared for the strategies with a short portfolio building period. The biggest differences in return rates were determined for strategies 3/6 – 5.2%., 3/9 – 5%, and 3/3 – 3.6%. The other strategies did not show such significantly different results. This may have been attributed to the fact that the momentum effect on the Polish stock exchange has a more short-lasting character. Studies on the stability of the momentum effect over time showed that while directions of changes in return rates in the deciles 1 and 10 are concordant, there is some significant discrepancy. Over the analyzed period of time, differences between the two extreme deciles grew larger or smaller. Besides, the said differences were varied in particular strategies.
The simulation of a one-zloty investment showed that the past winners’ portfolio was superior to the losers’ portfolio. After 12 years, each zloty invested in the first decile generated 14.50 PLN while the investment in the tenth decile brought only 2.20 PLN. Profitability fluctuations followed the same direction, although the decile of winners was much more dynamic and responsive to impulses than the decile composed of losers.
of the momentum efect. This becomes paricularly evident when the values of the Pearson’s coeicient for either of the porfolios are nearly idenical.
Likewise, the January efect did not have a decisive inluence on the results produced by the porfolios, although all of the analyzed strategies showed higher rates of return while being afected by the January efect than during the rest of the year. This diference was the biggest for the shortest 3/3 strategy, followed by the 3/9 strategy. For the former strategy, the diference between January and the remaining months was 3.18%, while for the 3/9 strategy, the said diference reached 2.1%. The other strategies showed an average diference between
January and the rest of the year around 1.19%. These results are not strong enough to afect the overall results of the strategies.
The analysis of overreacions and underreacions on behalf of investors provides the ground for a saisfactory explanaion of the examined phenomenon. The fact that there are passive and acive investors on the stock exchange who integrate informaion at a diferent rate means that values of stocks are revalued over a longer period of ime. Theoreically, therefore, the momentum efect is a result of integraing informaion by investors who take advantage of the fundamental analysis.
Agrawal, A., Tandon K. (1994). Anomalies or Illusions? Evidence from Stock Markets in Eighteen Countries. Journal of
Internaional Money and Finance 13, no. 1: 83-106.
Balaban, E. (1994). Day of The week efects: New Evidence from Emerging Stock Market, The Central Bank of The
Republic of Turkey. Discussion Paper no. 9410, November 1994.
Banz, R.W. (1981). The Relaionship between Return and Market Value of Common Stocks. Journal of Financial Economics 9, no. 1: 3-18.
Bernard, V., Thomas, J. (1989.) Post-earnings-announcement Drit: Delayed Price Response or Risk Premium. Journal of
Accouning Research 27: 1-36.
Buczek, S. (2005). Efektywność informacyjna rynków akcji. Teoria, a rzeczywistość. Warszawa: Wydawnictwo SGH. Capaul, C., Rowley, I., Sharpe, W. (1993). Internaional Value and Growth Stock Returns. Financial Analysts Journal 49, no. 1: 27-36.
Choudhry, T. (2000). Day of the Week Efect in Emerging Asian Stock Markets: Evidence from the GARCH Model.
Applied Financial Economics 10, no. 3: 235-242.
De Bondt, W., Thaler, R. (1985). Does the Stock Market Overreact? Journal of Finance 40, no. 3: 793-805.
Fama, E.F., French, K.R. (1992). The Cross-Secion of Expected Stock Returns. Journal of Finance 47, no. 2: 427-465. Glaser, M., Weber, M. (2003). Momentum and Turnover: Evidence from the German Stock Market. Schmalenbach
Business Review 55, no. 2: 108-135.
Haugen, R.A., Lakonishok, J. (1988). The Incredible January Efect: The Stock Market’s Unsolved Mystery. Dow Jones-Irwin.
Jegadeesh, N. (1990). Evidence of Predictable Behavior of Security Returns. Journal of Finance 45, no. 3: 881-898. Jegadeesh, N., Titman, S. (1993). Returns to Buying Winners and Selling Losers: Implicaions for Stock Market Eiciency. Journal of Finance 48, no. 1: 65-91.
Jegadeesh, N., Titman, S. (2001). Proitability of Momentum Strategies: an Evaluaion of Alternaive Explanaions. The Journal of Finance 5,6 no. 2: 699–720.
Johnson, T.C. (2002). Raional Momentum Efects. The Journal of Finance 57, no. 2: 585-608.
Keim, D., Stambaugh, R. (1984). A Further Invesigaion of the Weekend Efect in Stock Returns. Journal of Finance 39: 819-35.
Kelsey, D., Kozhan, R., Pang, W. (2011). Asymmetric Momentum Efects Under Uncertainty. Review of Finance 15, no. 3: 603-631.
Keong, L.B., Yat, D.N.C., Ling, C.H. (2010). Month-of-the-year efects in Asian Countries: A 20-year Study (1990-2009).
African Journal of Business Management 4, no. 7: 1351-1362.
Lakanishok, J., Levi, M. (1982). Weekend Efects in Stock Returns: A Note. Journal of Finance 37: 883-89.
Laif, M., Arshad, S., Faima, M., Farooq, S. (2011). Market Eiciency, Market Anomalies, Causes, Evidences, and Some Behavioral Aspects of Market Anomalies. Research Journal of Finance and Accouning 2, no. 9/10: 1-13.
Lehmann, B. (1990). Fads, Maringales and Market Eiciency. Quarterly Journal of Economics 105, no. 1: 1-28. Mehdian S, Perry M. (2001). The Reversal of the Monday Efect: New Evidence from US Equity Markets. Journal of
Business Finance & Accouning 28, no. 7/8, 1043-1065.
Michaely, R., Thaler, R.H., Womack, K.L. (1995). Price Reacions to Dividend Iniiaions and Omissions: Overreacion or Drit? The Journal of Finance 50, no. 2: 573–608.
Richardson, S., Tuna, I., Wysocki, P. (2010). Accouning Anomalies and Fundamental Analysis: A Review of Recent Research Advances. Journal of Accouning and Economics, 50, no. 2/3: 410-454.
Rouwenhorst, G. (1999). European Equity Markets and the EMU. Financial Analysis Journal 55, no. 3, 57-64. Samuelson, P. (1965). Proof that Properly Anicipated Prices Fluctuate Randomly. Industrial Management Review 6: 41-49.
Szyszka, A. (2003). Efektywność Giełdy Papierów Wartościowych w Warszawie na tle rynków dojrzałych. Poznań: Akademia Ekonomiczna w Poznaniu.
Szyszka, A. (2006). Zjawisko kontynuacji stóp zwrotu na Giełdzie Papierów Wartościowych w Warszawie. Bank i Kredyt
8: 37-49.