Article
Printed in Brazil - ©2016 Sociedade Brasileira de Química0103 - 5053 $6.00+0.00*e-mail: [email protected]
Solid Phase Extraction to On-Line Preconcentrate Trace Cadmium Using
Chemically Modified Nano-Carbon Black with 3-Mercaptopropyltrimethoxysilane
Caroline D. Zappielo,a Daniel M. Nanicuacua,a Walter N. L. dos Santos,b Daniel L. F. da Silva,b Luiz H. Dall’Antônia,a Fernanda M. de Oliveira,a Débora N. Clausena and
César R. T. Tarley*,a,c
aDepartamento de Química, Universidade Estadual de Londrina, 86051-990 Londrina-PR, Brazil
bDepartamento de Ciências Exatas e da Terra, Universidade do Estado da Bahia, Campus I,
41195-001 Salvador-BA, Brazil
cInstituto Nacional de Ciência e Tecnologia (INCT) em Bioanalítica, Departamento de Química
Analítica, Instituto de Química, Universidade Estadual de Campinas (UNICAMP), 13083-970 Campinas-SP, Brazil
Carbon black (CB) grafted with 3-mercaptopropyltrimethoxysilane (3-MPTMS) was used as solid phase extractor for Cd2+ in a flow injection system coupled to flame atomic absorption
spectrometry (FAAS). The influence of pH, buffer concentration, preconcentration flow rate and eluent concentration on preconcentration of Cd2+ were investigated by means of chemometric tools.
The characterization of the adsorbent chemically modified was performed by Fourier transform infrared, scanning electron microscopy, energy dispersive X-ray spectroscopy, thermogravimetric analysis, Raman spectroscopy and textural analysis. To perform the on-line preconcentration, 20.0 mL of a pH 7.0 Cd2+ solution at a flow rate of 4.0 mL min−1 was loaded through 30.0 mg of
modified CB and then eluted with 1.0 mol L−1 HCl toward the FAAS instrument. The limits of
detection and quantification were found to be 0.20 and 0.66 µg L−1, respectively. Addition and
recovery tests carried out in real samples (mineral, tap and saline waters, and cigarette sample) and the analysis of certified reference material (TORT-2, lobster hepatopancreas reference) attested the applicability of proposed method.
Keywords: nano-carbonaceous material, silanization, Cd2+, atomic absorption spectrometry
Introduction
Cadmium is a toxic metal found in low concentrations in the three environmental compartments, air, water and soils. However, due to increase of human activity, industrial and agricultural, its level has been increasingly elevated mainly in soil, surface water and plants.1 The
major sources of cadmium in drinking water are corrosion of galvanized pipes, erosion of natural deposits, discharge from metal refineries, runoff from waste batteries and paints.2 Through the food chain, cadmium is transferred
from environment into animals and human beings. The maximum levels recognized for potable water by national guidelines is 5.0 µg L−1, established by the United States
Environmental Protection Agency (US EPA)3 and Brazilian
Health Surveillance Agency (ANVISA).4 Some people who
drinks water containing cadmium above the maximum contaminant level for many years could experience kidney damage.5 Tobacco is also an important source of cadmium
uptake by humans because tobacco leaves accumulates high levels of cadmium.6
The determination of cadmium ions has been usually carried out through spectroanalytical techniques such as flame atomic absorption spectrometry (FAAS),1,7 graphite
furnace atomic absorption spectrometry (GF AAS)8,9 and
inductively coupled plasma optical emission spectrometry (ICP OES).10-12 The interest in FAAS comes from their
to improve the limits of detection.13,14 In particular, the
adsorbent preconcentration flow injection systems have been seen as a very useful tool because of the simplicity, high preconcentration factors, easy regeneration of the solid phase, low consumption of sample and reagents and high sample throughput.15 Although SPE associated with
flow injection systems has been very well recognized as an efficient analytical tool for improving the detectability of spectroanalytical techniques, its success depends on selective and adsorptive performance of adsorbent.
The carbonaceous nanomaterials, such as carbon nanotubes (CNTs),7,16-18 fullerene,19 activated carbons1,12,20
and graphene,21 show interesting properties as adsorbent for
metal ions due to its structure, mechanical (high resistance) and chemical properties and large surface area. In spite of these properties, the search for alternative and low cost nano-carbonaceous material with similar properties has been increasingly investigated. Carbon black (CB) has emerged as an alternative nanomaterial although very little research has been focused on metal ion preconcentration for the development of highly sensitive analytical methods. This material has been widely consumed in automotive-related rubber product applications due to its reinforcing action22
and also used as a versatile material as a catalyst23 and
conductive material.24 The particle size of CB is partially
in the nanometer range with average values between 20 and 300 nm according to different production process. This is similar to the diameter of the fullerene and the thickness of carbon nanotube and graphene.25 CB is composed of
90-99% elemental carbon, with oxygen and hydrogen as the other major constituents, which can be distributed in the carbonaceous matrix in various organic functional groups such as hydroxyl (−OH), carbonyl (C=O) and carboxyl (COOH). In addition to these elements, CB may contain small amounts of nitrogen and sulfur, depending upon the nature of hydrocarbons used in the manufacture.22,26 This
nanomaterial can be obtained from the partial combustion or thermal decomposition of hydrocarbons. The primary particles of CB exhibits a spherical shape and it presents a strong tendency to agglomerate, because of strong Van der Waals forces among the surface of the CB nanoparticles, affecting their dispersion in polar medium.25 Altering the
surface chemistry of CB is sometimes necessary to solve this drawback and also to improve the dispersability, chemical stability as well and the performance to adsorb metals ions.26 The modification with oxidizing agent
provides higher dispersion stability in aqueous medium due to increase of hydrophilic functional groups located at the edges of carbon layer plane such as hydroxyl, carbonyl and carboxyl, which are responsible for surface reactivity of CB.27-29 Silanization is another very popular method to
improve dispersion. Some studies have reported the use of organosilane grafted carbon nanotubes showing satisfactory sorption capacity for chromium, arsenium and selenium30
and lead,31,32 but currently studies regarding development
of CB modified with organosilanes as adsorbent for metal ions have not been found in the literature.
In this direction, this paper reports the modification of CB with 3-mercaptopropyltrimethoxysilane (3-MPTMS) aiming at the development of a preconcentration flow injection system for Cd2+ determination in water samples,
cigarette and biological sample by FAAS. 3-MPTMS has been chosen due to the thiol group (SH) on its structure, which confers to the molecule, according to Pearson theory, properties of soft base capable to strongly interact with Cd2+ cation.33 Taking into account that application
of modified CB in the field of separation science is in its infancy and the absence of similar reports in the literature, the present study provides new insight into application of alternative nano-carbonaceous adsorbents on the preconcentration studies aiming at metal ions determination at low levels.
Experimental
Apparatus
The absorption measurements were carried out using a flame atomic absorption spectrophotometer (Shimadzu
AA-7000, Kyoto, Japan) equipped with a hollow cathode lamp for cadmium. The hollow cathode lamp was operated at 8 mA and a wavelength of 228.8 nm. The flame used was comprised of air-acetylene with a flow of 2.0 L min−1. For
the propulsion of the solutions a peristaltic pump (Ismatec
IPC-08, Glattzbrugg, Switzerland) and Tygon® tubing were
used and an injector was used for steps of preconcentration and elution. pH measurements were performed using a pH meter (Metrohm 827 pH lab, Herisau, Switzerland).
Infrared spectra were recorded in a Shimadzu Fourier
transform infrared (FTIR) spectrophotometer FTIR-8300 (Tokyo, Japan) in the transmission range of 400-4000 cm−1.
The morphology of the materials was evaluated using a FEI Quanta 200 scanning electron microscope (SEM; Philips®,
Raman spectra were recorded using a DeltaNu Advantage laser Raman spectroscopy system (Laramie, WY, USA) at an excitation beam of 532 nm exposed during 15 s to prevent damage caused by laser irradiation. The spectra were measured in the range 200-3400 cm−1 to evaluate the
first-order Raman spectra. Thermal analysis was performed on a TGA 4000 thermogravimetric analyzer (PerkinElmer®,
Waltham, MA, USA). About 15 mg of materials were heated from 30 to 900 °C at a scan rate of 10 °C min−1 under
nitrogen atmosphere (20 mL min−1). Sample decomposition
of certified reference material was performed in a microwave oven model Ethos One (Milestone® microwave laboratory
system, Italy). Statistica® software package was used to
process the factorial experimental data (Statsoft, Tulsa, OK, USA).
Reagents
The reagents and solvents used in the preparation of modified CB were: nitric acid (70% purity), hydrochloric acid (37% purity), 3-mercaptopropyltrimethoxysilane (95% purity) as a modifying agent and ethanol as solvent, all acquired from Sigma-Aldrich® (St. Louis, MO, USA).
Commercial Vulcan XC-72R carbon black was kindly supplied by Cabot Corporation® (São Paulo, SP, Brazil).
Tris(hydroxymethyl)aminomethane hydrochloride (Tris-HCl) was obtained from Sigma-Aldrich® (St. Louis,
MO, USA) and sodium acetate and ammonia were prepared from their respective salts (Merck®, Darmstadt, Germany)
without further purification. H2O2 (Sigma-Aldrich®,
St. Louis, MO, USA) was used for sample decomposition procedures. Humic acid powder was acquired from Sigma-Aldrich® (St. Louis, MO, USA) and it was dissolved in a
1.0 mol L−1 KOH solution.
All aqueous solutions were prepared using ultrapure water from a Milli-Q® System (Millipore®, Billerica,
MA, USA). A 1000 mg L−1 Cd2+ stock solution was
purchased from Merck® (Darmstadt, Germany) and
working solutions were made by stepwise diluting the stock solution with ultrapure water. Solutions of Co2+, Zn2+,
Ni2+, Cu2+, Sb2+, Pb2+, Fe3+, As3+, Ca2+, Ba2+ and Mg2+ used
in the interference studies were prepared from their stock solutions (1000 mg L−1) or from their salts. pH values of
solutions were adjusted with NaOH and/or HNO3.
Synthesis of the modified carbon black (3-MPTMS-grafted CB)
Carbon black (2.0 g) was oxidized in refluxing with 50 mL of a HNO3:H2SO4 (3:1, v/v) mixture at 65 °C for
2 h.7,34 This procedure was required to create more binding
sites onto CB surface, mainly hydroxyl groups capable to react with 3-MPTMS. Then, the oxidized CB was washed with ultrapure water until the pH of the filtrate became stable (pH ca. 7.0) and finally dried at 100 oC. Afterwards, 1.65 g
of the oxidized CB were dispersed in 100 mL of ethanol and kept in an ultrasonic bath for 30 min. To grafting process, according to references35,36 with minor modifications, 300 µL
of the modifier agent 3-MPTMS were added and kept under reflux at 65 oC for 3 h. After that, 3-MPTMS-grafted CB
(synthetized material) was dried at 50 oC for 12 h.
Preconcentration procedure using flow injection system coupled to FAAS
The preconcentration system was operated in a time-based mode according to our previous publication.17 Twenty
milliliter solutions containing Cd2+ (sample or standard
solution) buffered with 0.1 mol L−1 Tris-HCl (pH 7.0)
were percolated at a flow rate of 4.0 mL min−1 through
a home-made cylindrical polyethylene mini-column packed with 30.0 mg of the 3-MPTMS-grafted CB. After preconcentration, the metal ion was eluted from the column with 1.0 mol L−1 HCl. Finally, the metal concentration in the
solution was determined by FAAS. For the water samples (mineral, tap, saline and lake), 95.0 mL of samples were employed and the volume was made up to 100.0 mL in volumetric flasks with 5.0 mL of 2.0 mol L−1 Tris-HCl
solution (pH 7.0).
Breakthrough curve
The breakthrough curve was constructed to determine the breakthrough volume and the maximum sorption
capacity (MSC) of 3-MPTMS-grafted CB towards Cd2+
under dynamic condition. The assays were performed by percolating aliquots of 4.0, 8.0 and 10.0 mL of 0.3 mg L−1 Cd2+ dissolved in 0.1 mol L−1 Tris-HCl
(pH = 7.0) through a mini-column packed with 30 mg of 3-MPTMS-grafted CB at a flow rate of 4.0 mL min−1, until
saturation was reached. Each aliquot was collected and analyzed by FAAS and the amount of cadmium adsorbed on silanized material (Q, mg g−1) for each aliquot was
determined according to equation 1:
(1)
where C0 is the initial cadmium concentration (mg L−1),
Cf is the concentration of cadmium in the column effluent
(mg L−1), V is the solution volume (in L) and m is the
Effect of interfering ions
In order to verify the influence of possible interfering ions on the Cd2+ preconcentration by 3-MPTMS-grafted CB,
binary solution of Co2+, Zn2+, Ni2+, Cu2+, Sb2+, Pb2+, Fe3+,
As3+, Ca2+, Ba2+ or Mg2+ in the presence of Cd2+ were
subjected to preconcentration system, under optimized conditions. The studied proportions (m/m) of Cd2+ and the
possible interfering ions were 1:1, 1:5, 1:10, 1:50 and 1:200, and they were compared to the analytical signal obtained to a single solution containing 30.0 µg L−1 Cd2+. The influence
of organic mater as humic acid was also investigated.
Sample preparation
The proposed method applicability was verified by analysis of cigarette and saline water samples and three different types of water, i.e., tap, mineral and lake. Tap water was collected at the Londrina State University and lake water came from Lake Igapó III, both located in Londrina, Paraná, Brazil. Lake water has been thoroughly filtered up until be clear. Mineral water and the cigarette samples were obtained from local supermarkets. The saline sample (0.9% NaCl, m/v) was purchased at a pharmacy in the city of Londrina (PR, Brazil). Aliquots of 95.0 mL of water samples were taken and the volume was made up to 100.0 mL in volumetric flasks with 5.0 mL of 2.0 mol L−1 Tris-HCl solution (pH 7.0). The accuracy
was checked by analysis of Lobster Hepatopancreas reference material for trace metals (TORT-2). 500.0 mg of cigarette and 113.0 mg of the TORT-2 were digested with 10.0 mL of concentrated nitric acid (HNO3) and 4.0 mL
of 30% hydrogen peroxide (H2O2). Analyses were carried
out in triplicate, kept overnight and then digested using microwave oven.37 After this step, the samples were heated
on a hot plate to near dryness and then cooled down to
room temperature. Afterward, the residue was dissolved in 80.0 mL of ultrapure water with further addition of 5.0 mL of 2.0 mol L−1 Tris-HCl solution (pH 7.0) and the volume
was made up to 100.0 mL in volumetric flask. For each sample, blank solutions were prepared.
Results and Discussion
Characterization of materials
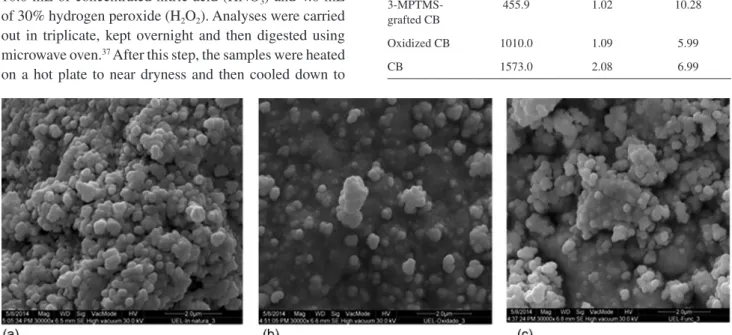
In order to evaluate the surface morphologies of the materials, SEM images of CB (in natura), oxidized CB and 3-MPTMS-grafted CB were recorded (Figure 1).
As can be observed in Figure 1a, CB presents typical assembled spherical particles with size lower than 500 nm. The effect of oxidation can be evaluated in Figure 1b, which shows clearly aggregation of particles most likely due to intramolecular forces as hydrogen bond ascribed to the functional groups hydroxyl, carbonyl and carboxyl on the surface.38 On the other hand, the modification with
3-MPTMS of oxidized CB promoted a new disaggregation of particles although lower than CB, indicating the grafting of 3-MPTMS on the surface owing to the hydrophobic feature of silane agent.
The surface morphology of materials can be related to the textural characteristics as shown in Table 1.
Table 1. Textural properties of the carbon black (CB), oxidized CB and 3-mercaptopropyltrimethoxysilane (3-MPTMS)-grafted CB
Material Surface area / (m2 g−1)
Pore volume / (cm3 g−1)
Pore diameter / nm
3-MPTMS-grafted CB
455.9 1.02 10.28
Oxidized CB 1010.0 1.09 5.99
CB 1573.0 2.08 6.99
The CB shows, as expected, the highest surface area and pore volume. After oxidation process, the surface area significantly decreased and pore volume was reduced in 2-fold regarding CB. Such result can be rationalized bearing in mind the very high aggregation degree of particles due to presence of hydrophilic functional groups located at the edges of carbon layer plane, thus making the carbon layer nearest each other and, as consequence, decreasing the pore volume and surface area. In regard to CB functionalized with 3-MPTMS, it was found higher pore diameter and the lowest surface area, which can be explained due to insertion of 3-MPTMS agent inside the pores of material. One should note that even though functionalization of CB decrease the surface of material, its surface area is still considered high being suitable to allow the use of these materials for preconcentration. As a brief comparison, the proposed CB functionalized with 3-MPTMS presents higher surface than organosilane-modified multi-walled carbon nanotubes (MWCNT).39,40
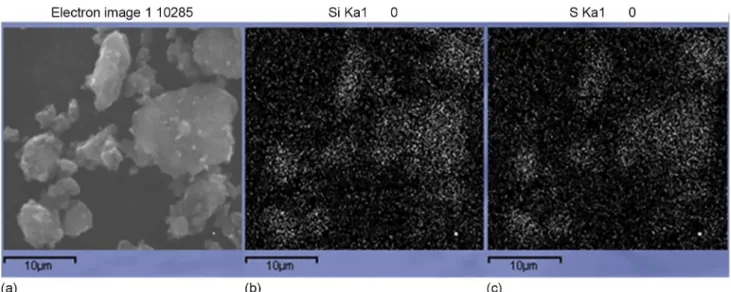
To investigate the amount of Si and S as well as the homogeneous distribution of these elements on the functionalized CB, energy dispersive spectroscopy (EDS) spectrum (data not shown) and elemental mapping were recorded. The EDS images, depicted in Figures 2b and 2c, show absence of detectable phase segregation and element islands, thus showing a good homogeneous dispersion of Si and S. From the EDS spectra (data not shown) of 3-MPTMS-grafted CB, it was found percentages of C (77.00 wt.%), O (22.00 wt.%), Si (0.32 wt.%), S (0.31 wt.%) and K (0.11 wt.%). The low content of Si and S is expected owing to the low amount of 3-MPTMS used in the functionalization. In spite of this finding, the silanization reaction is considered successful according to
literature data and bearing in mind the CB/3-MPTMS ratio used.26 Furthermore, the low content of S−H group in the
material has been enough for improving the detectability of preconcentration method as will be further demonstrated in the figures of merit.
The FTIR spectra of CB, oxidized CB and 3-MPTMS-grafted CB are depicted in Figure 3. The band around 3440 cm−1 corresponds to OH stretching vibration
from water absorption or hydroxyl groups present in the materials. It is evident that there are many more hydroxyl groups connect to CB after oxidation process than on pristine CB. The peak at 1630 cm−1 was only observed for pristine
CB, which is ascribed to the C=C stretching vibration present in the material.41 After oxidation process, the spectrum for
oxidized CB exhibited a new band at 1585 cm−1, which
is attributed to hydroxyl groups or carbonyl groups.42 In
3-MPTMS-grafted CB (Figure 3c) this signal is reduced, most likely due to insertion of 3-MPTMS agent inside the pores of material which may have caused the reduction in surface area and pore volume of this CB, as described in its textural properties. The evidence of the silanization comes from the weak signals at 769 and 673 cm−1 due to Si–O
stretching vibrations.7 It must be emphasize that the bands
at 1114 and 1118 cm−1 observed, respectively, for CB and
oxidized CB can be attributed to C−O stretching, while the one observed at 1103 cm−1 for 3-MPTMS-grafted CB
is attributed to Si−O−Si stretching, which in turn can be overlapped with C−O stretching.
The samples were also analyzed by Raman spectroscopy. Results are plotted in Figure 4.
Raman spectra of the materials are characterized mainly by two strong bands: the G (graphite) band around 1600 cm−1, which indicates the presence of sp2 hybridized
carbons, and the D (defect or disorder) band around 1340 cm−1 ascribed to sp3 hybridized carbons. The relative
intensity of the bands D and G (ID/IG) can be used to evaluate
the microstructure of the carbonaceous materials.43 From
Figure 4, the (ID/IG) ratio were found to be 0.37 for CB,
0.25 for oxidized CB and 0.23 for 3-MPTMS-grafted CB, thus indicating an increase in the order of the graphitic structure of CB after oxidation and grafting process.36
The broad G’ peak (around 2450 cm−1) presents in the
3-MPTMS-grafted CB can be assigned to an overtone and is due to D + G phonons contribution and this band shows evidence of the set 3-MPTMS, suggesting that treatment led to higher order.26 The band around 2330 cm−1 presented
in all materials comes from the Raman mode of N2 gas
present in the air surrounding the sample.44
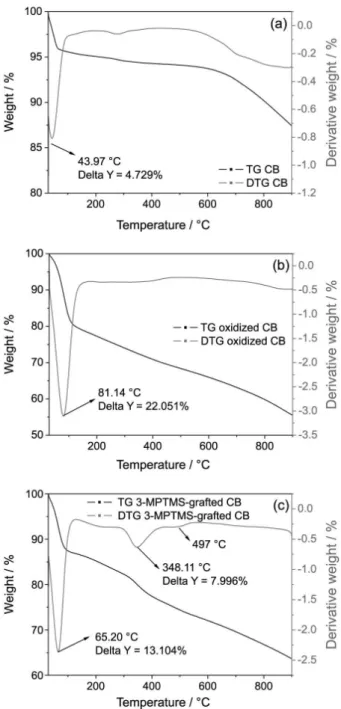
Thermogravimetric curve (TG) and derivative thermogravimetric curve (DTG) for the CB, oxidized CB
and 3-MPTMS-grafted CB are depicted in Figures 5a, 5b and 5c, respectively. In Figure 5a, it can be seen that CB presented the highest thermal stability (12% weight loss) and in the temperature around 44 °C corresponds to the volatilization of water molecules adsorbed on the material surface. However, the TG of oxidized CB (Figure 5b) showed a large weight loss (45%), which clearly demonstrates the decrease of thermal stability after oxidation process. The event around 82 °C can be attributed to losses of residual water adsorbed on the material surface since the oxidation only increases the amount of functional groups already containing oxygen atoms therein in nature. After functionalization with 3-MPTMS, the weight mass was found to be 35% and the material showed three thermal decomposition events (Figure 5c). The first event took place in the temperature around 65 °C and it is ascribes to the removal of physically adsorbed water. The second event occurred in the temperature at 348 °C could be attributed to the decomposition of hydrophilic side groups still present in the material, and the third one observed at 497 °C is ascribed to thermal decomposition of 3-MPTMS bonded to carbon sheets, as has been reported in literature for carbon sulfur compounds.26,42
The lower weight loss of the 3-MPTMS-grafted CB compared to oxidized CB and, as consequence, a higher ceramic yield is most likely due to the formation of SiO2
during heating, which also confirms the functionalization process.26,27
Optimization of the method for cadmium analysis
After characterization of materials, the on-line preconcentration method for Cd2+ determination by FAAS
was optimized using 3-MPTMS-grafted CB as adsorbent by means of a 24 full factorial design whose factors pH,
buffer concentration (BC), preconcentration flow rate (PFR) and eluent concentration (EC, HCl), their levels and obtained results are presented in Table 2. The experimental design was carried by loading 20.0 mL of 30.0 µg L−1 Cd2+
solutions through a mini-column packed with 30.0 mg of 3-MPTMS-grafted CB. The absorbance was taken as analytical responses. The overall design was performed in duplicate and the data was converted into a Pareto chart (Figure 6) at the 95% confidence level, in order to study the influence of each factor on the preconcentration system. Horizontal bars from the Pareto chart higher than the vertical line establish the significance of factors. Therefore, as observed, the EC in the experimental domain (1.0-1.5 mol L−1) did not exert influence on the analytical
signal, thus the lowest value (1.0 mol L−1 HCl) was chosen
for further experiments. The PFR showed a negative Figure 3. Fourier transform infrared (FTIR) spectrum of (i) carbon black
(CB); (ii) oxidized CB; and (iii) 3-mercaptopropyltrimethoxysilane (3-MPTMS)-grafted CB.
standardized effect (−3.74), meaning that the use of lower flow rate (4.0 mL min−1) increases the retention rate of Cd2+
on the 3-MPTMS-grafted CB. This finding demonstrates that the kinetics of the Cd2+ retention onto the
3-MPTMS-grafted CB is not too fast. Regarding the BC on the system, it was noticed that higher concentration (0.1 mol L−1)
promotes significant increase in the analytical signal of Cd2+.
The positive standardized effect (7.71) of the sample pH denotes that the increment of pH within the experimental domain (4.5-7.5) may increase the Cd2+ retention on the
3-MPTMS-grafted CB. One should note that the interaction
BC × PFR has been statistically significant (negative standardized effect of −8.40), which clearly demonstrates that these factors cannot be optimized independently each other and further experiments would be required for final optimization. However, once the interaction BC × PFR presents a negative standardized effect, the use of lower preconcentration flow rate will considerably decrease the sample throughput of method, thus the BC and PFR were set at 0.1 mol L−1 and 4.0 mL min−1, respectively, as optimum
conditions. Bearing in mind that BC was set as 0.1 mol L−1,
the final optimization of pH was optimized by means of a univariate strategy. The influence of pH was then investigated in a wide range (4.0-8.0) using buffer solutions acetate and Tris-HCl at a concentration of 0.1 mol L−1 depending upon
their buffering capacity in the wide pH range. Assays were performed in triplicate and were carried out by loading 20.0 mL of 10.0 µg L−1 Cd2+ solution, and elution was carried
out with 1.0 mol L−1 HCl at a flow rate of 4.0 mL min−1. The
achieved results corroborate the multivariate study, in which the higher Cd2+ retention on the 3-MPTMS-grafted CB takes
place at higher pH values. The decrease of analytical signal at pH 8.0 can be explained most likely due to formation of hydroxide species of cadmium, such as Cd(OH)+ which
makes the retention of cadmium less effective. According to the aforementioned, the optimum conditions for the preconcentration system were: pH 7.0, 0.1 mol L−1 Tris-HCl
as buffer solution, 1.0 mol L−1 HCl as eluent concentration
and preconcentration flow rate of 4.0 mL min−1.
Interference studies
Table 3 shows the competitive sorption results for the binary mixture of Cd2+ and containing possible interfering
ions. In general, the satisfactory selectivity can be attested according to low variation percentage of the analytical signal of Cd2+ (−16 up to 13%) even in the presence of
high concentration of possible interfering ions. From these results it is possible to infer that the proposed method can be free from matrices effect in different kind of samples, as it will be further demonstrated in the application of method in water sample, saline water (NaCl 0.9%, m/v) and cigarette and biological sample (certified reference material). The influence of organic mater on the Cd2+ preconcentration
was also evaluted. Cadmium was preconcentrated in the presence of 1.0 mg L−1 humic acid, which has been
considered a normal concentration of humic substances in natural water samples.45 The variation percentage was found
to be −15%, thus indicating low influence of humic acid on the Cd2+ preconcentration. This result corroborates the
feasibility of Cd2+ determination in lake water samples free
of interference using an external analytical curve. Figure 5. Thermogravimetric curve (TG) and derivative thermogravimetric
Characteristics of the proposed method
Under optimized conditions, the proposed method presented a analytical curve with preconcentration step in the range of 2.0-40.0 µg L−1 yielding the linear equation: Figure 6. Pareto chart obtained from 24 full factorial design. BC: Buffer concentration; PFR: preconcentration flow rate; and EC: eluent concentration.
Table 2. Factors and levels obtained using 24 full factorial design
Factor Level
(−) (+)
pH 4.5a 7.5b
PFR / (mL min−1) 4.0 8.0
BC / (mol L−1) 0.01 0.10
EC / (mol L−1) 1.0 1.5
Assay pH PFR BC EC Absorbance / (peak height) Absorbance / (peak height)
1 +(7.5) +(8) +(0.1) +(1.5) 0.404 0.391
2 −(4.5) +(8) +(0.1) +(1.5) 0.322 0.304
3 +(7.5) −(4) +(0.1) +(1.5) 0.438 0.419
4 −(4.5) −(4) +(0.1) +(1.5) 0.410 0.369
5 +(7.5) +(8) −(0.01) +(1.5) 0.310 0.325
6 −(4.5) +(8) −(0.01) +(1.5) 0.247 0.257
7 +(7.5) −(4) −(0.01) +(1.5) 0.259 0.262
8 −(4.5) −(4) −(0.01) +(1.5) 0.260 0.251
9 +(7.5) +(8) +(0.1) −(1.0) 0.342 0.311
10 −(4.5) +(8) +(0.1) −(1.0) 0.305 0.325
11 +(7.5) −(4) +(0.1) −(1.0) 0.422 0.404
12 −(4.5) −(4) +(0.1) −(1.0) 0.347 0.388
13 +(7.5) +(8) −(0.01) −(1.0) 0.349 0.347
14 −(4.5) +(8) −(0.01) −(1.0) 0.250 0.247
15 +(7.5) −(4) −(0.01) −(1.0) 0.262 0.256
16 −(4.5) −(4) −(0.01) −(1.0) 0.304 0.289
aAcetate/acetic acid buffer; bphosphate buffer. BC: Buffer concentration; EC: eluent concentration; PFR: preconcentration flow rate. The values in parentheses are the real values of factors.
Table 3. Variation percentage of the analytical signal of Cd2+ in the presence of other metal ions
Possible interferent
Variation of analytical signal of Cd2+ / %
Cd2+:interferent
1:1 1:5 1:10 1:50 1:200
Co2+ 12 9 −16 −12 NI
Zn2+ 3 10 −7 −7 NI
Ni2+ 2 8 8 −3 NI
Cu2+ 12 10 −4 −2 NI
Sb2+ −7 3 −4 −2 NI
Pb2+ 13 −9 7 0 NI
Fe3+ −8 −1 2 2 NI
As3+ −10 −1 −1 5 NI
Ca2+ NI NI NI −6 −2
Ba2+ NI NI NI 1 −1
Mg2+ NI NI NI 3 5
Abs = –3.00 × 10⁻³ + 1.37 × 10⁻² [CdII, mg L−1] (2)
with good correlation coefficient (r = 0.9997). The analytical curve without preconcentration step was built in the range of 100.0 to 600.0 µg L−1 giving rise to a linear
equation:
Abs = 8.00 × 10⁻⁴ + 3.70 × 10⁻⁴ [CdII, mg L−1] (3)
and r = 0.9995. Significant improvement on sensitivity was observed after implementing the preconcentration step, yielding in a higher preconcentration factor (PF) of 37. This parameter was determined as the ratio between the slopes calculated for the Cd2+ preconcentration using
3-MPTMS-grafted CB and the Cd2+ direct aspiration into
the FAAS (without preconcentration).46
The LOD and limit of quantification (LOQ), calculated according to the International Union of Pure and Applied Chemistry (IUPAC) reccomendation as three and ten times the standard deviation for the blank solution (n = 10) were found to be 0.20 and 0.66 µg L−1, respectively.47 The values
of concentration efficiency (CE), consumptive index (CI) and sample throughput were determined as described in the literature and were found to be 7.35 min−1, 0.54 mL and
12 h−1, respectively.48 The precison of method, evaluated
in terms of repeatability for 10 measurements, was found to be 2.8 and 1.4% (relative standard deviation) for respective concentrations of 5.0 and 40.0 µg L−1 of Cd2+.
In order to evaluate whether the silanization of CB with the 3-MPTMS promotes, in fact, improvements on the Cd2+
FAAS determination, one analytical curve for oxidized CB was also obtained the following linear equation:
Abs = 1.21 × 10⁻²³ + 9.30 × 10⁻³ [CdII, mg L−1] (4)
It was observed an increase of 46% on the sensitivity for the Cd2+ determination, when using the
3-MPTMS-grafted CB, which clearly demonstrated that functionalized material has great capacity for sorption of Cd2+ even having lower surface area than oxidized CB.
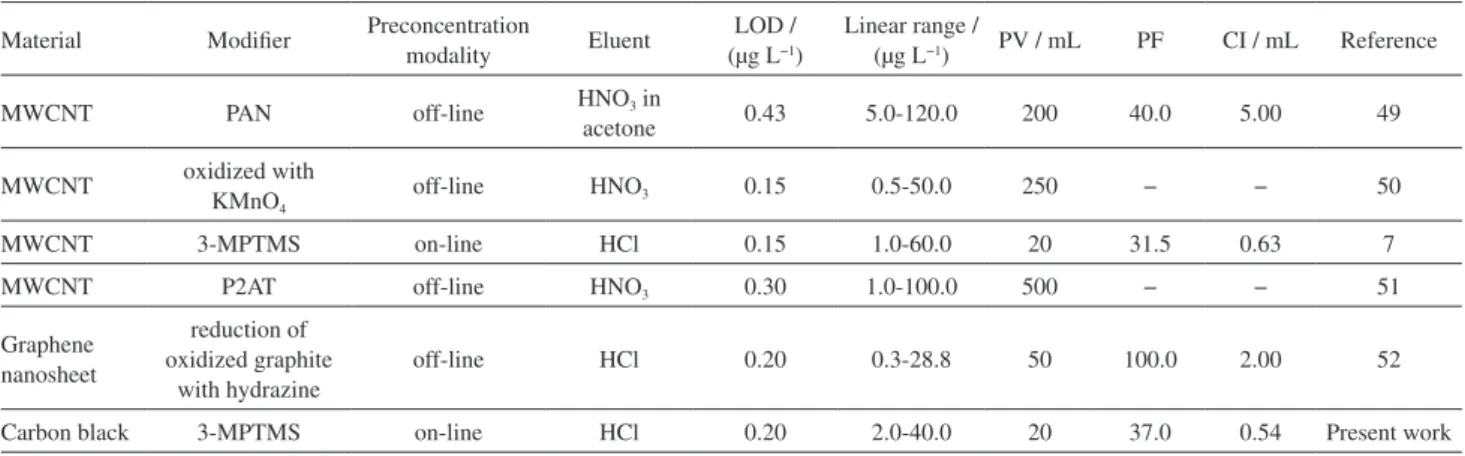
The present method, when compared to previous preconcentration procedures based on solid phase extraction using others carbonaceous materials, such as carbon nanotube and graphene for Cd2+ determination
by FAAS (Table 4), provides similar LOD, but greater analytical performance in terms of sample consumption, preconcentration factor, sample throughput, owing to the flow injection system implemented and consumptive index. In addition to this finding, it must be point out that the CB is extremely cheap once we have received 1 kg of material free of charge by the supplier Cabot Corporation® (São Paulo,
SP, Brazil). The material has proven to be extremely stable under several preconcentration/elution cycles, once more than 300 cycles were carried out in overall study without loss of sorption capacity of material. Therefore, up to now it is impossible to affirm accurately the life-time of material. Although very interesting as adsorbent, it is worth noting the crucial careful for handling CB since in general, this material in similar way to another nano-carbonaceous materials, may cause adverse biological outcomes for humans, such as inflammation, genotoxicity and cell death induction.48 Anyway, once packed into a mini-column the
handling practically is no more need due to high reusability of material.
Breakthrough curve
Breakthrough curve depicted in Figure 7 shows that breakthrough volume was found to be 4.0 mL, which
Table 4. Comparative data of some preconcentration systems for Cd2+ determination by flame atomic absorption spectrometry (FAAS) using nano-carbonaceous materials as adsorbents
Material Modifier Preconcentration
modality Eluent
LOD / (µg L−1)
Linear range /
(µg L−1) PV / mL PF CI / mL Reference
MWCNT PAN off-line HNO3 in
acetone 0.43 5.0-120.0 200 40.0 5.00 49
MWCNT oxidized with KMnO4
off-line HNO3 0.15 0.5-50.0 250 − − 50
MWCNT 3-MPTMS on-line HCl 0.15 1.0-60.0 20 31.5 0.63 7
MWCNT P2AT off-line HNO3 0.30 1.0-100.0 500 − − 51
Graphene nanosheet
reduction of oxidized graphite
with hydrazine
off-line HCl 0.20 0.3-28.8 50 100.0 2.00 52
Carbon black 3-MPTMS on-line HCl 0.20 2.0-40.0 20 37.0 0.54 Present work
corresponds to a retention of 0.040 mg of Cd2+per gram
of 3-MPTMS-grafted CB. This result was very useful for evaluating the sorption rate of Cd2+ onto 3-MPTMS-grafted
CB during construction of analytical curve. Taken the last point of analytical curve, i.e, 40.0 µg L−1 of Cd2+, the
uptake of metal is 0.026 mg g−1, which is lower than the one
achieved from breakthrough volume, thus indicating that Cd2+ is completely adsorbed by material during construction
of analytical curve. Moreover, from the result achieved by the breakthrough volume, the sample preconcentration volume can be increased from 20.0 to 30.0 mL, without losses of uptake capacity of material and, as consequence, the LOD and LOQ of method could be decreased.
The column saturation was achieved by loading 492.0 mL of 0.3 mg L−1 Cd2+ solution, yielding in a MSC
of 1.71 mg g−1. This value was over 3.6 times greater than
that reported in literature for MWCNT functionalized with
3- MPTMS.7
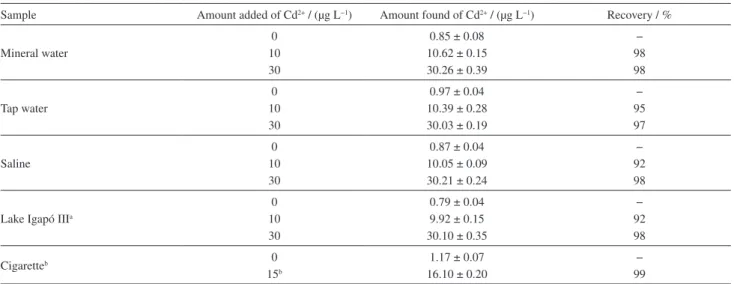
Application of the proposed method
In order to check the accuracy and validity for real samples, the proposed method was applied to the Cd2+ in
different kind of samples and certified reference material. As shown in Table 5, Cd2+ at trace levels was found in
mineral, tap, saline and lake water samples as well as in cigarrete sample. Recovery experiments of different amount of Cd2+ by using analytical external curve were
performed given rise to satisfactory recoveries (92-99%), thus attesting the accuracy and applicability of the method free of interferences. Although Cd2+ has been quantified in
drinking water, the amount achieved was lower than that
maximum level recognized by US EPA3 and ANVISA.4
Regarding cigarette sample, it is known that in the absence of occupational exposure, the main sources of Cd2+ uptake
are food and tobacco smoke. Therefore, the element has been included in the list of harmful and potentially harmful constituents in tobacco products and tobacco smoke according to US Food and Drug Administration (FDA).53
The amount of Cd2+ obtained in the present study was
slightly higher and lower than those amounts determined by Andrade et al.54 and Lemos et al.,55 respectively, in
cigarettes commercialized in Brazil. The amount of Cd2+
also determined in certified reference (TORT-2, lobster hepatopancreas) by this method (26.47 ± 0.25 µg g−1,
n = 3) was statistically equal to the certified value (26.7 ± 0.6 µgg−1) with 95% confidence interval (Student’s
t-test), thus confirming the accuracy of the proposed method even for biological sample submitted to acid digestion. Figure 7. Breakthrough curve of 3-mercaptopropyltrimethoxysilane (3-MPTMS)-grafted carbon black (CB) using 0.3 mg L−1 cadmium at a flow rate 4.0 mL min−1. C
f: Cadmium concentration in the column effluent; C0: initial cadmium concentration, 0.3 mg L−1.
Table 5. Quantification and recovery of Cd2+ in different kind of samples
Sample Amount added of Cd2+ / (µg L−1) Amount found of Cd2+ / (µg L−1) Recovery / %
Mineral water
0 10 30
0.85 ± 0.08 10.62 ± 0.15 30.26 ± 0.39
− 98 98
Tap water
0 10 30
0.97 ± 0.04 10.39 ± 0.28 30.03 ± 0.19
− 95 97
Saline
0 10 30
0.87 ± 0.04 10.05 ± 0.09 30.21 ± 0.24
− 92 98
Lake Igapó IIIa
0 10 30
0.79 ± 0.04 9.92 ± 0.15 30.10 ± 0.35
− 92 98
Cigaretteb 0
15b
1.17 ± 0.07 16.10 ± 0.20
− 99
Conclusions
In the present study, CB chemically modified with 3-MPTMS as organosilane agent was used for the first time as adsorbent for Cd2+ aiming at development of a
preconcentration method on-line coupled to FAAS. The results obtained from the characterization of the materials by means of FTIR, Raman, TG and textural analysis were very useful to confirm the oxidation and functionalization of CB with 3-MPTMS. As for the presented method, the use of 3-MPTMS in the CB functionalization improves the sensitivity of the method and when compared to others that make use of more expensive nano-carbonaceous material, such as carbon nanotubes, the advantages of this study is highlighted by low limit of detection, low sample consumption, high preconcentration factor and low cost. Therefore, for final remarks, the 3-MPTMS-grafted CB can be considered as an alternative and efficient nano-carbonaceous adsorbent to be used for preconcentration studies aiming at determination of Cd2+ at low levels.
Acknowledgments
The authors would like to thank the Conselho Nacional de Desenvolvimento Científico e Tecnológico (CNPq, Project No. 481669/2013-2, 305552/2013-9, 472670/2012-3), Coordenação de Aperfeiçoamento de Pessoal de Nível Superior (CAPES, 25/2014), Fundação Araucária do Paraná (163/2014), Laboratório de Espectroscopia da Central de Multiusuário da Pró-Reitoria de Pesquisa e Pós-Graduação (PROPPG), Companhia de Saneamento do Paraná (SANEPAR) and Instituto Nacional de Ciência e Tecnologia de Bioanalítica (INCT, Project No. 573672/2008-3) for their financial support and fellowships.
References
1. Mahmoud, M. E.; Osman, M. M.; Ahmed, S. B.; Abdel-Fattah, T. M.; Chem. Eng. J. (Amsterdam, Neth.)2011, 175, 84. 2. Fan, H.-T.; Li, J.; Li, Z.-C.; Sun, T.; Appl. Surf. Sci. 2012, 258,
3815.
3. United States Environmental Protection Agency (US EPA);
National Primary Drinking Water Standards, Maximum Contaminant Level; U.S. Agency Office of Water: Washington D.C., August 2003.
4. Agência Nacional de Vigilância Sanitária (ANVISA);
Procedimentos de Controle e de Vigilância da Qualidade da Água para Consumo Humano e seu Padrão de Portabilidade, Resolution - RE No. 2.914, 2011.
5. Huff, J.; Lunn, R. M.; Waalkes, M. P.; Tomatis, L.; Infante, P. F.;
Int. J. Occup. Environ. Health 2007, 13, 202.
6. Yue, L.; Biomed. Environ. Sci. 1992, 5, 53.
7. Corazza, M. Z.; Somera, B. F.; Segatelli, M. G.; Tarley, C. R. T.;
J. Hazard. Mater. 2012, 243, 326. 8. Tüzen, M.; Food Chem. 2003, 80, 119.
9. Yang, G.; Fen, W.; Lei, C.; Xiao, W.; J. Hazard. Mater. 2009,
162, 44.
10. Zhang, N.; Hu, B.; Anal. Chim. Acta2012, 723, 54.
11. Silva, E. L.; Roldan, P. S.; Ginéa, M. F.; J. Hazard. Mater. 2009,
171, 1133.
12. Feist, B.; Mikula, B.; Food Chem. 2014, 147, 302. 13. Arpa, C.; Bektas, S.; Anal. Sci. 2006, 22, 1025.
14. Rekha, D.; Suvardhan, K.; Kumar, J. D.; Subramanyam, P.; Prasad, P. R.; Lingappa, Y.; Chiranjeevi, P.; J. Hazard. Mater.
2007, 146, 131.
15. Vellaichamy, S.; Palanivelu, K.; J. Hazard. Mater. 2011, 185, 1131.
16. Pyrzynska, K.; Anal. Sci. 2007, 23, 631.
17. Tarley, C. R. T.; Barbosa, A. F.; Segatelli, M. G.; Figueiredo, E. C.; Luccas, P. O.; J. Anal. At. Spectrom. 2006, 21, 1305. 18. Tuzen, M.; Saygi, K. O.; Soylak, M.; J. Hazard. Mater. 2008,
152, 632.
19. Gallego, M.; de Pena, Y. P.; Valcárcel, M.; Anal. Chem. 1994,
66, 4074.
20. Ensafi, A. A.; Ghaderi, R. A.; J. Hazard. Mater. 2007, 148, 319.
21. Yu, J.-G.; Yu, L.-Y.; Yang, H.; Liu, Q.; Chen, X.-H.; Sci. Total Environ. 2015, 502, 5274.
22. Valenzuela-Calahorro, C.; Navarrete-Guijosa, A.; Stitou, M.; Cuerda-Correa, E. M.; Appl. Surf. Sci.2007, 253, 5274. 23. Jansen, R. J. J.; Vanbekkum, H.; Carbon1994, 32, 1507. 24. Noked, M.; Soffer, A.; Aurbach, D. J.; Solid-State Electron.
2011, 15, 1563.
25. Meiriane, C. F.; Soares, M. M.; Viana, Z. L.; Schaefer, V. S.; Gangoli, Y. C.; Caliman, V.; Wong, M. S.; Silva, G. G.; Carbon 2014, 72, 287.
26. Atif, M.; Bongiovanni, R.; Giorcelli, M.; Celasco, E.; Tagliaferro, A.; Appl. Surf. Sci.2013, 286, 142.
27. Baikousi, M.; Dimos, K.; Bourlinos, A. B.; Zbořil, R.; Papadas, I.; Deligiannakis, Y.; Karakassides, M. A.; Appl. Surf. Sci. 2012, 258, 3703.
28. Cheng, M. P.; Jang, K. K.; Zhong, T. B.; Carbon2006, 44, 3233. 29. Ma, P. C.; Kim, J. K.; Tang, B. Z.; Carbon2006, 44, 3232. 30. Peng, H.; Zhang, N.; He, M.; Chen, B.; Hu, B.; Talanta2015,
131, 266.
31. Torkian, L.; Amini, M. M.; Gorji, T.; Sadeghi, O.; Arabian J. Chem., in press, DOI: 10.1016/j.arabjc.2014.10.041. 32. Somera, B. F.; Corazza, M. Z.; Yabe, M. J. S.; Segatelli, M. G.;
Galunin, E.; Tarley, C. R. T.; Water, Air, Soil Pollut. 2012, 223, 6069.
35. Kathi, J.; Rhee, K.; Lee, J. H.; Composites, Part A2009, 40, 800.
36. Velasco-Santos, C.; Martínez-Hernandez, A. L.; Lozada-Cassou, M.; Alvarez- Castillo, A.; Castaño, V. M.; Nanotechnology2002,
13, 495.
37. Filho, V. R. A.; Polito, W. L.; Gomes Neto, J. A.; J. Braz. Chem. Soc. 2007, 18, 47.
38. Boyaci, E.; Çagir, A.; Shahwan, T.; Eroglu, A. E.; Talanta2011,
85, 1517.
39. Avilés, F.; Sierra-Chi, C. A.; Nistal, A.; May-Pat, A.; Rubio, F.; Rubio, J.; Carbon2013, 57, 520.
40. Gaspar, H.; Pereira, C.; Rebelo, S. L. H.; Pereira, M. F. R.; Figueiredo, J. L.; Freire, C.; Carbon2011,49, 3441. 41. Mohan, A. N.; Manoj, B.; Int. J. Electrochem. Sci. 2012, 7,
9537.
42. Vukovic, G.; Marinkovic, A.; Obradovi, M.; Radmilovic, V.; Colic, M.; Aleksic, R.; Uskokovic, P. S.; Appl. Surf. Sci. 2009,
255, 8067.
43. Kameya, Y.; Hanamura, K.; Chem. Eng. J. (Amsterdam, Neth.) 2011, 173, 627.
44. Pimenta, M. A.; Dresselhaus, G.; Dresselhaus, M. S.; Cançado, L. G.; Jorio, A.; Saito, R.; Phys. Chem. Chem. Phys.
2007, 9, 1276.
45. Wuilloud, J. C. A.; Wuilloud, R. G.; Sadi, B. B. M.; Caruso, J. A.; Analyst (Cambridge, U. K.) 2003, 128, 453.
46. Tarley, C. R. T.; Corazza, M. Z.; Somera, B. F.; Segatelli, M. G.;
J. Colloid Interface Sci. 2015, 450, 254.
47. Long, G. L.; Winefordner, J. D.; Anal. Chem. (Washinghton, DC, U. S.)1983, 55, 712A.
48. Diniz, K. M.; Segatelli, M. G.; Tarley, C. R. T.; React. Funct. Polym. 2013, 73, 838.
49. Tavallali, H.; Fakhraee, V.; Int. J. ChemTech. Res. 2011, 3, 1628. 50. Jun-Ping, X.; Qing-Xiang, Z.; Hua-Hua, B. J.; J. Environ. Sci.
(Beijing, China)2007, 19, 1266.
51. Nabid, M. R.; Sedghi, R.; Bagheri, A.; Behbahani, M.; Taghizadeh, M.; Oskooie, H. A.; Heravi, M. M; J. Hazard. Mater. 2012, 203, 93.
52. Hallaj, R.; Bahar, S.; Babamiri, B.; Zandi, S.; Can. J. Chem.
2014, 92, 62.
53. United States Food and Drug Administration (US FDA); 77 FR 20034-20037 - Harmful and Potentially Harmful Constituents in Tobacco Products and Tobacco Smoke; Department of Health and Human Services: Silver Spring, M.D., April, 2012. 54. Andrade, F. P.; Nascentes, C. C.; Costa, L. M.; J. Braz. Chem.
Soc. 2009, 20, 1460.
55. Lemos, V. A.; Novaes, C. G.; Lima, A. S.; Vieira, D. R.;
J. Hazard. Mater. 2008, 155, 128.
Submitted: December 8, 2015 Published online: February 16, 2016