Pedagogical content knowledge of statistics among
primary school teachers
ISoledad EstrellaII
Raimundo OlfosII
Arturo Mena-LorcaII
Abstract
In this study, we developed a questionnaire on the knowledge of Statistics among primary school teachers and their knowledge of how to teach statistics. This questionnaire focused on teacher awareness of student statistical knowledge and the teaching of statistical content. Three items related to statistical education were included: graph comprehension, differentiation between cognitive levels, and the understanding that arises from changing representational systems. When constructing questionnaire items, these features were included along with information on typical mistakes and difficulties experienced by students learning statistics and probability. The questionnaire comprised a total of 14 items and was administered to 85 primary school teachers and their respective students (n = 994) in Chilean schools. The content validity of the questionnaire was confirmed by 8 experts. The entire questionnaire is not included, and teacher and student performance are given for 2 of its items. Teacher trainers are advised to promote item-generation activities for future teachers to reflect on the teaching of statistical content and to build their awareness of student statistical knowledge.
Keywords
Statistics teaching — Didactics of mathematics — Pedagogical content Knowledge — Statistical education — Instrument — Questionnaire.
I- This research acknowledges financial support from PIA-CONICYT Project CIE-05 2010 of the Center for Advanced Research in Education, Chile. We appreciate careful reading of the proposed items and valuable contributions by Dr. Ana Serrado-Bayes, Dr. María Alejandra Sorto and Dr. Ismenia Guzmán Retamal.
II- Pontificia Universidad Católica de Valparaíso, Valparaíso, Chile.
El conocimiento pedagógico del contenido de
estadística en profesores de primaria
ISoledad EstrellaII Raimundo OlfosII Arturo Mena-LorcaII
Resumen
En este estudio desarrollamos un cuestionario sobre el saber del profesor de primaria en su conocimiento disciplinario de estadística y en su conocimiento para llevar a cabo la enseñanza de la estadística, centrado en el conocimiento del profesor en relación al saber estadístico del alumno y la enseñanza del contenido estadístico. Se incluyeron tres elementos de la educación estadística: comprensión gráfica, diferenciación de niveles cognitivos y comprensión generada al cambiar de sistemas de representación. La construcción de los ítems del cuestionario integró dichos elementos con los conocimientos sobre los errores y dificultades comunes de los alumnos en el aprendizaje de la Estadística y de la Probabilidad. El cuestionario considera un total de catorce ítems y fue aplicado a 85 profesores de educación primaria y a sus respectivos alumnos (de grados 4 y 7), pertenecientes a escuelas chilenas. El cuestionario posee validez de contenido otorgada por ocho expertos. Se presenta el cuestionario completo, y a partir de dos ítems se muestran los resultados de los profesores y de sus alumnos. Se propone al formador de profesores promover actividades de generación de ítems, para que los futuros profesores reflexionen sobre la enseñanza del contenido estadístico y construyan un conocimiento respecto al saber estadístico del alumno.
Palabras clave
Enseñanza de la estadística — Didáctica de la estadística — Conocimiento pedagógico del contenido — Educación estadística — Instrumento — Cuestionario.
I- La investigación presentada agradece el financiamiento de PIA – CONICYT, Proyecto CIE-05 2010 del Centro de Investigación Avanzada en Educación. Agradecemos la lectura meticulosa de los ítems propuestos y los valiosos aportes de la Dra. Ana Serrado-Bayes, Dra. María Alejandra Sorto y Dra. Ismenia Guzmán Retamal.
II- Pontificia Universidad Católica de Valparaíso, Valparaíso, Chile. Contactos: [email protected]; [email protected];
Introduction
On peut espérer que la Didactique, […], contribuera à améliorer la diffusion de la statistique.
Brousseau (2009)1.
In most countries, statistics has been introduced into school mathematics curricula. This development demands a range of skills and knowledge on the part of primary school teachers, who are responsible for implementing the curriculum in their classrooms.
In Chile, there is a social debate on the quality of education. Graduates in teaching have performed poorly in mathematics, and this performance has led to changes in professional curricula and deep reflection in training centers. However, the various solutions proposed and implemented for both the initial and continuing education of teachers offer few positive outcomes; proof of this are the weak scores obtained on national and international tests, demonstrating stagnation or very limited progress.
In schools, mathematics and statistics operate in different worlds, having different languages and concepts. The former is primarily associated with the deterministic and deductive spheres, while the latter addresses the stochastic and the inductive spheres, where variation and real context are essential for teaching statistics
(DEL PINO & ESTRELLA, 2012; ESTRELLA &
OLFOS, 2012; GROTH, 2007; STHOL, 2005). It is therefore necessary that teacher trainers and teaching students, in initial and continuous teacher training programs, consider the different teaching approaches required by the specific complexities of mathematical and
statistical content (BEN-ZVI & GARFIELD,
2004; FRANKLIN & GARFIELD, 2006).
Research on teachers’ disciplinary and professional knowledge for the practice of teaching has only emerged in recent decades. The construct of pedagogical content knowledge aims at specifying what professional knowledge is necessary in teaching to improve student
1- BROUSSEAU, Guy. Alternatives en didactique de la statistique. In:
41èmes journées de statistique. Bordeaux, France: IUFM Aquitaine, 2009.
learning (SHULMAN, 1986, 1987). During the last 3 decades, research in mathematics education has consolidated theoretical bodies under continuous development — for example, mathematics education, didactics of mathematics and socioepistemology — that provide solutions and approaches to the many problems of education. Research in statistical education is still in its infancy, and in Hispanic America, there are groups such as the Education Working Group on Statistics, Probability, and Combinatorics of the Spanish Society of Research in Mathematics Education (Grupo de Trabajo en Didáctica de la Estadística, Probabilidad y Combinatoria de la Sociedad Española de Investigación en Educación Matemática) and the Research Group on Statistical Education at the University of Granada (Grupo de Investigación sobre Educación Estadística de la Universidad de Granada), in addition to Latin American groups for didactics of mathematics and/or educational mathematics including statistics education research based at certain universities in Argentina, Brazil, Colombia, Mexico, and Chile.
Primary school teachers must possess in-depth knowledge of grade-level statistics to gain the ability to criticize, produce, and analyze statistics. In their role as teachers, they should possess a deep understanding of the systematic errors made by students and of the appropriate use of tools and representations, using a broad repertoire of assignments, questions, and specific contexts to help learners connect their ideas on statistics together.
To build an instrument to measure this knowledge, the background on historical advances in the construction of statistical objects, frequent challenges with representations, pedagogical content knowledge, and existing approaches to statistical education were studied. These topics are specified in this paper below.
of pedagogical content knowledge of statistics the proposed items belonged (ESTRELLA, 2010). The content validity of pedagogical content knowledge demanded a high score from the panel to include an item in the final instrument (Cf. Table II). This validation process resulted in a final instrument with 14 items corresponding to the Chilean curriculum, with items on statistics, inference, and probability. The instrument also included an equal number of items that measure 2 dimensions of teachers’ pedagogical content knowledge: the teaching of statistical content and the awareness of student knowledge.
Theoretical Framework
The instrument design considered the construct of (1) Shulman’s pedagogical content knowledge (BALL; HILL; BASS, 2005; BALL; THAMES; PHELPS, 2008; HILL et al, 2007; HILL; BALL; SCHILLING, 2008; SHULMAN, 1986, 1987) and 3 important features in teaching statistics: (2) Curcio’s taxonomy of graph comprehension (CURCIO, 1989; FRIEL; CURCIO; BRIGHT, 2001; SHAUGHNESSY; GARFIELD; GREER, 1996; SHAUGHNESSY, 2007), (3) the differentiation of cognitive levels of Garfield (2002), and (4) the concept of transnumeration by Wild and Pfannkuch (1999).
Pedagogical Content Knowledge
Shulman states that teaching starts when the teacher reflects on what must be learned and how it will be apprehended by his or her students. In these reflective processes, beliefs, implicit theories, and other forms of thought interact with contextual variables to configure actions materialized in the classroom. Since the 1980s when Shulman highlighted teaching processes, research in education has distinguished 3 basic dimensions of teacher knowledge: content
knowledge (CK), pedagogical content knowledge2
2- Some Spanish-speaking authors define PCK as “didactic content knowledge”; in our opinion, replacing pedagogical with didactic makes both concepts equal, improperly claiming that didactics and pedagogy are
(PCK), and pedagogical knowledge. This study addresses 2 of Shulman and his collaborators’ main contributions: reconsidering the study of teacher knowledge as a way to think about the role of content in teaching and presenting comprehension of content as a special type of technical knowledge essential to the teaching profession. When teaching mathematics in school, knowledge of subject content corresponds to what Ma (2010) conceptualizes as “profound understanding of fundamental mathematics”.
Different studies published on PCK quantitatively show that research in statistical education is limited. Pinto (2010) finds that the most researched topics are fractions and functions. Furthermore, the majority of studies address the knowledge of the content to be taught (approximately 88%), while less than half study specific PCK or knowledge regarding student learning processes. Burgess (2007) has conducted a study on teaching statistics, and he proposes a framework to study teacher knowledge based on aspects of the teacher’s mathematical knowledge and on the fundamentals of statistical thinking. One of Burgess’s conclusions is that “knowledge of content and students” and “knowledge of content and teaching” are grouped according to Shulman’s PCK, and, given the difference between mathematical and statistical learning, that some of the components from Ball et al. may not be appropriate for statistics teaching and learning.
Hill et al. (2007, 2008) have established 3 categories of PCK: knowledge of content and students (KCS), knowledge of content teaching, and curriculum knowledge. KCS refers to teacher familiarity with students’ mathematical thinking and their common mistakes. With respect to student learning, the authors focus on or distinguish between frequent student errors and student explanations; understanding of student knowledge and when a student’s
work shows greater comprehension; the student developmental sequence (types of problems by age, what is first learned, learning capabilities); and students’ typical calculation strategies.
In this study on PCK, the dimensions considered focus on teacher knowledge and teaching in relation to student knowledge. Teaching refers to the adaptation of knowledge to the grade level and involves knowledge of the curriculum, the organization of classroom mathematical and statistical activities, the teacher’s knowledge of statistics, and the teacher’s concept of learning. PCK is understood as the knowledge of the professor of student knowledge and what constitutes his or her acquired knowledge (student concepts), the most frequent difficulties faced by students, their potential mistakes, and students’ normal strategies.
Elements in the Teaching of Statistics
The Taxonomy of Graph Comprehension
Statistical education studies graph comprehension at different reading levels (AOYAMA, 2007; BAILLÉ; VALLÉRIE, 1993; BERTIN, 1967; CURCIO, 1989; FRIEL; CURCIO; BRIGHT, 2001,). Curcio (op. cit.) defines 3 types of graph comprehension, whereas the fourth type is an extension of the previous levels (SHAUGHNESSY; GARFIELD; GREER, 1996; SHAUGHNESSY, 2007). The level of comprehension known as “reading the data” requires local action and specifies how a literal reading of the graph only responds to explicitly represented facts and thus does not involve interpreting the information it contains. “Reading between the data” involves comparing and interpreting data values, integrating the data in the graph, finding relationships between quantities, and applying simple mathematical procedures to the data, understanding both the basic structure of the graph and the relationships it contains. “Reading beyond the data” involves the extrapolation of data, predicting and inferring
from implicit information in the graph, and it requires context knowledge of the data presented. Finally, “reading behind the data” is the extension of the 3 previous classifications and entails critically examining the use the graph and connecting graphical information with the context for an in-depth analysis and causal reasoning based on CK and experience. It includes examining data quality and the data collection methodology, suggesting a possible explanation, and developing alternative models and graphical representations.
Differentiation of Cognitive Levels
The notion of a hierarchy according to cognitive levels was originally developed by Garfield (2002) and originated from statistics learning in higher education. With an English-language origin, these levels are
called statistical literacy, statistical reasoning,
and statistical thinking. Statistical literacy includes the basic skills used to understand statistical information, including organizing data, building and presenting tables, working with different representations of data, comprehending concepts, vocabulary, and symbols, and understanding probability as a measure of uncertainty (BEN-ZVI; GARFIELD, 2004; GARFIELD; BEN-ZVI, 2007).
These authors state that statistical reasoning can be defined as how people reason with statistical ideas and make sense of statistical information. This reasoning involves understanding and explaining statistical processes and being able to fully interpret statistical results. This interpretation involves making decisions based on data sets, data representations, or statistical methods for summarizing data. Thus, statistical reasoning can connect one concept to another (such as centrality and dispersion) or combine ideas concerning statistics and probability.
It entails recognizing and understanding the complete research process (starting with the question posed, the collection of data, the choice of analysis, and the assumptions of the tests, among others). Statistical thinking also involves understanding how models are used to simulate random phenomena, comprehending how data are drawn to estimate probabilities, and recognizing how, when, and why the existing tools of inference can be used. It also involves the ability to understand and use the context of a problem to plan and evaluate research and draw conclusions (CHANCE, 2002).
Transnumeration: The Changing of Representations in Statistics
Transnumeration consists of obtaining new information when changing from one system of representation to another to reach understanding. This idea relates to Duval’s semiotic registers (1999). The creators of the concept of transnumeration (WILD; PFANNKUCH, 1999, p. 227) describe it as a dynamic process involving the ability to sort data properly, create tables or graphs of data, and find ways to represent the data set. Transnumeration indicates the understanding that emerges from this dynamic process of changing representations into a variety of registers.
From the modeling perspective, there are 3 types of transnumeration: “capturing” qualities or characteristics of the real world, transforming data into a tabular or graphical representation to make sense of them, and communicating this meaning in a way that is understandable to others.
To represent data properly and effectively, students need to advance through the processes of transforming data through transnumeration: deciding which message should be transmitted from the data, determining what type of representation to use, choosing a calculation method to transform data, and finally, using these transformed data in the representation chosen (CHICK, 2003).
Instrument development methodology
Construction Background
As noted above, the instrument was built based on the state of the art in approaches to statistical education and on PCK and curricula, with content validity to measure a primary school teacher’s PCK and CK for teaching statistics according to the curriculum in Chile (Ministry of Education of Chile [Ministerio de Educación de Chile - MINEDUC], 2009).
For each item, the following aspects were considered: content included in the Chilean primary school curriculum, the taxonomical classification of graph comprehension by Curcio (1989) —reading the data, reading between data, and reading beyond the data; the classification by Garfield (2002) — statistical literacy, reasoning, and thinking; the classification of statistical PCK, teacher KCS, and also the various translations between representations — from written text to graph, from table to graph, from graph to written text, from text to text, from written text to table, and from table to written text.
Specifically, this study aimed at creating items related to the CK required of the teacher by the new curriculum and new approaches to statistics education and designing items related to the PCK demanded by this new curriculum, that is, items that refer to teacher knowledge on content teaching and items that relate to teacher knowledge on the relationship between students and content in statistics, inference, and probability.
First, each item is linked to one of the areas of disciplinary content; second, each item is contextualized in a situation that contextualizes it and gives it meaning; and, third, each item requires the activation of certain teaching abilities and skills.
cognitive, epistemological, and didactic levels into account and sought to balance the following:
(A) statistical content in the curriculum referred to by the proposed problems or tasks (cognitive level);
(B) teaching skills that the teacher must use to connect his or her knowledge of the students with regard to statistics (cognitive and epistemic levels);
(C) teaching skills that trigger the use of effective mathematical-statistical representations (cognitive and didactic levels);
(D) teaching skills that the teacher must activate to adapt statistics to the grade level (didactic level).
Initially, statistical CK items were created; then, items that measure statistical PCK were created and refined. This bank of items related
to statistics, inference, and probability in the framework of the elementary school curriculum in Chile was repeatedly tested and modified on several occasions.
The tool integrates problems and/or contextualized situations, and it is a mixed questionnaire consisting of 10% open-ended questions and 90% multiple-choice questions.
When creating the items, problems were adapted to the local, cognitive, and psychological reality of the students, to the grade level at which the teacher must teach, and according to the statistics section within the Chilean curriculum (MINEDUC, 2009). International research and testing items explicitly constructed to enable statistical thinking and reasoning were used (see Table I). These items included making conjectures based on problem data, reflecting, generalizing,
Table I- Characteristics of the initial instrument according to content, taxonomy of graph understanding, cognitive level of learning, PCK category and type of transnumeration
Curriculum Graph comprehension
process
Learning Cognitive Level
PCK
Category Transnumeration
Item and
Context Author Content
Reading the da
ta
Reading between
da
ta
Reading beyond
the da
ta
literac
y
reasoning thinking
PCK
- T
eaching
PCK - Students Representa
tion
transla
tion
1 Candies Estrella 2010 Gr to Te
2 Tom Watson 2003 Gr to Te
3 Books Estrella 2010 Gr to Te
4 Dog-Cat Estrella 2010 Te to Ta
5 Roulette spin Torok 2000 Te to Gr
6 Roulette Torok 2000 Gr to Te
7 Olympics Garret 2005 Gr to Te
8 Polls PISA 2003 Te
9 Publicity TIMSS 2007 Te
10 Stu.talk GARFIELD 2003 Ta to Te
11 Stu. weight Liu 1998 Ta to Te
12 Course A, B TIMSS 2007 Gr to Te
13 Coins Fischbein 1997 Te
14 Born Fischbein 1997 Te
15 Lottery Fischbein 1997 Te
16 Dice Fischbein 1997 Te
17 Earthquake PISA 2003 Te
18 Trees a TIMSS 2007 Ta to Gr
19 Trees b SERCE 2009 Ta to Gr
20 Pets Sorto 2004, 2009 Ta to Te
Source: Estrella (2010).
and formalizing to solve the problem. When building the distractors for the multiple-choice items, the challenges and recurrent errors of the subjects identified in the literature were included. Some of the judges’ comments and the pilot tests with students and teachers in initial and continuing education contributed significantly to clarifying this task.
Content Validation Results
Content validity typically involves expert judgment that evaluates the appropriateness of test items in relation to the area of knowledge or performance to be measured. In this case, the specified and previously established criteria include the content and pedagogical knowledge
of teachers who teach statistics in primary schools since the curriculum changes.
To ensure content validity, this study used the ratio of content validity V by Aiken (1985). This procedure states that, to consider that an item is valid, 7 out a group of 8 judges must agree, using a dichotomous scale (approve or disapprove of the item in one aspect of the construct) and reaching a V coefficient equal to or greater than 0.88 at a level of statistical significance of p < 0.05 .
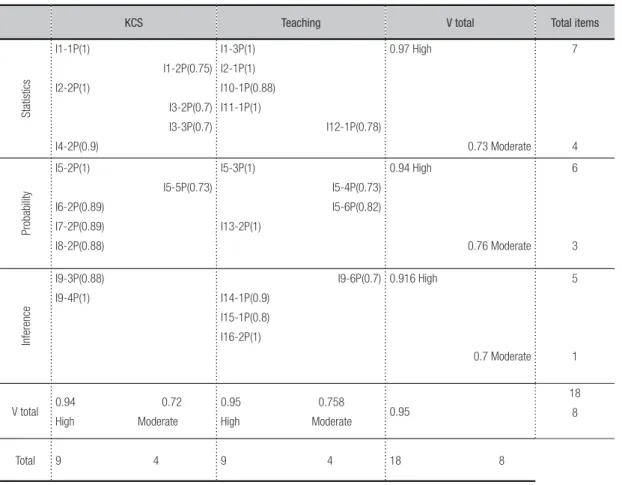
Table II shows item codes, sub-item numbers, Aiken’s V coefficients associated with PCK, KCS, and teaching, and the area of statistics covered, with high (V equal to or greater than 0.88) and moderate (V equal to or greater than 0.7 and less than 0.88) criteria (AIKEN, 1985).
Table II- Aiken’s V coefficients for each item with high criterion and p < 0.05 and total V coefficients, (including item information with moderate judge criteria)
KCS Teaching V total Total items
Sta
tistics
I1-1P(1)
I1-2P(0.75)
I2-2P(1)
I3-2P(0.7)
I3-3P(0.7)
I4-2P(0.9)
I1-3P(1)
I2-1P(1)
I10-1P(0.88)
I11-1P(1)
I12-1P(0.78) 0.97 High
0.73 Moderate 7
4
Proba
bility
I5-2P(1)
I5-5P(0.73)
I6-2P(0.89)
I7-2P(0.89)
I8-2P(0.88)
I5-3P(1)
I5-4P(0.73)
I5-6P(0.82)
I13-2P(1)
0.94 High
0.76 Moderate 6
3
Inference
I9-3P(0.88)
I9-4P(1)
I9-6P(0.7)
I14-1P(0.9)
I15-1P(0.8)
I16-2P(1)
0.916 High
0.7 Moderate 5
1
V total 0.94 0.72 High Moderate
0.95 0.758
High Moderate 0.95
18
8
Total 9 4 9 4 18 8
For KCS, teacher knowledge in relation to student knowledge, it was found that, of the 9 sub-items that comprise this dimension, 4 reach a V of 1.00 with the high criterion and 5 reach a V greater than 0.88, with a total V of 0.94.
In the teaching dimension, it was found that 6 of the 9 sub-items comprised this dimension and met the high criterion, reaching a V of 1.00, while 3 sub-items reached a V greater than 0.88, with a V total of 0.95.
For these reasons, content validity of this evaluative instrument presents 18 sub-items with a high criterion, such that they evenly integrate statistical topics from the curriculum and Shulman’s theoretical construct. Specifically, the instrument consists of 7 statistical sub-items, 6 on probability, and 5 on inference. With regard to the PCK construct, it comprises 9 sub-items related to KCS and 9 for teaching (see Table II).
Results
Analysis of 2 Items in the Instrument: Pet Item and Student Item
Two items from the questionnaire that detail the topics covered and the dimensions listed above are presented below. In addition, the expected answer to the item and the replies provided by the subjects of the study are specified.
Pet Item and Tables
This item integrates topics in descriptive statistics and involves the first 2 levels of graph comprehension. It includes literacy and statistical reasoning features according to cognitive levels and the transnumeration process that goes from text to counting and then to tabular representation.
Item 1. John asked his classmates if they had a dog or cat as a pet. He used a to mark each classmate’s pet and collected the following information:
Dogs and cats belonging to my classmates
Héctor dog cat Karla dog cat Rocío dog cat
Matías dog cat María dog cat Diego dog cat
Anita dog cat Keiko dog cat Consuelo dog cat
Tatiana dog cat Fran dog cat Isabel dog cat
Juan dog cat Yanet dog cat Seba dog cat
To complete the table, John received the help of some friends.
Which is the right option?
Please mark the choice with the values included in this table.
a) has a dog does not have a dog
has a cat 2 6
does not have a cat 5 2
b) has a dog does not have a dog
has a cat 2 5
does not have a cat 6 2
c) has a dog does not have a dog
has a cat 8 7
does not have a cat 6 2
d) Other
Source: Estrella (2010).
This item was designed based on a typical pet context (dogs/cats) to assess the steps taken from counting and text to tabular representation. It intended to detect the logical level of understanding when using double entry tables and the confusion between juxtaposed lists in double entry tables.
Representation type: double entry table
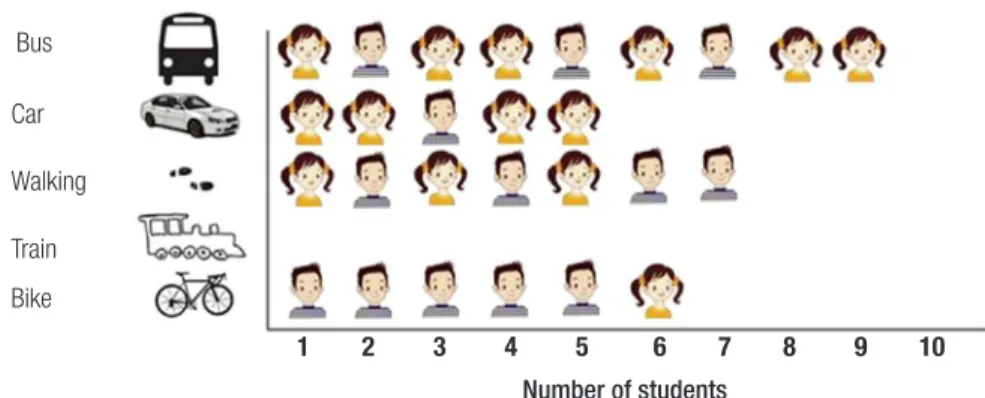
In the context of how students get to school, this item corresponds to a graph with pictograms related to topics of inference. Below is a graph with multiple horizontal bars that distinguishes the qualitative gender variable. This item is taken from Watson and Kelly (2003, p. 722), with language and graph slightly modified.
Representation: multiple horizontal bar graph using pictograms
Curriculum Content: “(Level 2) Problem solving that requires extracting information from [ …] pictograms, which contain quantitative data extracted from the school environment… to respond to questions raised. Register Mobility: From List to Double
Entry Table, rom Context to Model and Vice Versa Item 1 requirement. (Descriptive statistics content knowledge). To interpret qualitative data collection. To identify and extract quantitative data from qualitative data (counting). Read and interpret the headers of double entry tables. To sort data and complete the table with quantitative data.
Expected answer to item 1. Answer (b) is correct. The (a) distractor entails not considering that the data obtained from counting responds to 2 variables – having or not having a type of pet; it specifically considers 8 dogs but does not subclassify into yes/no cat; thus, 2 + 6 = 8. The (c) distractor is aimed at those who read/complete double entry tables by columns, therefore marking both boxes “You have a dog” with the value of 8 from the count, and/or added
up “does not have dog” category independently from yes/no “has cat”, thus 5 + 2 = 7.
Pet Item and Tables Results
After applying this instrument to 85 teachers and approximately 1000 students from the 4th and 7th grades — the students of these teachers — only 51% of teachers
correctly answer the question “Which is
the right option?” This item did not require constructing or interpreting the chart, or looking for associations, but the process of completing the table required subjects to count according to each variable category. With regard to the students answering this item, only 18% of them from the 4th grade (n = 454) and 15% of 7th grade students (n = 540) answered correctly.
Figure 1- students and grafic.
How students arrive to school today
Bus
Car
Walking
Train
Bike
Number of students
1 2 3 4 5 6 7 8 9 10
i) “Tom is coming by train because there is nothing next to the train so it must be him” ii) How to take the student understanding to a higher level?
(Level 5) Study of variable behavior or trends by reading graph [ …] Description of events in everyday and playful situations and arguing on the possibility of their occurring. (Level 6) [ …] estimating probability of occurrence of an event as the ratio between the number of times in which the event occurred and the number of repetitions of the experiment [ …] (Level 7) Prediction regarding probability of occurrence of an event in a simple random experiment and contrasting them by calculating the relative frequency associated with that event and the interpretation of this frequency based on its decimal formats, as a fraction and a percentage.”
Register mobility: from graph to text, from model to context and vice versa
Questions i and ii involve PCK: the first question corresponds to the teaching dimension, the curriculum category, and the second question corresponds to the dimension of teacher knowledge with respect to student knowledge (KCS), the difficulties category.
Expected Answers to Items i and ii
i. Correct answers fully link elements from curricular content from the “data and randomness” axis regarding scenarios of uncertainty from level 5 to level 8 or related to inference in levels 6 to 8. Half correct, if terms such as frequency, fractions, and ratios are used but not connected. In incorrect responses, students mark the pictogram concepts and the reading of the graphics as do not know or do not answer.
ii. Correct answers would include questions similar to the following: could he come by walking?, or by bus?, how do the majority come?, and the minority? Correct answers would also include “the chart displays all possible ways to get to school and not necessarily all of them are used” or counting the number of students that come in each means of transport. Wrong answers include those that do not make sense, marking do not know or do
not answer, or providing the correct solution without addressing the student’s difficulties.
Results of Student Item and Graph
A total of 29% of teachers responded properly to item ii.
Item ii puts teachers in a school scenario where students turn in an incorrect interpretation of the information read from the
graph, “Tom will come to school by train because
there is nothing next to the train, so it must be him.” This scene prompts teachers to give feedback to overcome the student’s difficulty:
How would I bring student understanding to a higher level?
Item ii results show that at least 70% of teachers present difficulties in responding to a situation related to student difficulties when interpreting a horizontal bar graph using pictograms. Some of the incorrect and ambiguous answers given by the teachers were: “Considering personal experience,” “I would teach him/her to interpret the graph and analyze it”, “I would ask if there is a train station near the school.” These responses manifest the need to present this type of situation to teachers so that they acquire the capacity to analyze the graphs interpretively and to value the information provided by the data and the utility of statistics in situations of uncertainty.
Discussion and projections
The construction of an instrument on the PCK of statistics among primary school teachers is presented in this study. The paper also provided the results from 2 items, an item related to descriptive statistics and an item addressing inference, an item using a graph and an item using a tabular representation.
constructing, and completing simple tables (DUVAL, 2003; ESTRELLA, 2014; GABUCIO et al., 2010). Chilean teachers’ weak results can be explained by their lack of study and teaching practice regarding this type of content, in addition to not possessing experience and access to information that would provide some insight on the difficulties of understanding typical statistical formats. These outcomes are worrisome, given that teachers are determining factors in student achievement.
Students’ low performance are also expected because only recently has the teaching and learning of statistics become a cross-cutting theme throughout schooling. Creating, reading, and interpreting graphs and tables is part of the statistical literacy that is achieved in schooling, and these contents are stated in the curriculum but have not yet entered the classroom.
Current and future teachers must learn the skills to critique, build, and analyze the statistical representations proposed by the curriculum. This knowledge will allow them to produce teaching situations that enhance the learning of statistics.
When one considers the curriculum changes in Chile in 2009, the introduction of statistics and probability into the curriculum comes with at least a decade of delay in comparison to other countries. In the analysis conducted on this curriculum, we detected the absence of the concept of variability and the tangential treatment of other concepts, such as the concepts of variables and randomness. Additionally, no explicit intention of linking statistics with probability was found, despite the fact that this link may help in understanding and integrating inferential statistics.
As projections of this study, we believe that, in addition to the use of the instrument as an evaluation tool, reading and analyzing these instruments in initial teacher training or continuing education courses would develop awareness of the complexity faced by a mathematics teacher in the task of teaching statistics.
We propose that teacher trainers share the results of statistical education research and activities linked with item generation in statistics and probability as an example of proactive learning. Creating questions helps future teachers to focus on statistical knowledge, confronting their understanding of stochastic phenomena and their beliefs on teaching statistics. Simultaneously, creating alternative responses allows them to test their understanding of systematic errors made by students and the use of representations and the creation of contexts, among others.
On the other hand, creating PCK items related to the curriculum, cognitive levels, graph comprehension, and transnumeration (the statistical education concepts specified in this study) would allow teachers to see beyond content. Within a peer discussion space, they could face and reflect on their ideas concerning teaching and understanding the relationship between students and statistical knowledge.
The ideas shared here regarding item creation and teacher learning must be tested in future research. While creating items as a teacher training activity involves the interconnection of different disciplinary spheres, statistical PK, and current perspectives in statistical education, its potential to develop — among current or future teachers — a didactic perspective on one’s own actions while teaching knowledge must be seen.
References
AIKEN, Lewis. Three coefficients for analyzing the reliability and validity of ratings. Educational and Psychological Measurement, USA, v. 45, n. 1, p. 131-142, 1985.
AOYAMA, Kazuhiro. Investigating a hierarchy of students’ interpretations of graphs. International Electronic Journal of Mathematics Education, Gazi, Turkey, v. 2, n. 3, p. 298-318, 2007.
BAILLÉ, Jacques; VALLÉRIE, Bernard. Quelques obstacles cognitifs dans la lecture des représentations graphiques élémentaires. Les Sciences de L’éducation pour L’ère Nouvelle, France, v. 1, n. 3, p. 73-104, 1993.
BALL, Deborah; HILL, Heather; BASS, Hyman. Knowing mathematics for teaching: Who knows math well enough to teach third grade and how can we decide? American Educator, Michigan, v. 29, p. 14-22. 2005.
BALL, Deborah; THAMES, Mark; PHELPS, Geoffrey. Content knowledge for teaching: what makes it special? Journal of Teacher Education, Washington, v. 59, n. 5, p. 389-407, 2008.
BATANERO, Carmen. Didáctica de la Estadística. Granada: Grupo de Investigación en Educación Estadística, 2001. Retrieved from: <www.ugr.es/~batanero/ARTICKLOS/didacticaestadistica.pdf>. Access: ago. 2014.
BATANERO, Carmen. Significados de la probabilidad en la educación secundaria. Revista Latinoamericana de Investigación en Matemática Educativa, Relime, México, v. 8, n. 3, p. 247-263, 2005.
BEN-ZVI, Dani; GARFIELD, Joan. Statistical literacy, reasoning, and thinking: goals, definitions, and challenges. In: GARFIELD, Joan; BEN-ZVI, Dani (Eds.). The challenge of developing statistical literacy, reasoning and thinking. Dordrecht: Kluwer, 2004. p. 3 -16.
BERTIN, Jacques. Semiologie Graphique. Paris: Gauthier-Villars, 1967.
BROUSSEAU, Guy. Théorie des situations didactiques. Grenoble: La Pensée Sauvage, 1998.
BROUSSEAU, Guy. Alternatives en didactique de la statistique. In : JOURNÉES DE STATISTIQUE, 41. Bourdeux, 2009. 41èmes journées de statistique. Bordeaux, France: IUFM Aquitaine, 2009. Retrieved from: <http://hal.inria.fr/docs/00/38/66/26/PDF/ p71.pdf>. Accesa: sep. 2014.
BROUSSEAU, Guy; BROUSSEAU Nadine; WARFIELD, Virginia. An experiment on the teaching of Statistics and probability.
Journal of Mathematical Behavior, USA, v. 20, p. 363-441, 2002.
BURGESS, Timothy. Investigating the nature of teacher knowledge needed and used in teaching Statistics, 2007. 251 p. Doctoral thesis (Department of Education), Massey University Palmerston North, New Zealand, 2007.
CHANCE, Beth. Components of statistical thinking and implications for instruction and assessment. Journal of Statistics Education, USA, v. 10, n. 3, 2002. Retrieved from: <http:// www.amstat.org/publications/jse/v10n3/chance. html>. Access: sep. 2014.
CHICK, Helen. Transnumeration and the art of data representation. Mathematics education research: innovation, networking, opportunity. 2003. ANNUAL CONFERENCE OF MERGA, 26, 2003, Melbourne. Proceedings of the 26th… Melbourne: Deakin University Press, 2003,v. 1, p. 207-214.
CURCIO, Frances. Developing graph comprehension: elementary and middle school activities. Reston, VA: NCTM, 1989.
DEL PINO, Guido; ESTRELLA, Soledad. Educación estadística: relaciones con la matemática. Pensamiento Educativo, Revista de Investigación Educacional, Santiago de Chile, v. 49, n. 1, p. 53-64, 2012.
DUVAL, Raymond. Comment analyser le fonctionnement representationnel des tableaux et leur diversite? SPIRALE - Revue de Recherches en Éducation, France, v. 32, p. 7-31, 2003.
ESTRELLA, Soledad. Conocimiento pedagógico del contenido y su incidencia en la enseñanza de la estadística, nivel de 4º a 7º año de educación básica, 2010, 267 p. Tesis (Magister) - Programa de Magister en Didáctica de la Matemática, Valparaíso: Pontificia Universidad C a t ó l i c a d e C h i l e , 2010.
ESTRELLA, Soledad. El formato tabular: una revisión de literatura. Revista Actualidades Investigativas en Educación, Costa Rica, v. 14, n. 2, p. 1-23, 2014.
ESTRELLA, Soledad; OLFOS, Raimundo. La taxonomía de comprensión gráfica de Curcio a través del gráfico de Minard.
Revista Educación Matemática, México, v. 24, n. 2, p. 119-129, 2012.
FISCHBEIN, Efraim; SCHNARCH, Ditza. The evolution with age of probabilistic, intuitively based misconceptions. Journal for Research in Mathematics Education, Reston: NCTM, v. 28, n. 1, p. 96-105, 1997.
FRANKLIN, Christine;GARFIELD, Joan. The guidelines for assessment and instruction in Statistics education (GAISE) project: developing Statistics education guidelines for pre K-12 and college courses. In: BURRILL, Gail. (Ed.). Thinking and reasoning about data and chance: sixty-eighth NCTM Yearbook. Reston, VA: NCTM, 2006. p. 345-375.
FRIEL, Susan; CURCIO, Frances; BRIGHT, George. Making sense of graphs: critical factors influencing comprehension and instructional implications. Journal for Research in Mathematics Education, Reston: NCTM, v. 32, n. 2, p. 124-158, 2001.
GABUCIO, Fernando et al. Niveles de comprensión de las tablas en alumnos de primaria y secundaria. Cultura y Educación,
España, v. 22, n. 2, p. 183-197, 2010.
GARFIELD, Joan. The challenge of developing statistical reasoning. Journal of Statistics Education, Alexandria, VA, v. 10, n. 3, 2002.
GARFIELD, Joan. Assessing statistical reasoning. Statistical Education Research Journal, New Zealand: University of Auckland, v. 2, n. 1, p. 22-38, 2003.
GARFIELD, Joan; BEN-ZVI, Dani. How students learn Statistics revisited: a current review of research on teaching and learning Statistics. International Statistical Review, UK and USA: International S t a t i s t i c a l Institute, v. 75, n. 3, p. 372-396, 2007.
GARRETT, A l e x a n d r e ; GARCÍA, J u a n . Un cuestionario y estrategias sobre los promedios. Formación del Profesorado e Investigación en Educación Matemática, España: Universidad d e La Laguna, v. 7, p. 197-217, 2005.
GROTH, Randall. Toward a conceptualization of statistical knowledge for teaching. Journal for Research in Mathematics Education, Reston, VA: NCTM, v. 38, p. 427-437. 2007.
HILL, Heather et al. Validating the ecological assumption: the relationship of measure scores to classroom teaching and student learning. Measurement: Interdisciplinary Research and Perspectives, London, v. 5, n. 2-3, p. 107-118, 2007.
HILL, Heather; BALL, Deborah; SHILLING, Stephen. Unpacking pedagogical content knowledge, conceptualizing and measuring teachers topic specific knowledge of students. Journal for Research in Mathematics Education, Reston, VA: NCTM, v. 39, n. 4, p. 327-400, 2008.
LIU, Hui-Ju Carol. A cross-cultural study of sex differences in statistical reasoning for college students in Taiwan and the United States, 1 998. 200 p. Doctoral Thesis, University of Minnesota, Twin Cities, Department of Educational Psychology, Minneapolis, 1998.
MA, Liping. Conocimiento y enseñanza de las matemáticas elementales: la comprensión de las matemáticas fundamentales que tiene los profesores en China y los EE.UU. Santiago de Chile: Academia Chilena de Ciencias, 2010.
MINEDUC. Propuesta ajuste curricular: objetivos fundamentales y contenidos mínimos obligatorios en el sector de matemática. Santiago de Chile: Ministerio de Educación, 2009.
OLFOS, Raimundo; ESTRELLA, Soledad. Conocimiento pedagógico del contenido y su incidencia en la enseñanza de la estadística, nivel de 4º a 7º año de educación básica: informe proyecto CIE-05. Santiago de Chile: CIAE, 2011.
ORIOL, Jean-Claude. Formation à la statistique par la pratique d’enquêtes par questionnaires et la simulation: étude didactique d’une expérience d’enseignement dans un département d’IUT. 2007, 277 p. Tesis (Doctoral) - Université Lumière Lyon 2, Ecole Doctorale EP C, Institut de Sciences et Pratiues de l Education et de la Formation, Lyon, 2007.
PINTO SOSA, Jesús Enrique. Conocimiento didáctico del contenido sobre la representación de datos estadísticos:
estudios de casos con profesores de estadística en carreras de psicología y educación. 2010. 436 p. Tesis (Doctoral) - Programa de Doctorado en Educación Matemática. Universidad de Salamanca, Departamento de Didáctica de la Matemática, Salamanca, 2010.
PISA 2003. Programme for International Student Assessment. Released items: technical report. OECD, 2005. Retrieved from: <http://www.pisa.oecd.org/document/31/0,3746,en_32252351_32236191_41942687_1_1_1_1,00.h tml>. Access: sep. 2014.
SHAUGHNESSY, Michael; GARFIELD, Joan; GREER, Brian. Data handling. In: BISHOP, Alan et al. (Eds.). International handbook of mathematics education. Dordrecht: Kluwer Dordrecht: Kluwer, 1996. p. 205-237.
SHAUGHNESSY, Michael. Research on statistical learning and reasoning. In: LESTER, Frank K.J. (Ed.). Second handbook of research on mathematics teaching and learning. Charlotte, NC: Information Age, 2007. p. 957-1009.
SHULMAN, Lee. Those who understand: knowledge growth in teaching. Educational Researcher, UK, v. 15, n. 1, p. 4-14, 1986.
SHULMAN, Lee. Knowledge and teaching: foundations of the new reform. Harvard E d u c a t i o n a l Review, Massachusetts, v. 57, n. 1, p. 1-22, 1987.
SORTO, Maria Alejandra. Prospective middle school teachers’ knowledge about data analysis and its application to teaching. 2004. 608 p. Doctoral Thesis - Michigan State University, Department of Mathematics, Michigan, 2004.
SORTO, Maria Alejandra et al. Teacher knowledge and teaching in Panama and Costa Rica: a comparative study in primary and secondary education. Revista Latinoamericana de Investigación en Matemática Educativa, México, v. 12, n. 2, p. 251-290, 2009.
STOHL, Hollylynne. Probability in teacher education and development. In: JONES, Graham. Exploring probability in school:
challenges for teaching and learning. New York: Springer, 2005. p. 345-366.
TIMMS - Third International Mathematics and Science Study. Released items. Massachusetts: Boston College, 2007. Retrieved from: <http://timss.bc.edu/ timss2007/context.html>. Access: sep. 2014.
TOROK, Rob; WATSON, Jane. Development of the concept of statistical variation: an exploratory study. Mathematics Education Research Journal, Springer, v. 12, n. 2, p. 147-169, 2000.
WILD, Chris; PFANNKUCH, Maxine. Statistical thinking in empirical enquiry. International Statistical Review, Mexico, v. 67, n. 3, p. 223-265, 1999.
Received on: 25.03.2014
Approved on:26.06.2014
Soledad Estrella is an associate professor of the Mathematics Institute of the Pontificia Universidad Católica de Valparaíso, Chile.
Raimundo Olfos is a full professor of the Mathematics Institute of the Pontificia Universidad Católica de Valparaíso, Chile, and a researcher at the Center for Advanced Research on Education, CIAE, PUCV.