Performance of geosynthetic-reinforced alternative
sub-ballast material in a railway track
G. Fernandes
1, E. M. Palmeira
2and R. C. Gomes
31Federal University of Ouro Preto, Department of Civil Engineering—School of Mines, 35400-000 Ouro Preto, MG, Brazil, Telephone: +55 31 35591558, Telefax: +55 31 35591548,
E-mail: [email protected];
2University of Brası´lia, Department of Civil and Environmental Engineering-FT, 70910-900 Brasilia, DF, Brazil, Telephone: +55 61 3273 7313 ext. 217, Telefax: +55 61 3273 4644,
E-mail: [email protected]
3Federal University of Ouro Preto, Department of Civil Engineering—School of Mines, 35400-000 Ouro Preto, MG, Brazil, Telephone: +55 31 3559153, Telefax: +55 31 35591548, E-mail: [email protected] Received 4 December 2007, revised 10 February 2008, accepted 13 February 2008
ABSTRACT: Geosynthetics have been used as reinforcement in various applications in geotechnical engineering. This paper presents a study on the use of geosynthetic reinforcement to reduce the consumption of good-quality sub-ballast material in a railway track in the state of Minas Gerais, Brazil. Six test sections on the railway were instrumented and monitored for a period of 2 years. Nonwoven geotextile and a geogrid were used as reinforcement in different positions in the sub-ballast. The results obtained showed that the presence of geosynthetic reinforcement reduced the strains mobilised in the sub-ballast, reduced the breakage of ballast element, and allowed the use of a cheaper alternative material in the sub-ballast construction. The results showed the potential of the use of alternative sub-ballast material reinforced with geosynthetic to reduce the costs of construction and maintenance of railway tracks.
KEYWORDS: Geosynthetics, Reinforcement, Railway track, Alternative sub-ballast material
REFERENCE: Fernandes, G., Palmeira, E. M. & Gomes, R. C. (2008). Performance of geosynthetic-reinforced alternative sub-ballast material in a railway track.Geosynthetics International,15, No. 5, 311–321. [doi: 10.1680/gein.2008.15.5.311]
1. INTRODUCTION
Geosynthetics have been used as reinforcement in various applications in geotechnical engineering, such as retaining walls, steep slopes, and embankments on soft soils. How-ever, a potential field of application of geosynthetics that is not well explored is as reinforcement or separators in railways. In comparison with other applications, in this type of work the geosynthetic is subjected to very severe conditions, owing to the mechanically aggressive charac-teristics of the fill (ballast) and to the high load levels transmitted by the trains. Nevertheless, the use of geosyn-thetic reinforcement in railways can reduce the develop-ment of permanent strains, increase track lifetime, and reduce maintenance costs.
Geotextiles have been used in maintenance works in railways as separators or drains in regions of soft subgrade or shallow groundwater level, or for seepage control (Raymond 1985; Selig and Waters 1994; Arruda Filho 1997). The geotextile can be placed at different elevations in the track structure, such as the ballast top, between ballast and subgrade, between ballast and sub-ballast, or
between sub-ballast and subgrade, depending on the structural configuration of the track (Selig and Waters 1994). Benefits from the use of nonwoven geotextiles in railway tracks have been reported by Raymond (1999) and Salim (2004), for instance.
Atalaret al.(2001) performed laboratory model tests on ballast with inclusions of geogrids and geotextiles, and found reductions of track settlement due to the presence of the geosynthetic reinforcement. Similar tests were performed by Bathurst and Raymond (1987), Go¨bel et al.
(1994) and Raymond (2002), who also found the bene-ficial effects of the geosynthetic reinforcement in reducing track deformation. Indraratna et al. (2007) observed that the presence of geosynthetic reinforcement reduced track settlements and particle breakage, particularly for tracks made of recycled ballast. Cuconatto (1997) monitored sections of an urban railway where geotextiles and geocells were used, and a good performance of these sections was observed, in comparison with the traditional track solutions. Rowe and Jones (2000) recommended the use of a geocomposite capable of providing ballast
forcement and separation between ballast and subgrade, and this can be accomplished by the combined use of a geogrid and a geotextile.
The aggressiveness of the ballast has to be considered in railway applications, because of the possibility of mechanical damage of the geosynthetic inclusion. Selig and Waters (1994), Raymond and Bathurst (1990), Ashpiz
et al. (2002) and Nancey et al. (2002) have reported different levels of geosynthetic mechanical degradation with time, depending on the characteristics of the track. Raymond (1999) found that geotextiles with a mass per unit area below 500 g/m2 failed after 5 years of service, partially because of incorrect installation. Because of the nature of the fill material, and the high load levels, measures may have to be taken to protect the geosynthetic layer against mechanical damage and to prolong its life-time in railway applications.
Another possible use of geosynthetic reinforcement in railways is in the combination of substandard or recycled ballast material and reinforcement in order to save construction and maintenance costs in this type of work. Indraratna et al. (2006) reported significant contributions of geosynthetic reinforcement for the reduction of settle-ments and particle breakage of a recycled ballast material. In this context, Minas Gerais is the most important state in Brazil with regard to mining activities. Most of the mining production is transported by trains, which subject the track to very high loads, resulting in a need for continuous maintenance works. Because of this, good, expensive ballast materials are required in railway con-struction and maintenance. However, the mining activity in the region generates a huge amount of waste, and some of this waste may present satisfactory mechanical proper-ties for use in railway tracks. The combination of this waste with geosynthetic reinforcement may provide a cheaper feasible technical alternative to the use of more expensive construction materials.
This paper describes the use of geosynthetic reinforce-ment and mining waste as a solution to reduce the use of more expensive sub-ballast materials in railways.
2. EXPERIMENTS
The experiment described in this paper was carried out in a segment of the Vitoria–Minas railway, in the state of Minas Gerais, Brazil. This railway is 104 years old, 898 km long, and is responsible for approximately 40% of the load transported by railways in the country. The main
objective of the research programme was to evaluate the potential use of geosynthetics as reinforcement and separators in railways, with an emphasis on the substitu-tion of part of the good-quality sub-ballast material by a combination of mining waste and geosynthetic reinforce-ment. For this study, experimental sections of that railway were constructed and instrumented.
The research described in this paper was conducted under real in-service conditions of the railway. In part, this limited some research activities that might disrupt the traffic of trains. However, in spite of that constraint, relevant data on the performance of the test sections were obtained.
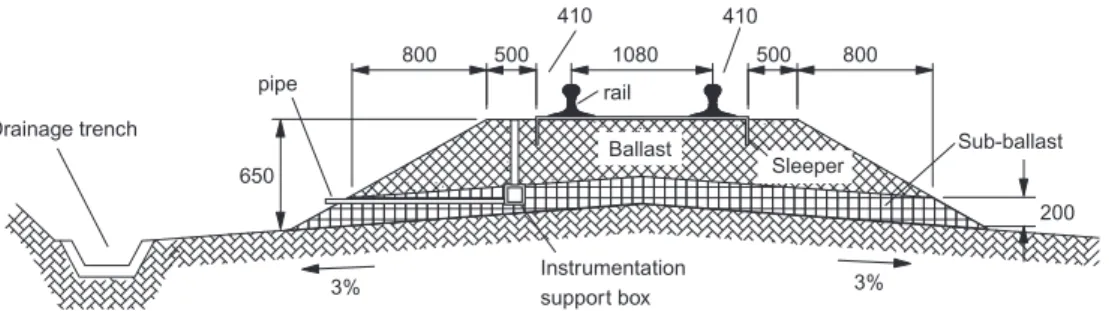
Six experimental railway test sections, each 25 m long, were constructed as part of the research programme. These sections are localised in Line 2 of the Variante Capitao Eduardo, Vitoria–Minas railway, between kilometres 40 and 42. This railway is intensely trafficked, with approxi-mately 16 compositions (2 locomotives of 160 t plus 100 wagons with approximately 100 t each: 300 kN axle load) daily. The steel sleepers are of type UIC865, with dimen-sions 2.2 m30.3 m30.02 m. The rail type is TR 68.
Figure 1 shows the geometrical characteristics of the instrumented sections, and Figure 2 shows a longitudinal profile of the experimental test sections (sections S1 to S6), where the location and types of geosynthetic materi-als used can be identified. All sections were composed of 450 mm of ballast and 200 mm of sub-ballast. Experimen-tal section 1 (the control section) was constructed follow-ing the traditional practice adopted in the region of usfollow-ing good-quality ballast material. In sections 2 to 5 an alternative sub-ballast material incorporating geosynthetics was employed. In section 6 the alternative ballast material was also used, but without the presence of a geosynthetic layer. The alternative sub-ballast material used in sections 2 to 6 was a mixture of the subgrade local soil (silty sand, average particle diameter 0.13 mm, 50% by weight), a fine mine waste (sandy silt, average particle diameter 0.032 mm, 25% by weight), and the traditional sub-ballast material used in section 1 (sandy gravel, average particle diameter 5.1 mm, 25% by weight). The same ballast material was used in all test sections.
Laboratory investigations on the materials used in the experimental sections included characterisation tests, soil characteristic curve tests, direct shear tests, scanning electronic microscopy, X-ray diffractometry, chemical analysis, Los Angeles abrasion tests, and point load tests (ASTM D 5731). For the control of construction of the
aaaaaaaaaaaaaaaaaaaaaaaaaaaaaaaaaaaaaaaaaaaaaaaaaaaaaaaaaaaaaaaaa aaaaaaaaaaaaaaaaaaaaaaaaaaaaaaaaaaaaaaaaaaaaaaaaaaaaaaaaaaaaaaaaa aaaaaaaaaaaaaaaaaaaaaaaaaaaaaaaaaaaaaaaaaaaaaaaaaaaaaaaaaaaaaaaaa aaaaaaaaaaaaaaaaaaaaaaaaaaaaaaaaaaaaaaaaaaaaaaaaaaaaaaaaaaaaaaaaa aaaaaaaaaaaaaaaaaaaaaaaaaaaaaaaaaaaaaaaaaaaaaaaaaaaaaaaaaaaaaaaaa
500
410 1080 500
800 800
pipe
650
Ballast Sub-ballast 200 rail
Sleeper
3% Instrumentation 3% support box
Drainage trench
410
sections, tests such as the in situ density sand cone test and the in situ stiffness test were performed. The latter consists in the determination of the soil stiffness in situ from its dynamic response using a GeoGauge H4140 apparatus, manufactured by Humboldt Scientific Ltd. This apparatus calculates ground stiffness based on successive measurements of ground surface displacements caused by the application of a constant cyclic compressive load. Good comparisons between the results of soil modulus from GeoGauge, cyclic triaxial tests and back-analysis from Benkelman beam tests are reported by Fernandes (2005). Soil samples were periodically taken from the track for characterisation and Los Angeles abrasion tests (for the ballast material).
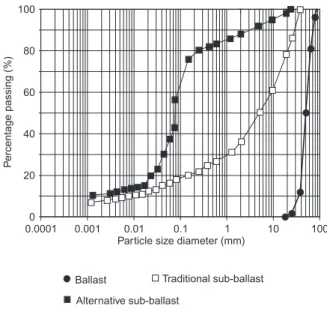
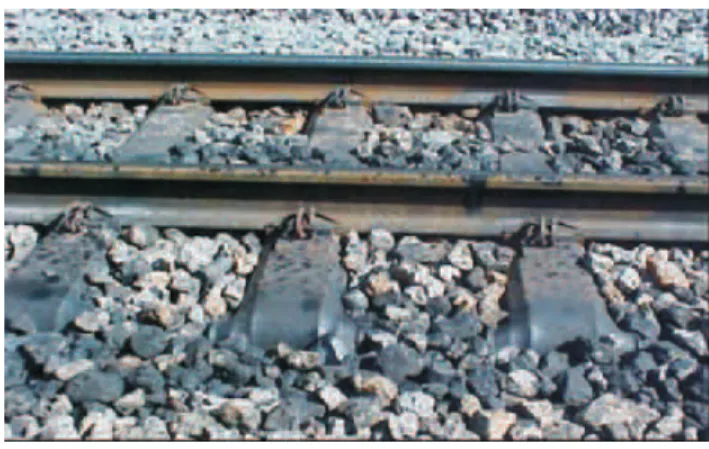
The characteristics of the ballast material used in all sections are presented in Table 1. Particle size distribution curves of the soils are presented in Figure 3. The charac-teristics of the sub-ballast materials used in the sections are presented in Table 2. The results in Figure 3 and Table 2 show that the sub-ballast material used in sections 2 to 6 is considerably finer that that used in the control section (section S1). By being finer, the sub-ballast material used in sections 2 to 6 is less mechanically aggressive to the geosynthetic layer. Figure 4 shows a typical view of the ballast elements, as well as the rails and sleepers.
The characteristics of the subgrade material in each section are presented in Table 2. Table 3 shows the geotechnical properties of the subgrade material obtained by field tests after compaction. The results of elastic moduli show that the subgrades of sections S5 and S6 are more compressible than those of sections S1 to S4.
A nonwoven needle-punched geotextile and a biaxial
grid were used in the test sections. The nonwoven geotextile is made of continuous filaments of polyester and has a mass per unit area of 300 g/m2. This geotextile was intended also to function as a separator in this application. Its mass per unit area can be considered rather low for railway applications. However, because of the rather short duration of the application, a lighter and cheaper product was chosen. As will be remarked later in this paper, even under these conditions significant damage was observed in exhumed geotextile specimens. The biaxial geogrid is also made of polyester fibres, with an HDPE cover. The main mechanical characteristics of the geosynthetics used are summarised in Table 4. The inter-face friction angle between the nonwoven geotextile and the sub-ballast material used in direct shear tests was 338, whereas for the geogrid the interface friction angle was 358.
The geosynthetic layer was installed at different posi-tions, depending on the section considered (Figure 2). The position of the geosynthetic in the sub-ballast layer was varied in order to investigate its influence on the track performance. In sections S2 and S3 the geogrid was installed at the base and at the top of the sub-ballast layer,
aaaaaaaa aaaaaaaa aaaaaaaa aaaaaaaa
aaaaaaaa aaaaaaaa aaaaaaaa aaaaaaaa
aaaaaaaa aaaaaaaa aaaaaaaa aaaaaaaa
aaaaaaaa aaaaaaaa aaaaaaaa aaaaaaaa
aaaaaaaa aaaaaaaa aaaaaaaa aaaaaaaa
aaaaaaaa aaaaaaaa aaaaaaaa aaaaaaaa
450 200
S1 S2 S3 S4 S5 S6 Geogrid
Nonwoven geotextile
Ballast Sub-ballast Subgrade
Figure 2. Longitudinal cross-section of instrumented test sections
Table 1. Characteristics of the ballast material
Shape Prismatic
Unit weight (kN/m3) 35.75
Water absorption (%) 1.13
D85 (mm) 67
D50 (mm) 51
D10 (mm) 34
Fraction of fines (,0.074 mm) 0
Unconfined compression strength (MPa) 156–166
Point load index,Is50 (MPa)a 7.9–8.3
Anisotropy index,Ia50 (dimensionless) 1.06
Los Angeles abrasion tests (%)b 10.4
Solubility in water No changes after 15 days of immersion in water
aAccording to ASTM D 5731. bBefore traffic.
0 20 40 60 80 100
P
ercenta
g
e passing (%)
Particle size diameter (mm)
0.0001 0.001 0.01 0.1 1 10 100
Ballast Traditional sub-ballast Alternative sub-ballast
Table 2. Characteristics of sub-ballast and subgrade materials
Section 1 Sections 2 to 6 Subgrade
Gsa 3.95 4.29 3.19
D85 (mm)b 24 0.9 5.7
D50 (mm) 5.1 0.076 0.13
D10 (mm) 0.0075 0.00081 0.006
Clay fraction (%)c 8 11 16
Silt fraction (%)c 35 31 19
Sand fraction (%)c 40 51 39
Gravel fraction (%)c 49 7 16
emind 0.26 0.11 0.878
emaxd 0.45 0.30 1.176
HRBe A-1.a A-2.4 A-5
USCe GW-GC SM SM
BPRe A-1/GIf ¼ 0 A-4/GI ¼ 1.4 A-4/GI¼ 2
Friction angle (degrees)g 37.5 41.8 42
Cohesion (kPa)g 0 0 0
CBR (%)h 125 106 65.7
ªdmax (kN/m3)i 25.4 27.3 17.1
wopt (%)j 12.2 9.5 24.7
Expansion (%) – – 0.21
aG
s: particle specific gravity. bD
n (n¼10, 50 or 85): diameter for which n (%) of the soil particles in weight are smaller than that
diameter.
cPercentage by weight. de
min andemax: minimum and maximum void ratios, respectively.
eSoil classification by the Highway Research Board, Unified Soil Classification System and Bureau of
Public Roads.
fGI: group index. gFrom direct shear tests.
hCBR: California Bearing Ratio obtained for intermediate compaction energy. iª
dmax: maximum dry unit weight obtained in compaction tests with intermediate compaction energy. jw
opt: optimum moisture content.
Table 4. Geosynthetics characteristics
Nonwoven geotextile Geogrid
Mass per unit area (g/m2) 300 430
Thickness (mm) 2.7 1–2
Tensile strength (kN/m)a 15 65
Maximum tensile strain (%)a 50–70 10
Tensile stiffness (kN/m) 42–281b 520c
Grid aperture dimensions (mm) – 30330
aFrom wide-width tensile tests according to ASTM D 4595.
bFirst value is from tests in isolation; second value is secant tensile
stiffness at 5% tensile strain obtained in tests on geotextile confined by alternative ballast material under confining stress of 220 kPa (test equipment described in Mendes and Palmeira 2007).
cSecant tensile stiffness for a strain of 5%.
Figure 4. View of the ballast material, rail and sleepers
Table 3. Results of in situ tests on the subgrade after compaction
S1 S2 S3 S4 S5 S6
ªdmax (kN/m3) 16.59 16.76 23.28 23.30 23.28 16.50
Degree of compaction (%) 100.2 101.3 101.1 101.0 101.2 100.7
Elastic modulus (MPa)a 109.7 100.8 111.8 106.8 88.1 99.5
respectively, as shown in Figure 2. In sections S4 and S5 the nonwoven geotextile was installed at the top and at the base of the sub-ballast, respectively.
Monitoring of the sections’ performance was achieved by the installation of soil deformation gauges at the top and bottom of the ballast material. The soil deformation gauges were 100 mm long and consisted of extensible electric resistances (strain gauges) fixed to circular plates at the ends (Figure 5a). The deformation gauges were calibrated in the laboratory buried in the sub-ballast material under the same conditions expected in the field. Temperature and moisture content gauges (CS615 Water Content Reflectometer, manufactured by Campbell Scien-tific Inc.) were also installed in the ballast and sub-ballast materials of the test sections. Benkelman beam tests (Figures 5b and 5c) were carried out on the test sections at different times during the experiments. For these tests a locomotive weighting 1600 kN with 200 kN/axle was employed. A rain gauge meter allowed for measurements of precipitation on the experimental sections.
Additional information on the materials and method-ology used is reported by Fernandes (2005).
3. RESULTS AND DISCUSSIONS
3.1. Track stiffness
In situ stiffness tests using the GeoGauge H4140 apparatus were carried out after the installation and compaction of
the sub-ballast material in each section to assess the significance of the presence of the geosynthetic for the elastic response of the system. Figure 6 shows the results obtained; it can be seen that the elastic modulus of the control section S1 was 165 MPa, and for the other sections it varied between 119 MPa and 154 MPa. The differences in the elastic moduli of the sections suggest a stiffer response of the sections with geogrid reinforcement (S2 and S3) in comparison with those with nonwoven geotex-tile. The sections with geogrid (S2 and S3) presented elastic moduli 5.8% and 29.7% greater than those with geotextiles (S4 and S5) for the geosynthetic at the sub-ballast top and base, respectively. Although these results may suggest a stiffer response of the geogrid-reinforced sections, the influence of variability of the soil properties of the test sections cannot be ignored. Table 3 shows that the subgrade in section S5 had the lowest elastic modulus (25% lower than that in section S1). Hence the differences between the elastic moduli of the sections after sub-ballast construction are likely to have been a consequence of varying subgrade properties rather than of the presence or absence of geosynthetic layers.
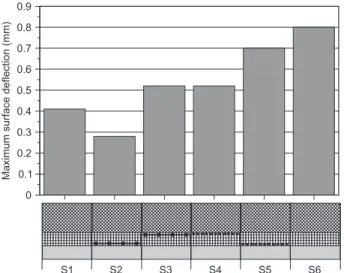
Figure 7 shows results of maximum surface deflections obtained in Benkelman beam tests on the sub-ballast material just after its installation and compaction. For these tests a loaded truck with a rear axle load of 82 kN was used. Sections S5 and S6 presented the largest surface deflections, which is consistent with the results obtained by the in situ stiffness test. However, for the magnitude of
(a)
(b) (c)
the displacements measured, the differences obtained are again likely to be a consequence of soil properties variability rather than the influence of the presence of geosynthetics.
After the test sections were completed, Benkelman beam tests were carried out on the superstructure (after installation of the ballast layer, UIC865 sleepers and TR 68 rails). For these tests, a two-car locomotive with eight axles each and a total weight of 1600 kN was employed. Figure 8 shows the vertical displacement profiles obtained for each section. Under the much higher load provided by the locomotive the results obtained suggest a marked influence of the presence of the geosynthetic layers on the performance of the alternative sub-ballast material. Sec-tion S6 (unreinforced alternative sub-ballast material) presented much higher vertical displacements than the other sections. With the exception of section S4, for all other reinforced sections the maximum vertical displace-ments were closer to or smaller than those obtained for section S1 (control section, with standard sub-ballast material, unreinforced). It is also interesting to notice that
the sub-ballast material (the alternative material) was the same in sections S2 to S6. Thus from Figure 8 it can be seen that the maximum vertical displacements obtained for the reinforced sections were between 2.3 and 4.4 times smaller than that obtained for the unreinforced section S6.
3.2. Measured strains
The mortality rate of instruments in railways is quite high, owing to the magnitude of the loads and the severity of the conditions to which they are subjected (Selig and Waters 1994). Even in highway pavements, where the conditions are less severe than in railways, the loss of instruments can be significant. Warren and Howard (2007) report losses of 18% of the instruments in test sections of a highway pavement constructed under well-controlled conditions. In this study, some instruments were damaged during the monitoring period, which limited the amount of data acquired. Nevertheless, the measurements made allow inferences to be drawn on the effectiveness of geosyn-thetics used in combination with the alternative sub-ballast material. Figure 9 shows the variation of horizontal strain at the bottom of the sub-ballast layer with the number of train axles that passed on sections S1, S3, S4 and S6. The measurements were made under the sleeper and on the vertical passing on the rail centreline (Figure 9). For up to 600 000 passages of train axles the performance of all sections was similar. Beyond this, sections S3 and S4
aaaaaaaaaaaaaaaaaaa aaaaaaaaaaaaaaaaaaa aaaaaaaaaaaaaaaaaaa aaaaaaaaaaaaaaaaaaa aaaaaaaaaaaaaaaaaaa aaaaaaaaaaaaaaaaaaa aaaaaaaaaaaaaaaaaaa aaaaaaaaaaaaaaaaaaa aaaaaaaaaaaaaaaaaaa aaaaaaaaaaaaaaaaaaa aaaaaaaaaaaaaaaaaaa aaaaaaaaaaaaaaaaaaa aaaaaaaaaaaaaaaaaaa aaaaaaaaaaaaaaaaaaa aaaaaaaaaaaaaaaaaaa aaaaaaaaaaaaaaaaaaa aaaaaaaaaaaaaaaaaaa aaaaaaaaaaaaaaaaaaa aaaaaaaaaaaaaaaaaaa aaaaaaaaaaaaaaaaaaa aaaaaaaaaaaaaaaaaaa aaaaaaaaaaaaaaaaaaa aaaaaaaaaaaaaaaaaaa aaaaaaaaaaaaaaaaaaa aaaaaaaaaaaaaaaaaaa aaaaaaaaaaaaaaaaaaa aaaaaaaaaaaaaaaaaaa aaaaaaaaaaaaaaaaaaa aaaaaaaaaaaaaaaaaaa aaaaaaaaaaaaaaaaaaa 0 50 100 150 200
Elastic modulus (MP
a)
S1 S2 S3 S4 S5 S6
Figure 6. System stiffness from in situ tests after construction of sub-ballast aaaaaaaaaaaaaaaaaaa aaaaaaaaaaaaaaaaaaa aaaaaaaaaaaaaaaaaaa aaaaaaaaaaaaaaaaaaa aaaaaaaaaaaaaaaaaaa aaaaaaaaaaaaaaaaaaa aaaaaaaaaaaaaaaaaaa aaaaaaaaaaaaaaaaaaa aaaaaaaaaaaaaaaaaaa aaaaaaaaaaaaaaaaaaa aaaaaaaaaaaaaaaaaaa aaaaaaaaaaaaaaaaaaa aaaaaaaaaaaaaaaaaaa aaaaaaaaaaaaaaaaaaa aaaaaaaaaaaaaaaaaaa aaaaaaaaaaaaaaaaaaa aaaaaaaaaaaaaaaaaaa aaaaaaaaaaaaaaaaaaa aaaaaaaaaaaaaaaaaaa aaaaaaaaaaaaaaaaaaa aaaaaaaaaaaaaaaaaaa aaaaaaaaaaaaaaaaaaa aaaaaaaaaaaaaaaaaaa aaaaaaaaaaaaaaaaaaa aaaaaaaaaaaaaaaaaaa aaaaaaaaaaaaaaaaaaa aaaaaaaaaaaaaaaaaaa aaaaaaaaaaaaaaaaaaa aaaaaaaaaaaaaaaaaaa aaaaaaaaaaaaaaaaaaa 0 0.1 0.2 0.3 0.4 0.5 0.6 0.7 0.8 0.9
Maximum surface deflection (mm)
S1 S2 S3 S4 S5 S6
Figure 7. Results from Benkelman beam tests on sections after construction of sub-ballast
0
1
2
3
4
0 1 2 3 4 5 6 7 8 9 10
S1 S3 S6 S2 S5 S4 Distance (m) Deflection (mm)
Figure 8. Vertical displacement profiles from Benkelman beam tests on superstructure
aaaaaaaaaaaaaaaaa aaaaaaaaaaaaaaaaa aaaaaaaaaaaaaaaaa aaaaaaaaaaaaaaaaa
1.00⫻105
6.00⫻105
1.10⫻106
1.60⫻106
2.10⫻106
2.60⫻106 0 2 000 4 000 6 000 8 000 10 000 12 000 14 000 16 000
Number of axles
Str ain ( ) µε S1 S3 S4 S6 Strain gauge
presented less horizontal strain than the control section S1. Section S6 (unreinforced alternative sub-ballast mate-rial) presented the highest horizontal strains at the base of the sub-ballast layer.
Figure 10 presents the variation of vertical strains at the base of the sub-ballast layer with the number of train axles. Not much difference in the results can be seen up to 100 000 train axles. As the traffic increases, section S6 tends to present the largest vertical strains, followed by section S1, although the latter shows signs of reduction on the rate of strain with traffic intensity. The same trend of reduction of the rate of strain with the number of train axles is observed for section S3 after the passage of 1 500 000 train axles.
3.3. Ballast degradation
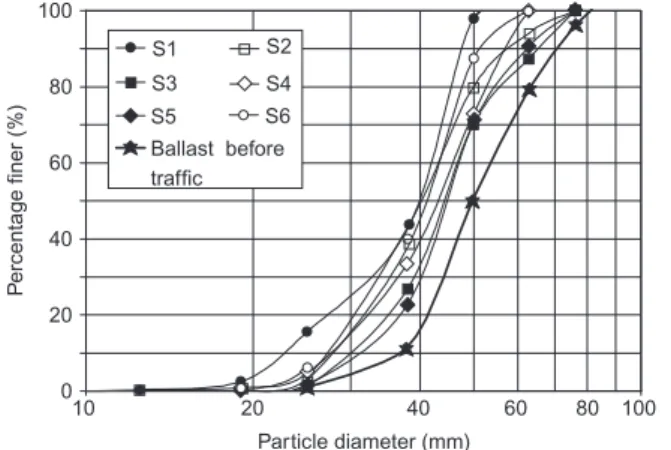
Samples of the ballast of the test sections were collected for testing during the monitoring period. Particle size distribution analyses and Los Angeles abrasion tests were conducted on the samples. Figure 11 shows the results of particle size distribution analyses after 600 days of monitoring, corresponding to a passage of 2 120 000 train axles or 75 860 070 t on the test sections. The particle size distribution of the ballast material before traffic is also shown, for comparison. The results show some level of degradation of the ballast material caused by the traffic of heavy trains. In comparison with the ballast particle size
distribution curve before traffic, the results obtained for sections S1 and S6 were the poorest. Among the rein-forced sections, section S2 (geogrid at the sub-ballast base) presented the greatest particle size reduction.
The breakage level of the ballast grains can be quanti-fied by the breakage index Bg (Marsal 1973), which expresses the percentage by weight of particles that have undergone breakage, and is defined as
Bg¼
Xn
1
˜Wki˜Wkf
ð Þ (1)
for values of ˜Wki ˜Wkf . 0, where Bg is the percentage by weight of the ballast that has undergone breakage,˜Wki is the initial fraction of the sample weight corresponding to a given range of ballast particles dimen-sions before breakage, ˜Wkf is the final fraction of the sample weight corresponding to a given range of ballast particles after breakage, andn is the number of ranges of particle dimensions for which˜Wki˜Wkf .0.
The variations of Bg with time for the experimental sections are shown in Figure 12. Up to 90 days of train traffic the values of Bg for the test sections were similar. After 600 days section S1 presented the greatest values of
Bg, followed by section S6: both of these were unrein-forced sections. Not much difference was observed among the values ofBg for sections S3, S4 and S5 after 600 days’ traffic. The result obtained for section S2 was slightly higher than those for the other reinforced sections after 600 days’ traffic. However, the authors believe that this difference lies within the scatter of results from this type of evaluation, because of the test limitations and the possible variability of ballast properties. These results suggest that the presence of the geosynthetic layers had a beneficial effect in reducing ballast breakage. This can in part be due to the increased lateral confinement of the railway track because of the presence of the reinforcement, as suggested by Lackenbyet al.(2007).
The fouling index (Selig and Waters 1994) provides an evaluation of the level of ballast contamination by fines, and is defined as the sum of the percentages of ballast masses passing through sieves number 4 (4.8 mm) and 200 (0.074 mm) in a particle size analysis. Section 1
aaaaaaaaaaaaaaaaa aaaaaaaaaaaaaaaaa aaaaaaaaaaaaaaaaa aaaaaaaaaaaaaaaaa
1.00⫻105
6.00⫻105
1.10⫻106
1.60⫻105
2.10⫻106
2.60⫻106 0
2 000 4 000 6 000 8 000 10 000
Number of axles
Str
ain (
)
µε
Strain gauge
S1 S3 S4 S6 12 000
Figure 10. Vertical strains at bottom of sub-ballast
100 80 60 40 20 0
10 100
Particle diameter (mm)
P
ercenta
g
e finer (%)
S1 S3
S6 S2 S5
S4 Ballast before traffic
20 40 60 80
Figure 11. Particle size distribution curves of ballast material after 600 days’ traffic
0 100 200 300 400 500 600 700 Time (days)
0 10 20 30 40 50 60
S1 S2
S3 S4
S5 S6
Bg
(%)
2.1 No. of axles ( 10 )⫻ 6
0.3 0.7 1.4
presented the highest fouling index value (0.42%) after 600 days’ traffic, although the results in Figure 11 yield values of fouling index below 1% for all sections. Accord-ing to Selig and Waters (1994), contamination of the ballast can be considered negligible for fouling index values below 1%.
Figure 13 shows the results obtained in Los Angeles abrasion tests on samples of the ballast material collected from the railway track, according to the Brazilian standard NBR 6465 for this type of test, which uses 12 steel spheres with a mass of 6 kg. The results of the tests varied between 6.4% and 8.3%. This variation of results is likely to be within the scatter of test results for the ballast used, and suggests that the different types of sub-ballast material and the presence of geosynthetics did not have a signifi-cant effect on the ballast strength as measured by the Los Angeles abrasion test.
The same sub-ballast (alternative) material was used in sections S2 to S6, S2 to S5 being reinforced sections and S6 unreinforced. Thus the influence of the presence of the reinforcement can be assessed by comparing the results obtained, using section S6 as a reference. Figure 14 presents the results obtained for maximum vertical dis-placements from Benkelman beam tests on the super-structure, ballast breakage index (Bg) and abrasion tests (Los Angeles abrasion test results after 600 days’ traffic) for sections S2 to S5. In this figure, the raw results obtained for sections S2 to S5 were normalised by the corresponding results obtained for section S6. The results in Figure 14 suggest that the presence of geosynthetic reinforcement in the alternative ballast material reduced the maximum vertical displacements in Benkelman beam tests by between 57% and 78% with respect to the value obtained for the unreinforced section S6. This range is consistent with the reduction of strains at the sub-ballast base due to the presence of reinforcement (Figures 9 and 10). Values ofBgwere reduced by between 16% and 47%, whereas the maximum reduction observed for Los Angeles
abrasion test results was 23%. Bearing in mind the expected scatter of test results in full-scale experiments under in-service conditions, these results indicate a sig-nificant effect of the presence of the reinforcement in the alternative sub-ballast material on the relative increase on track stiffness and reduction in ballast breakage. However, less influence on the increase in ballast resistance to abrasion can be inferred, in comparison with the situation for the unreinforced alternative sub-ballast material.
The results in Figure 14 do not allow a definite conclu-sion to be drawn on the best position for the reinforcement layer in the sub-ballast. However, these results are consis-tent with those obtained from large-scale laboratory tests performed by Brown et al. (2007), which showed little difference between the performance of ballast reinforced with geogrid at the base or at the middle of the ballast layer thickness. In the field, reinforcement at the base of the ballast is the most practical solution.
3.4. Geotextile mechanical degradation
Geotextile specimens were exhumed from the track for wide-width tensile tests to evaluate the effects of mechani-cal damage. Tests were carried out on virgin specimens, on specimens after spreading and compaction of the sub-ballast, and on specimens exhumed after 90 days’ traffic (N¼3.183105). The wide strip tensile tests were per-formed according to ASTM D 4595. It was difficult to obtain authorisation from the railway company to exhume samples of the geosynthetics installed in the railway track, because the time required for such exhumations inter-rupted train traffic and disinter-rupted the normal activities of the railway. The tests were therefore limited to specimens of the geotextile used in the research programme. Figure 15 shows samples of the damage in the exhumed
speci-aaaaaaaaaaaaaaaaaaaa aaaaaaaaaaaaaaaaaaaa aaaaaaaaaaaaaaaaaaaa aaaaaaaaaaaaaaaaaaaa aaaaaaaaaaaaaaaaaaaa
aaaaaaaaaaaaaaaaaaa aaaaaaaaaaaaaaaaaaa aaaaaaaaaaaaaaaaaaa aaaaaaaaaaaaaaaaaaa aaaaaaaaaaaaaaaaaaa
aaaaaaaaaaaaaaaaaaaa aaaaaaaaaaaaaaaaaaaa aaaaaaaaaaaaaaaaaaaa aaaaaaaaaaaaaaaaaaaa aaaaaaaaaaaaaaaaaaaa
aaaaaaaaaaaaaaaaaaa aaaaaaaaaaaaaaaaaaa aaaaaaaaaaaaaaaaaaa aaaaaaaaaaaaaaaaaaa aaaaaaaaaaaaaaaaaaa
aaaaaaaaaaaaaaaaaaa aaaaaaaaaaaaaaaaaaa aaaaaaaaaaaaaaaaaaa aaaaaaaaaaaaaaaaaaa aaaaaaaaaaaaaaaaaaa
aaaaaaaaaaaaaaaaaaa aaaaaaaaaaaaaaaaaaa aaaaaaaaaaaaaaaaaaa aaaaaaaaaaaaaaaaaaa aaaaaaaaaaaaaaaaaaa
0 2 4 6 8 10
Los Ang
eles a
br
asion result (%)
S1 S2 S3 S4 S5 S6
Figure 13. Results of Los Angeles abrasion tests on ballast material
aaaaaaaaaaaaaaaaaaaaaaaaaaaaaa aaaaaaaaaaaaaaaaaaaaaaaaaaaaaa aaaaaaaaaaaaaaaaaaaaaaaaaaaaaa aaaaaaaaaaaaaaaaaaaaaaaaaaaaaa aaaaaaaaaaaaaaaaaaaaaaaaaaaaaa
aaaaaaaaaaaaaaaaaaaaaaaaaaaaaa aaaaaaaaaaaaaaaaaaaaaaaaaaaaaa aaaaaaaaaaaaaaaaaaaaaaaaaaaaaa aaaaaaaaaaaaaaaaaaaaaaaaaaaaaa aaaaaaaaaaaaaaaaaaaaaaaaaaaaaa
aaaaaaaaaaaaaaaaaaaaaaaaaaaaaa aaaaaaaaaaaaaaaaaaaaaaaaaaaaaa aaaaaaaaaaaaaaaaaaaaaaaaaaaaaa aaaaaaaaaaaaaaaaaaaaaaaaaaaaaa aaaaaaaaaaaaaaaaaaaaaaaaaaaaaa
aaaaaaaaaaaaaaaaaaaaaaaaaaaaaa aaaaaaaaaaaaaaaaaaaaaaaaaaaaaa aaaaaaaaaaaaaaaaaaaaaaaaaaaaaa aaaaaaaaaaaaaaaaaaaaaaaaaaaaaa aaaaaaaaaaaaaaaaaaaaaaaaaaaaaa
0 0.2 0.4 0.6 0.8 1.0
Nor
malised value
S2 S3 S4 S5
Normalised maximum vertical displacement from Benkelman beam tests on superstructure Normalised values ofBgafter 600 days’ traffic Normalised Los Angeles abrasion test results
mens of the geotextile. These damages were characterised by small cuts and holes.
Figure 16 shows the range of wide-width tensile tests performed on the exhumed specimens of the nonwoven geotextile. The maximum tensile force in tests on virgin geotextile specimens varied between 14.8 kN/m and 16.7 kN/m. Some reduction of the average tensile strength and an increase in the scatter of the test results can be observed after compaction of the sub-ballast and after 90 days’ train traffic, which corresponded to 3.183105 passages of loaded axles. The average strength and scatter of the test results obtained after 90 days’ traffic were similar to those obtained just after spreading and compac-tion of the sub-ballast material. This suggests that, up to 90 days’ traffic, most of the damage to the geotextile occurred during installation and compaction of the sub-ballast.
In-soil tensile tests were also performed on virgin and damaged geotextile specimens, using the equipment de-scribed in Mendes et al. (2007). In these tests the alternative sub-ballast material was used to confine the geotextile specimens. Figure 17a shows a schematic view of this equipment, which allows the execution of in-soil tensile tests on geotextile specimens under confinement by the soil only (no friction between soil and geotextile).
The average results obtained for different levels of confinement are presented in Figure 17b, and show a reduction of the geotextile secant tensile stiffness of between 12% and 36% in the strain range 2–5%, depend-ing on the confindepend-ing stress value considered. In this strain range the secant tensile stiffness of damaged geotextile specimens varied between 220 kN/m and 460 kN/m, de-pending on the confining stress. The latter value is not so significantly smaller than the geogrid tensile stiffness (520 kN/m), which may in part explain the close perform-ance of the test sections reinforced with geotextile and with geogrid. These significant values of geotextile stiff-ness may have also been a consequence of impregnation of the geotextile by particles of the sub-ballast material during its spreading and compaction. Mendeset al.(2007) found significant increases of secant tensile stiffness in
Figure 15. Typical mechanical damage to exhumed geotextile specimens
After sub-ballast compaction 0
5 10 15 20
T
ensile strength (kN/m)
Virgin After 90 days’ traffic
Figure 16. Ranges of wide-width tensile test results
Jack Load cell Clamp Geotextile (100 mm⫻200 mm)
Rollers Pressurised bag
100 1100 Soil Displacement transducer
(a)
0 5 10 15 20 Strain (%)
0 200 400 600 800 1000
Secant tensile stif
fness (kN/m)
Virgin - 220 kPa Exhumed - 50 kPa
Exhumed - 100 kPa Exhumed - 220 kPa (b)
in-soil tensile tests on similar geotextiles using a confining granular material (glass beads) with particle size range similar to that of the alternative sub-ballast material used in the test sections.
The experimental technique used in the in-soil tensile tests does not simulate the stretching and pre-tensioning of the geotextile that are likely to occur under field conditions during spreading and compaction of the fill material. Careful installation of the geotextile in the field is required in order to minimise mechanical damage and geotextile folding, wrinkles or loose spots. The beneficial effect of impregnation of the geotextile by soil particles will depend on the particles’ dimensions and geotextile opening sizes.
4. CONCLUSIONS
This paper has presented the performance of railway test sections where different forms of sub-ballast reinforce-ment were employed using geosynthetics. The main objective of the research was to evaluate the use of a reinforced low-quality, cheaper sub-ballast material as a substitution to the one traditionally used in a railway subjected to intense traffic and high loads due to the transportation of iron ore. The main conclusions of the research programme are summarised below.
The testing techniques and experimental methodology employed were satisfactory. Research under in-service conditions is very important in investigating the mechan-isms that influence the performance of the track. However, the constraints imposed by the need to maintain full-time railway operation limit the amount of information that can be acquired. The mortality of instruments in this type of work is usually high owing to the severity of the conditions to which the instruments are subjected (high loads, vibrations, and soil particle aggressiveness).
The results of in situ tests and strain measurements showed that the presence of the geosynthetic reinforce-ment reduced the compressibility of the system. Reduced breakage of the ballast material and greater abrasion resistance were observed in the test sections with geosyn-thetics. This can be attributed to the greater lateral confinement provided by the reinforcement layer.
Similar track performance was observed for the two types of geosynthetic tested. However, significant mech-anical damage was observed in the geotextile used after 600 days in service. This suggests that the long-term performance of the geotextile might be severely compro-mised by increasing mechanical damage, and that the use of a thicker, more durable geotextile would have been more appropriate.
The results obtained validated the use of an alternative, low-cost, sub-ballast material in combination with geosyn-thetic reinforcement. This solution can be attractive for the mining industry in situations where reasonably good-quality mining wastes are plentiful, and conventional track construction materials are scarce or expensive. Neverthe-less, further research is required for a proper understand-ing of the beneficial effects of geosynthetics in railway
tracks, with particular reference to the development of design methods.
ACKNOWLEDGEMENTS
The authors are indebted to the following institutions that supported the research activities described in this paper: University of Brasilia, Federal University of Ouro Preto, CVRD-Vale do Rio Doce Mining Company, CNPq-National Council for Scientific and Technological Develop-ment, and CAPES-Brazilian Ministry of Education.
NOTATIONS
Basic SI units are given in parentheses.
Bg breakage level (dimensionless)
CBR California Bearing Ratio (dimensionless)
D10 diameter for which 10% in mass of particles are smaller than that value (m)
D50 diameter for which 50% in mass of particles are smaller than that value (m)
D85 diameter for which 85% in mass of particles are smaller than that value (m)
emax maximum void ratio (dimensionless)
emin minimum void ratio (dimensionless) GI group index (dimensionless)
Gs particle specific gravity (dimensionless)
Ia50 anisotropy index (dimensionless)
Is50 point load index (Pa)
N number of axles (dimensionless)
n number of ranges of particle dimensions for which ˜Wki ˜Wkf . 0 (dimensionless)
wopt optimum moisture content (dimensionless) ˜Wki initial fraction of sample weight
corresponding to given range of ballast particle dimensions before breakage (dimensionless)
˜Wkf final fraction of sample weight corresponding to given range of ballast particle dimensions after breakage (dimensionless)
ªdmax maximum dry unit weight (N/m3)
REFERENCES
Arruda Filho, A. (1997). Flumitrens: permanent rail track. Seminar on Technological Update for Permanent Track Maintenance, Rio de Janeiro, RJ, Brazil (in Portuguese).
Ashpiz, E. S., Diederich, R. & Koslowsi, C. (2002). The use of spunbonded geotextile in railway track renewal St Petersburg-Moscow. Proceedings of the 7th International Conference on Geosynthetics, Nice, France, Vol. 3, pp. 1173–1176.
ASTM D 4595.Test Method for Tensile Properties of Geotextiles by the Wide-Width Strip Method. ASTM International, West Conshohocken, PA, USA, 11 pp.
ASTM D 5731. Standard Test Method for Determination of the Point Load Strength Index of Rock and Application to Rock Strength Classifications. ASTM International, West Conshohocken, PA, USA.
Mech-anics and Geotechnical Engineering, Istanbul, Vol. 3, pp. 2045– 2048.
Bathurst, R. J. & Raymond, G. P. (1987). Geogrid reinforcement of ballasted track.Transportation Research Record, No. 1153, 8–14. Brown, S. F, Kwan, J. & Thom, N. H. (2007). Identifying the key
parameters that influence geogrid reinforcement of railway ballast. Geotextiles and Geomembranes,25, No. 6, 326–335.
Cuconatto, J. M. (1997).A Study on Railway Ballast Contamination and the Use of Geosynthetics for Control. MSc thesis, COPPE/Federal University of Rio de Janeiro (in Portuguese).
Fernandes, G. (2005). Behaviour of Geosynthetic Reinforced Railway Tracks Constructed with Fine Grained Soils and Mining Wastes. PhD thesis, Graduate Programme of Geotechnics, University of Brasilia, Brasilia, Brazil, 253 pp. (in Portuguese).
Go¨bel, C. H., Weisemann, U. C. & Kirschner, R. A. (1994). Effectiveness of a reinforced geogrid in a railway subbase under dynamic loads. Geotextiles and Geomembranes,14, No. 2, 91–99.
Indraratna, B., Khabbaz, H., Salim, W. & Christie, D. (2006). Geotechnical properties of ballast and the role of geosynthetics in rail track stabilisation.Ground Improvement,10, No. 3, 91–101. Indraratna, B., Shahin, M. A. & Salim, W. (2007). Stabilisation of
granular media and formation soil using geosynthetics with special reference to railway engineering.Ground Improvement,11, No. 1, 27–43.
Marsal, R. J. (1973). Mechanical properties of rockfill. Embankment Dam Engineering: Casagrande Volume, R. C. Hirschfeld and S. J. Poulos (eds), John Wiley & Sons, New York, pp. 109–200. Lackenby J., Indraratna B., McDowell G. & Christie D. (2007). Effect of
confining pressure on ballast degradation and deformation under cyclic triaxial loading.Ge´otechnique,57, No. 6, 527–536. Mendes, M. J. A., Palmeira, E. M. & Matheus, E. (2007). Some factors
affecting the in-soil load–strain behaviour of virgin and damaged nonwoven geotextiles.Geosynthetics International,14, No. 1, 39–50. Nancey, A., Imbert, B. & Robinet, A. (2002). Thick and abrasion
resistance geotextile for use under the ballast in railways structures. Proceedings of the 7th International Conference on Geosynthetics, Nice, France, Vol. 3, pp. 1191–1194.
NBR 6465. Los Angeles Abrasion Tests on Aggregates. Associac¸a˜o Brasileira de Normas Te´cnicas (Brazilian Association for Technical Standards), Rio de Janeiro, 4 pp. (in Portuguese).
Raymond, G. P. (1985). Research on railroad ballast specification and evaluation. Track Design and Construction: Transportation Re-search Record, No. 1006, 1–8.
Raymond, G. P. (1999). Railway rehabilitation geotextiles. Geotextiles and Geomembranes,17, No. 4, 213–230.
Raymond, G. P. (2002). Reinforced ballast behaviour subjected to repeated load.Geotextiles and Geomembranes,20, No. 1, 39–61. Raymond, G. P. & Bathurst, R. J. (1990). Test results on exhumed railway
track geotextiles.Proceedings of the 4th International Conference on Geotextiles, Geomembranes and Related Products, The Hague, The Netherlands, Vol. 1, pp. 197–202.
Rowe, R. K. & Jones, C. J. F. P. (2000). Geosynthetics: innovative materials and rational design. Proceedings of GeoEng 2000, Melbourne, Australia, Vol. 1, pp. 1124–1156.
Salim, M. D. W. (2004).Deformation and Degradation Aspects of Ballast and the Role of Geosynthetics in Track Stabilisation. PhD thesis, University of Wollongong, 285 pp.
Selig, E. T. & Waters, J. M. (1994). Track Geotechnology and Substructure Management. Thomas Telford, London, UK, 750 pp. Warren, K. A. & Howard, I. L. (2007). Sensor selection, installation, and
survivability in a geosynthetic-reinforced flexible pavement. Geosynthetics International,14, No. 5, 298–315.