Prevalence and associated factors with abdominal obesity in
hemodialysis patients in Goiânia - GO
Authors
Ana Tereza Vaz de Souza Freitas1
Inaiana Marques Filizola Vaz2
Sanzia Francisca Ferraz3 Maria do Rosário Gondim Peixoto1
Marta Izabel Valente Morais Campos2 Nélida Schmid Fornés (in memorian)1
1 School of Nutrition of the Federal University of Goiás, Brazil.
2 General Hospital of the Federal University of Goiás, Brazil.
3 Tropical Disease Hospital, State Secretary of Health, Goiânia, Goiás, Brazil.
Submitted on: 02/10/2013. Approved on: 09/04/2013.
Correspondence to: Ana Tereza Vaz de Souza Freitas.
Federal University of Goiás. Rua Senador Domingos Velasco, Q17 L47, Setor Pedro Ludovico. Goiânia, GO, Brazil. CEP: 74820-110.
E-mail: [email protected] Tel: (62) 8445-7830.
Introduction: The presence of excess weight, especially visceral obesity con-tributes to the increased risk of meta-bolic and cardiovascular complications in patients with chronic kidney disease. Objective: To determine the prevalence and associated factors with abdomi-nal obesity in patients on hemodialysis (HD). Methods: Cross-sectional study with 344 patients older than 18 years. Abdominal obesity was defined as waist circunference ≥ 94 cm in men and ≥ 80 cm in women. The independent variables involved socioeconomic, demographic, lifestyle, duration of HD, food consump-tion and body mass index (BMI). The analysis of associated factors was per-formed by multiple Poisson regression, remaining in the final model variables with p < 0.05. Results: The prevalence of abdominal obesity was 44.77% and was more prevalent in women (55.71%) than in men (37.25%), p = 0.001. The end result of the multivariate analysis identified factors associated with ab-dominal obesity in men and women: age over 40 years, protein intake below 1.2 g/kg/day and BMI ≥ 25 kg/m². In men the economic class D/E remained associated with abdominal obesity, p < 0.05. Conclusion: There was a high prevalence of abdominal obesity in he-modialysis patients. Age greater than 40 years, lower socioeconomic classes, below the recommended protein intake and overweight were associated with abdominal obesity.
A
BSTRACTKeywords: abdominal obesity, nutrition assessment, renal dialysis, waist circunference.
I
NTRODUCTIONJust as in the general population, overweight as a consequence of nutritional disorders has been a common finding in individuals with chronic kidney disease on hemodialysis. The prevalence of overweight in this population has reached levels of up to 30%. However, the distribution of body fat in abdominal tissues has been associated with major metabolic implications.1
Several studies have shown that overweight, assessed by the body mass index (BMI), may be directly or inversely correlated with mortality, depending on the characteristics of the studied population.1-5 By its turn, abdomi-nal obesity constitutes an independent risk factor for cardiovascular disease (CVD), dyslipidemia, diabetes, hyper-tension, oxidative stress, and inflamma-tion1,6 regardless of overweight,1 with greater impact on mortality than total or peripheral fat.1,7 The risk of death for CVD in patients with chronic kidney disease may be up to 30 times higher than that of the general population.8
The negative effects of excessive abdominal fat, its impact on mortality, and the need for data to help define what can be done to manage this condition were the reasons behind the organization of this study. The authors aimed to assess the prevalence and the factors associated with abdominal obesity in a group of patients undergoing regular hemodialysis (HD).
M
ETHODSThis cross-sectional study enrolled a proportional stratified representative sample of the population of patients seen in ten HD centers in Goiânia, Brazil, seen from May of 2009 to March of 2010. A total of 344 individuals were included by random selection.
Sample size was calculated considering a popu-lation of 1,400 HD patients in Goiânia, assuming a prevalence of abdominal obesity around 50%1, with the confidence interval set at 95% and error at 5%. The calculations yielded a sample size of 302 patients. An additional 20% margin was added to account for follow-up losses and refusals to join the study, which brought the sample size up to 362 individuals. Of these, 344 patients remained in the study. Eighteen dropped out or failed to submit complete information.
The study included non-institutionalized clinically stable patients aged 18 and older of both genders, who had been on dialysis for more than three months. Subjects with recent episodes of infection (less than three months), patients with cancer, tuberculosis, acquired immunodeficiency syndrome, chronic obstructive pulmonary disease, severe cardiovascular disease (cerebrovascular disease and congestive heart failure), pregnant women, patients equipped with venous catheters, and individuals with conditions that prevented the verification of anthropometric measu-rements (advanced bone disease, sequelae of stroke, disabilities or amputations) were excluded.
The study protocol involved the acquisition of socioeconomic, demographic, lifestyle, medical history (etiology, comorbidities, time on hemodialysis), food and macronutrient intake, and anthropometric data. Data collection was carried out by four trained nutritionists using standardized forms pre-tested in a pilot study.
Variable-dependent abdominal obesity was mea-sured by waist circumference, as described by Lohman et al.,11 and categorized according to the WHO stan-dard12 (≥ 94 cm for men and ≥ 80 cm for women).
The following independent variables were analyzed to study the factors associated with abdominal obesity: socioeconomic and demographic aspects such as gender, age in years (categorized as < 40 or ≥ 40), marital status (with or without a partner), education (< 8 or ≥ 8 years); economic class as per the Economics Classification Criteria of the Brazilian Association of Research Companies (ABEP);13 habits such as smoking (smoker or non-smoker) and alcohol con-sumption (yes or not), time on dialysis (< 24 months, 24-59 months, > 60 months), food intake (≤ 35 or > 35 kcal/kg of ideal bodyweight), carbohydrate intake (≤ 60 or > 60% of total caloric intake - TCI), intake of lipids (< 25%, 25%-35%, and ≥ 35% of total caloric intake) and protein intake (≤ 1.2 or > 1.2 g/kg of ideal bodyweight); the level of physical activity was defined according to the criteria of the Pan-American Health Organization (PAHO)14 (sedentary, not sedentary) and overweight by the BMI (< 25 or ≥ 25 kg/m²).12
The mean intake of calories and macronutrients was calculated from six 24-hour dietary recall forms (three days on and and three days off dialysis) developed spe-cifically for this study (www.dbcheckout.com.br/nutri). Anthropometric parameters were measured after the mid-week dialysis session by two nutritionists according to the techniques described by Lohman et al.11; measurements were standardized as per the procedure described by Habicht15, and included weight, height and waist circumference. Weight and height measurements were used to calculate the body mass index (BMI).12
Data were entered in duplicate into software program Epi-Info 6.0 to check for consistency and analyzed with statistical package STATA/SE 8.0. Categorical variables were expressed as absolute and relative frequencies, and continuous variables in the form of mean values and standard deviations. The Kolmogorov-Smirnov test was used to test data normality (p≥ 0.05).
The prevalence ratio (PR) was used as a measure of association, estimated using the Poisson regression, and the Wald test was applied to rate statistical signi-ficance. Variables with p-values ≤ 0.20 in unadjusted analysis were tested in multivariate analysis using the Poisson regression with robust variance estimation; variables with a p < 0.05 were used in the final model.
University of Goiás and the Santa Casa de Misericordia de Goiânia. All participants gave informed consent.
R
ESULTSThe patients enrolled in this study were mostly males (59.30%), had a mean age of 49.33 ± 13.76 years, and hypertensive nephrosclerosis (37.7%) as the main etiology of chronic kidney disease, followed by glomerulonephritis (19.5%) and diabetic nephropathy (15.7%). Hypertension was the most prevalent comorbidity (66.4%) (Table 1).
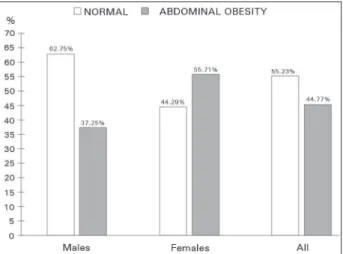
The prevalence of abdominal obesity in the study population was 44.77% (n = 154); females (55.71%) were more affected than men (37.25%), p = 0.001 (Figure 1). Overweight was found in 32.27% of the population, with no significant difference between genders (p = 0.252) (Table 1).
TABLE 1 DEMOGRAPHIC, CLINICAL, ANDNUTRITIONALCHARACTERISTICSOFHEMODIALYSISPATIENTSACCORDINGTO GENDER. GOIÂNIA, BRAZIL, 2010
Parameters All patients
n = 344 (100%)
Males n = 204 (59.30%)
Females
n = 140 (40.70%) p*
Age (years) (x ± SD) 49.33 ± 13.76 51.08 ± 13.90 46.79 ± 13.17 0.004
Time on HD** 43.00 (24.00-78.75) 42.00 (20.50-79.75) 46.00 (27.00-78.00) 0.281
Etiology (n/%)
Hypertensive n. 130 (37.7) 75 (36.76) 55 (39.29)
Glomerulonephritis 67 (19.5) 37 (18.14) 30 (21.43)
Diabetic nephropathy 54 (15.7) 33 (16.18) 21 (15.00) 0.891
Undetermined 26 (7.6) 17 (8.33) 9 (6.43)
ADPKD 24 (7.0) 14 (6.86) 10 (7.14)
Others 43 (12.5) 28 (13.73) 15 (10.71)
Comorbidities (n/%)
Hypertension 228 (66.4) 134 (65.69) 94 (67.14)
Diabetes 12 (3.6) 6 (2.94) 6 (4.29) 0.906
Hypertension + Diabetes 40 (11.7) 26 (12.75) 14 (10.00)
None 51 (14.9) 30 (14.71) 21 (15.00)
Others 13 (3.4) 8 (3.92) 5 (3.57)
BMI (kg/m²) (x ± SD) 23.19 (20.72-26.03)** 23.57 ± 3.60 23.82 ± 4.82 0.582
BMI (kg/m²) (n/%)
< 18.5 30 (8.72) 14 (6.86) 16 (11.43) 0.252
18.5-24.99 203 (59.01) 126 (61.76) 77 (55.00)
≥ 25 111 (32.27) 64 (31.38) 47 (33.57)
WC (cm) (x ± SD) 87.91 ± 12.40 90.65 ± 11.42 83.92 ± 12.71 < 0.001
Calorie intake (kcal/kg of ideal weight) 26.05 ± 6.64 26.66 ± 7.00 25.15 ± 6.00 0.038
Protein intake (g/kg of ideal weight) 1.00 ± 0.25 1.03 ± 0.26 0.95 ± 0.23 0.004
CHO intake (%) 54.52 ± 4.66 54.76 ± 4.62 54.16 ± 4.72 0.243
Lipid intake (%) 30.00 ± 3.60 29.61 ± 3.50 30.58 ± 3.68 0.014
* T-test or Mann-Whitney U test or Pearson χ2; HD: Hemodialysis; ** median (25th-75th percentiles). CKD: Chronic kidney disease; ADPKD: Autosomal Abdominal obesity was significantly higher in men aged 40 and older, subjects in income level classes D/E, on hemodialysis for 24 to 59 months, protein intake under 1.2 g/kg/day, and overweight individuals (BMI > 25 kg/m²), p < 0.05. Physical inactivity and carbohydrate intake were not associated with abdominal obesity, but were tested in the final model for having p < 0.20 (Table 2). Educational level (p = 0.345), marital status (p = 0.391), smoking (p = 0.226), alcohol consumption (p = 0.484), calorie intake (p = 0.371), and lipid intake (p = 0.560) were not significantly correlated with abdominal obesity (data not shown).
Figure 1. Prevalence of abdominal obesity in hemodialysis patients. Goiânia, Brazil.
TABLE 2 SAMPLEDISTRIBUTION, PREVALENCEOFABDOMINALOBESITY, ANDPREVALENCERATIOOFMALESON
HEMODIALYSISACCORDINGTODEMOGRAPHICVARIABLES, LIFESTYLE, TIMEONHEMODIALYSIS, FOODINTAKE, AND
BMI. GOIÂNIA, BRAZIL, 2010
Variables Sample distribution
(n = 140) n (%)
Prevalence
of AO n (%) Gross PR (95% CI) p*
Age < 0.001
< 40 years 45 (22.06) 08 (17.78) 1
≥ 40 years 159 (77.94) 68 (42.77) 1.21 (1.09-1.35)
Income level class 0.002
A/B 44 (21.57) 23 (52.27) 1.00
C 118 (57.84) 45 (38.14) 0.90 (0.80-1.01)
D/E 42 (20.59) 8 (19.05) 0.78 (0.68-0.90)
Physical inactivity 0.137
Yes 152 (74.51) 61 (40.13) 1.08 (0.97-1.21)
No 52 (25.49) 15 (28.85) 1
Time on HD 0.042
< 24 months 56 (27.45) 18 (32.14) 1
24-59 months 72 (35.29) 35 (48.61) 1.12 (1.00-1.27)
> 60 months 76 (37.25) 23 (30.26) 0.98 (0.87-1.11)
CHO intake 0.134
≤ 60% 173 (84.80) 68 (39.31) 1
> 60% 31 (15.20) 8 (25.81) 0.90 (0.79-1.03)
Protein intake 0.019
< 1.2 g/kg of ideal weight 151 (74.02) 63 (41.72) 1.14 (1.02-1.27)
≥ 1.2 g/kg of ideal weight 53 (25.98) 13 (24.53) 1
BMI (kg/m²) < 0.001
< 25 140 (68.63) 23 (16.43) 1
≥ 25 64 (31.37) 53 (82.81) 1.57 (1.46-1.69)
AO: Abdominal obesity; PR: Prevalence ratio; CI: Confidence interval; *p Wald; CHO: Carbohydrates; BMI: Body mass index.
shows marital status, alcohol consumption, and calorie intake were not correlated with abdominal obesity; however, these variables were tested in the final model for having p < 0.20. Subject income level class
(p = 0.989), physical inactivity (p = 0.283), smoking (p = 0.314), lipid intake (p = 0.542), and carbohydrate intake (p = 0.713) were not correlated with abdominal obesity in female patients (data not shown).
Multivariate analysis identified four factors independently associated with abdominal obesity in male patients: age over 40 years (PR = 1.13, CI = 1.02-1.26), income level classes D/E (PR = 0.87 CI = 0.77-0.99), protein intake under 1.2 g/kg/day (PR = 1.11, CI = 1.03-1.19), and BMI ≥ 25 kg/m² (PR = 1.52, CI 1.41-1.65); three factors were found for female patients: age over 40 years (PR = 1.27, CI = 1.41-1.48), protein intake under 1.2 g/kg/day (PR = 1.17, CI = 1.04-1.33), and BMI ≥ 25 kg/m² (PR = 1.37, CI = 1.26-1.49) (Table 4).
D
ISCUSSIONTABLE 3 SAMPLEDISTRIBUTION, PREVALENCEOFABDOMINALOBESITY, ANDPREVALENCERATIOOFFEMALESON
HEMODIALYSISACCORDINGTODEMOGRAPHICVARIABLES, LIFESTYLE, TIMEONHEMODIALYSIS, FOODINTAKE, AND
BMI. GOIÂNIA, BRAZIL, 2010
Variables Sample distribution
(n = 140) n (%)
Prevalence
of AO n (%) Gross PR (95% CI) p*
Age < 0.001
< 40 years 41 (29.29) 08 (19.51) 1
≥ 40 years 99 (70.71) 70 (70.71) 1.43 (1.27-1.60)
Years of schooling 0.0185
< 8 years 94 (67.14) 59 (62.77) 1.15 (1.02-1.30)
≥ 8 years 46 (32.86) 19 (41.30) 1
Marital status 0.130
Living with a partner 71 (50.71) 44 (61.97) 1.00
Not living with a partner 69 (49.29) 34 (49.28) 0.92 (0.82-1.02)
Alcohol consumption 0.133
Yes 16 (11.43) 6 (37.50) 0.87 (0.72-1.04)
No 124 (88.57) 72 (58.06) 1
Time on HD 0.046
< 24 months 26 (18.57) 19 (73.08) 1
24-59 months 62 (44.29) 29 (46.77) 0.84 (0.74-0.96)
> 60 months 52 (37.14) 30 (57.69) 0.91 (0.79-1.03)
Calorie intake 0.066
< 35 kcal/kg of ideal weight 132 (94.29) 76 (57.58) 1
≥ 35 kcal/kg of ideal weight 8 (5.71) 2 (25.00) 0.79 (0.62-1.01)
Protein intake 0.003
< 1.2 g/kg of ideal weight 118 (84.29) 72 (61.02) 1.08 (1.08-1.48)
≥ 1.2 g/kg of ideal weight 22 (15.71) 6 (27.27) 1
BMI (kg/m²) < 0.001
< 25 93 (66.43) 32 (34.41) 1
≥ 25 47 (33.57)* 46 (97.87) 1.47 (1.36-1.58)
AO: Abdominal obesity; PR: Prevalence ratio; CI: Confidence interval; *p Wald; HD: Hemodialysis; BMI: Body mass index.
follow the trends seen in the general population as reported in epidemiological studies.16,17 The higher prevalence of abdominal obesity observed in females when compared to males is very similar to the difference seen in other studies on the general population, which reported rates of abdominal obesity ranging from 42% to almost 60% in women16,17 and 27.5% to approxi-mately 40% in men.16,17 In a population on dialysis, Postorino et al.1 reported 60% of female and 24% of male patients had abdominal obesity.
Females are known for naturally having more body fat as a result of hormonal and reproductive factors. However, despite gender specificities, the majority of the females enrolled in this study had increased abdominal fat, a factor closely correlated with cardiovascular mortality,7 a major cause of death
In addition to biological issues, factors such as low physical activity and inadequate food intake may contribute to the accumulation of fat.18 Although these variables were not correlated with abdominal obesity in our study, physical inactivity was a predominant finding among the included individuals.
The prevalence of abdominal obesity seems to increase with age, being more evident after the fourth decade of life.17 Similar results were observed in this study, in which males and females aged 40 and above had higher levels of abdominal obesity. Ohkawa et al.19 also described a positive correlation between central obesity and age.
TABLE 4 FINALMULTIVARIATEANALYSISMODELFORABDOMINALOBESITYINHEMODIALYSISPATIENTS. GOIÂNIA,
BRAZIL, 2010
Variables Males Females
PR (95% CI) p* PR (95% CI) p*
Age
< 40 years 1 1
≥ 40 years 1.13 (1.02-1.26) 0.015 1.27 (1.48-1.41) < 0.001
Income level class
A/B 1
C 0.94 (0.86-1.03) 0.226 -
-D/E 0.87 (0.77-0.99) 0.036 -
-Protein intake
≥ 1.2 g/kg of ideal weight 1 1
< 1.2 g/kg of ideal weight 1.11 (1.03-1.19) 0.006 1.17 (1.04-1.33) 0.007
BMI (kg/m²)
< 25 1 1
≥ 25 1.52 (1.41-1.65) < 0.001 1.37 (1.26-1.49) < 0.001
PR: Prevalence ratio; CI: Confidence interval; *p Wald; BMI: Body mass index.
and particularly a redistribution of fat from the limbs to the trunk, producing central obesity. Several factors can influence these changes, such as genetic predisposition, eating habits, and decreases in physical activity due to age.18,20
Individuals undergoing dialysis experience progressive declines in lean body mass on the order of 20% to 50% with aging.21 The occurrence of sarcopenic obesity (increases in fat mass and decreases in lean mass) in HD patients has been correlated with increased number of falls, functional decline, osteoporosis, increased risk of infection19 and, consequently, increased overall risk of mortality and cardiovascular disease.1
Studies have correlated poorer socioeconomic status of HD patients with higher mortality rates, lack of access to transplants, and worse survival22,23, a worrying situation as most of the participants in this study have lower income levels, similarly to what is seen in other regions of Brazil.22,24
Calorie, carbohydrate, and lipid intake were not correlated with obesity in this study. Calorie intake below recommended levels has been cited in several studies21,25 and does not explain the obesity paradox observed in the dialysis population. In the general population, the high intake of calories mainly from fats and simple carbohydrates plays a role in the genesis of obesity.18 The result may be attributed to underreporting of food intake by patients in their 24-hour dietary recall forms, as described in other
studies,21,25 and the possibility of reverse causality, common in cross-sectional studies, which does not allow the establishment with certainty of the causal links between events.
Patients with protein intake below recommended levels were more affected by abdominal obesity, suggesting that protein intake could impact body fat distribution. Recent studies showed that protein intake was a predictor of lean body mass associated with better survival in women.4,21 Ohkawa et al.19 also reported that protein intake estimated by nPNA was independently associated with lean body mass in multivariate analysis.
BMI was included in the final multivariate analysis model and was correlated with abdominal obesity. In fact, the BMI has been closely correlated with total bodily fat,10,21 although it cannot distinguish between muscle mass and fat mass or indicate bodily fat distribution.7 Thus, individuals with similar BMIs may present different contents and distributions of bodily fat, especially when factors such as physical activity, ethnicity, and age are considered.26
obesity, a situation characterized more evidently in females. This finding draws our attention to the fact that even individuals with normal weight may have abdominal obesity, and may thus be at increased risk of cardiovascular events.
Several studies have established the advantages of using the BMI as an indicator of overweight in patients on hemodialysis, and described an inverse correlation between mortality and BMI.3,27,28 However, when overweight is not associated with adequate levels of lean mass,5 it may reflect abnormal deposition of fat in the abdomen, thus ceasing to be a protective factor29 to become harmful due to its contribution to metabolic changes and for being highly correlated with mortality in patients with end-stage kidney disease.6,29 Thus, the diagnosis of nutritional disorders in dialysis patients arising from overweight cannot be based solely on the BMI.
A high prevalence of obesity was observed in the studied population, particularly in females, as also seen in the general population. Factors such as age over 40 years, protein intake below recommended levels, and overweight based on the BMI were determining factors for abdominal obesity in males and females. Males in lower income level classes also had more abdominal obesity.
Understanding the factors that impact abdominal obesity is critical to the adoption of measures intended to prevent and control this disorder. Given the risks inherent to abdominal obesity, diagnosis based on waist circumference should be included in the routine care of patients on hemodialysis along with the BMI. These two simple widely available diagnostic tools will enable a better understanding of bodily fat distribution patterns and provide the parameters for changing and monitoring the nutritional care offered to patients on hemodialysis.
R
EFERENCES1. Postorino M, Marino C, Tripepi G, Zoccali C.; CREDIT (Cala-bria Registry of Dialysis and Transplantation) Working Group. Abdominal obesity and all-cause and cardiovascular mortality in end-stage renal disease. J Am Coll Cardiol 2009;53:1265-72. 2. Lorenzo V, Martin M, Rufino M, Sanchez E, Jiménez A, Her-nández D, et al. High prevalence of overweight in a stable Spa-nish hemodialysis population: a cross sectional study. J Ren Nutr 2003;13:52-9.
3. de Mutsert R, Grootendorst DC, Boeschoten EW, Brandts H, van Manen JG, Krediet RT, et al.; Netherlands Cooperative Study on the Adequacy of Dialysis-2 Study Group. Subjecti-ve global assessment of nutritional status is strongly associa-ted with mortality in chronic dialysis patients. Am J Clin Nutr 2009;89:787-93.
4. Noori N, Kovesdy CP, Dukkipati R, Kim Y, Duong U, Bross R, et al. Survival predictability of lean and fat mass in men and women undergoing maintenance hemodialysis. Am J Clin Nutr 2010;92:1060-70.
5. Beddhu S, Pappas LM, Ramkumar N, Samore M. Effects of body size and body composition on survival in hemodialysis patients. J Am Soc Nephrol 2003;14:2366-72.
6. Zoccali C. The obesity epidemics in ESRD: from wasting to waist? Nephrol Dial Transplant 2009;24:376-80.
7. Elsayed EF, Sarnak MJ, Tighiouart H, Griffith JL, Kur-th T, Salem DN, et al. Waist-to-hip ratio, body mass index, and subsequent kidney disease and death. Am J Kidney Dis 2008;52:29-38.
8. Laurinavicius AG, Santos RD. Dislipidemia, estatinas e insufi-ciência renal crônica. Rev Bras Hipertens 2008;15:156-61. 9. Sanches FM, Avesani CM, Kamimura MA, Lemos MM,
Axel-sson J, Vasselai P, et al. Waist circumference and visceral fat in CKD: a cross-sectional study. Am J Kidney Dis 2008;52:66-73. 10. Bross R, Chandramohan G, Kovesdy CP, Oreopoulos A, Noori
N, Golden S, et al. Comparing body composition assessment tests in long-term hemodialysis patients. Am J Kidney Dis 2010;55:885-96.
11. Gordon CC, Chumlea WC, Roche AF. Stature, recumbent leng-th, and weight. In: Lohman TG, Roche AF, Martorell R. An-thropometric standardization reference manual. Champaign: Human Kinetics Books; 1988.
12. World Health Organization. Obesity: preventing and managing the global epidemic. Report of the WHO Consultation on Obe-sity. Geneva: World Health Organization; 1998.
13. Associação Brasileira de Empresas de Pesquisas. Critério de Classificação Econômica Brasil. 2008 [citado 2009 set 12]. Disponível em: www.abep.org/codigosguias/CCEB2008-Ba-se2006e2007.pdf
14. Organización Panamericana de la Salud. Protocolo y directrices: Conjunto de Ações para la Reducción Multifactorial de Enfer-medades no Transmisibles (CARMEN/CINDI). OPAS; 1997. 15. Habicht JP. Estandarizacion de métodos
epidemiológi-cos cuantitativos sobre el terreno. Bol Oficina Sanit Panam 1974;76:375-84.
16. Veloso HJF, Silva AAM. Prevalência e fatores associados à obe-sidade abdominal e ao excesso de peso em adultos maranhen-ses. Rev Bras Epidemiol 2010;13:400-12.
17. Linhares RS, Horta BL, Gigante DP, Dias-da-Costa JS, Olin-to MTA. Distribuição de obesidade geral e abdominal em adultos de uma cidade no Sul do Brasil. Cad Saúde Pública 2012;28:438-48.
18. World Health Organization. Diet, nutrition and prevention of chronic diseases. Report of a joint WHO/FAO expert consulta-tion. Geneva: World Health Organization; 2003.
19. Ohkawa S, Odamaki M, Ikegaya N, Hibi I, Miyaji K, Kumagai H. Association of age with muscle mass, fat mass and fat dis-tribution in non-diabetic haemodialysis patients. Nephrol Dial Transplant 2005;20:945-51.
20. Matsudo SM, Matsudo VKR, Barros Neto TL. Impacto do en-velhecimento nas variáveis antropométricas, neuromotoras e metabólicas da aptidão física. Rev Bras Ciên 2000;8:21-32. 21. Majchrzak KM, Pupim LB, Sundell M, Ikizler TA. Body
com-position and physical activity in end-stage renal disease. J Ren Nutr 2007;17:196-204.
22. Zambonato TK. Thomé FS, Gonçalves LFS. Perfil socioe-conômico dos pacientes com doença renal crônica em diá-lise na região noroeste do Rio Grande do Sul. J Bras Nefrol 2008;30:192-200.
23. Drey N, Roderick P, Mullee M, Rogerson M. A population-ba-sed study of the incidence and outcomes of diagnopopulation-ba-sed chronic kidney disease. Am J Kidney Dis 2003;42:677-84.
25. Vegine PM, Fernandes ACP, Torres MRSG, Silva MIB, Ave-sani CM. Avaliação de métodos para identificar desnutrição energético-proteica de pacientes em hemodiálise. J Bras Nefrol 2011;33:55-61.
26. Snijder MB, van Dam RM, Visser M, Seidell JC. What aspects of body fat are particularly hazardous and how do we measure them? Int J Epidemiol 2006;35:83-92.
27. Fouque D, Vennegoor M, ter Wee P, Wanner C, Basci A, Ca-naud B, et al. EBPG guideline on nutrition. Nephrol Dial Trans-plant. 2007;22:ii45-87.
28. Kalantar-Zadeh K, Kopple JD, Kilpatrick RD, McAllister CJ, Shinaberger CS, Gjertson DW, et al. Association of morbid obe-sity and weight change over time with cardiovascular survival in hemodialysis population. Am J Kidney Dis 2005;46:489-500. 29. Honda H, Qureshi AR, Axelsson J, Heimburger O, Suliman