Association between the level of quality of life and nutritional
status in patients undergoing chronic renal hemodialysis
Authors
Ana Carolina Bonelá dos Santos1
Manuela do Carmo Machado1
Luciene Rabelo Pereira1
Juliana Lemos Pratti Abreu2
Marisa Barbosa Lyra3
1 Espírito Santo Catholic
Salesian College.
2 Vila Velha Evangelical
Hospital - HEVV.
3 Federal Institute of Espírito
Santo.
Submitted on: 01/18/2013. Approved on: 07/30/2013.
Correspondence to: Manuela do Carmo Machado. Nephrology Service of the Vila Velha Evangelical Hospital. Rua Bom Jardim, nº 8, Bairro Industrial. Vila Velha, Espírito Santo, Brazil. CEP: 29118-713. E-mail: manuela.nut@gmail. com
Tel: (27) 9844-7949.
Introduction: The chronic kidney dis-ease and undergoing hemodialysis (HD) cause limitation in patients' life interfering in their life's quality and the nutritional care is fundamental to the disease treatment. Objective: The objective is the goal is to analyze the association between quality of life through the instrument (SF-36) with dietary intake, nutritional status in pa-tients with chronic kidney disease in HD through quantitative research and transversal. Methods: Realized valua-tion anthropometric, collecvalua-tion of the results of biochemical tests, applica-tion of the quesapplica-tionnaire SF-36 and dietary anamnesis (food recall of 24h). Results: The sample consisted of thir-ty adult patients with age between 28 to 76 years. The disease related with chronic kidney disease was found more hypertension systemic arterial (53.3%) The average body mass index was 25.04 ± 4.50 kg/m². By fold cutaneous arm, 73.3% were in malnutrition. The end nutritional diagnosis of malnutri-tion was 80% among the patients stud-ied. The time of diagnosis of renal dis-ease had a mean of 4.84 ± 3.51 years. By the middle of biochemical tests only phosphorus creatinine were adequate. In the mean the scores of SF-36 the low-est value found was limited to physical aspects (16.67 ± 29.60) and the largest for the social aspect (68.17 ± 33.67). Conclusion: The average energy con-sumption and protein was below the recommended. Got positive correlation of calories, protein, fiber, calcium and carbohydrate, with quality of life. It was concluded that feeding is associat-ed with quality of life of renal patients undergoing hemodialysis.
A
BSTRACTKeywords: chronic, kidney failure,
nutri-I
NTRODUCTIONChronic Kidney Disease (CKD) is characterized by the slow progressive irreversible loss of exocrine (filtration, reabsorption, and secretion of substances through the urine) and endocrine function (decreased production of erythropoietin and 1.25-dihydroxycholecalciferol).1
It has been defined as a complex syndrome due to complications ensuing from the loss of renal function, such as anorexia, uremia, loss of the senses of smell and taste (which explains the high prevalence of malnutrition in subjects with CKD); hypertension, hypertriglyceridemia, and hyperglycemia (factors related to cardiovascular disease); increased incidence of bleeding episodes resulting from renal failure; oliguria; edema; mental confusion; adnamia; asterixis; obnubilation and coma.2
The 2011 Dialysis Census revealed that 91,314 people were undergoing dialysis in Brazil, and that 84.9% of the patients were covered by the Brazilian public health care system (SUS). The Census also found that the most common etiologies of CKD are systemic hypertension (SH) and diabetes mellitus (DM). Therefore, CKD needs to be considered as a public health issue.3
Malnutrition is caused by uremia, which by its turn occurs consequently to the loss of exocrine function, causing a constant inflammatory state that predisposes patients to this condition. Additionally, dietary restrictions, loss of amino acids during dialysis, anorexia, infection, gastrointestinal disorders, and the administration of certain drugs favor the onset of nutritional anomalies.5,6
Signs of malnutrition are present in 10% to 70% of the patients on hemodialysis (HD) and in 18% to 56% of the individuals on continuous ambulatory peritoneal dialysis (CAPD). Malnutrition is a major factor in the morbidity and mortality of patients on HD.7
Although the many technological and therapeutic advances in the area of dialysis have helped increase the survival of individuals with CKD, they were not enough to allow patients to return to the lives they lived before the disease.6
Patients with CKD experience dramatic changes in their lives. Many are the limitations they face, in addition to painful hemodialysis sessions, strict diets, changes in their personal, professional, and social lives. Thoughts about death become more frequent, along with negative perceptions over health care and the hope that a kidney transplant will help improve their lives.7
This study aims to correlate quality of life with food intake and nutritional status in a population of patients with chronic kidney disease on hemodialysis.
M
ETHODSThis cross-sectional quantitative study was carried out at the Nephrology Care Center of the Vila Velha Evangelical Hospital (HEVV), in the State of Espírito Santo, Brazil. The clinic has been accredited by the SUS and currently takes care of 126 patients on HD per month.
Forty-two of the 126 patients were seen in the night shift, which prevented their inclusion in the study. Therefore, a total of 84 patients treated in the morning and afternoon shifts were invited to join the study. The sample was established based on convenience, and not on a probabilistic approach. All patients with CKD on HD seen at our center offered to join the study and were asked to sign an informed consent term, in accordance with Resolution 196/96 from the National Health Council.8 Patients under
the age of 18 years at the time of the study were excluded. The study was approved by the Research Ethics Committee of the Espírito Santo Catholic Salesian College and by the HEVV board.
The population was characterized based on the data collected from medical charts, namely: patient age, time on hemodialysis, time since diagnosis of kidney disease, conditions associated with kidney disease.
Patient socioeconomic status was assessed according to the Brazilian Economics Classification Criteria - CCEB (2008) issued by the Brazilian Association of Research Companies (ABEP).9
QUALITYOFLIFE (QOL) ASSESSMENT
The validated Brazilian Portuguese version of the Medical Outcomes Study Short Form 36 (SF-36) survey was used to assess the health related quality of life (HRQOL) of the subjects enrolled in the study.10
The survey consists of 36 items divided into eight scales, namely: physical functioning (PF), role-physical (RP), bodily pain (BP) general health (GH), vitality (VT), social functioning (SF), role-emotional (RE), and mental health (MH). Subjects are given scores from 0 to 100 in each scale, where zero represents the worst and 100 the best health status.11 The survey
was applied by one of the authors while the subjects were on hemodialysis.
FOODINTAKE
Patients were asked to fill 24-hour dietary recall forms (R24h)12 for three alternate days. One of the
forms was filled on a day in which the patient had undergone HD and the other two in days without HD - one being a weekend day (WE) and the other a weekday (WD). Subsequently, the data were analyzed on software DietWin Personal (2012). Intake levels of calories (kcal/kg of body weight/day), carbohydrates (CHO), protein (PTN/kg of body weight/day), lipids, total cholesterol, fiber, calcium (Ca), phosphorus (P), potassium (K), and sodium (Na) were assessed in the study.
The reference values for the analysis of intake of macronutrients and micronutrients were the daily nutritional recommendations for individuals on hemodialysis.13
ANTHROPOMETRICASSESSMENT
Patient body weight, height, mid-upper arm circumference (MUAC), and tricipital skinfold thickness (TST) were measured. Measurements were made after HD session by a trained member of the study’s staff.
Patients were weighed with shoes off, wearing light clothing, on an electronic digital MEA 08140 Plena®
scale with increments of 100 g and a total capacity of 150 kg. The subject’s dry weight was considered, i.e., the weight after the end of an HD session.
Subject height was measured using a two-meter vertical tape stadiometer, precise to the nearest 0.1 cm, attached to a wall. Arm circumference was measured with a non-extending measuring tape placed at the midpoint between the acromion and olecranon of the arm without the arteriovenous fistula, with subjects extending their arms along their bodies. Measurements were made in centimeters. Arm circumference measurements were used to estimate the mid-upper arm muscle circumference (MUAMC) using the formula developed by Blackburn & Thornton:13 MUAMC (cm) = MUAC (cm) - π x
[TST (mm) ÷ 10]. Percent MUAC was calculated with the following formula: %MUAC = MUAC/MUAC 50 x 100.13 The reference value was obtained from the
50th percentile, as defined for the general population
according to Frisancho.14
Patients were categorized by percent MUAC as follows: severely malnourished for values under 70%; moderately malnourished for values ranging between 70% and 80%; mildly malnourished for values in the 80%-90% range; properly nourished for values in the 90%-110% range; and overweight for values greater than 110%.13
A Cescorf® caliper placed on the same spot used to
measure MUAC, on the posterior part of the arm whe-re the skinfold separated discwhe-retely from muscle tissue, was used to measure TST. Three consecutive measure-ments were performed and the mean value in millime-ters was considered as the final result. Relative percent TST was calculated with formula %TST = TST/TST 50 x 100 using the reference value obtained from the 50th percentile for the normal population14. Patients
were then categorized as severely malnourished when values were under 70%; moderately malnourished for values ranging between 70% and 80 %; mil-dly malnourished for values in the 80%-90% range; properly nourished for values in the 90%-110% range;
overweight for values in the 110%-120% range; and obese for values greater than 120%.15
The cutoff points used for the BMI, calculated as the ratio between the subject’s weight and height to the square, were the ones described by Riella & Martins15 for the population with kidney disease,
which were then compared to the cutoff points proposed by World Health Organization (WHO) for the general population.16
The following indicators were measured to verify the presence of malnutrition: %MUAC, %TST, and BMI.
The MUAC looks into muscle reserves without a correction for bone tissue; TST is used to assess subcutaneous fat; and the BMI to evaluate total body mass.17 As each parameter assesses different bodily
compartments, the same patient can present three different diagnoses. Therefore, patients diagnosed as having a degree of malnutrition in at least one of the parameters were considered to be malnourished.
BIOCHEMICALPARAMETERS
The levels of the following biochemical indicators were collected: phosphorus, total calcium, creatinine, parathyroid hormone (PTH), and potassium. Only the tests cited above were mentioned in the patients’ charts. Data from other tests were stored in the clinic’s information system, to which we did not have access. The reference values used in this stu-dy were the ones reported by Martins & Riella15, in
which the levels seen in patients with chronic kidney disease were different from those of the general popu-lation, as specified: phosphorus: 4.5-6.0 mg/dl; total calcium: 9.0-11 mg/dl; creatinine: 7-12 mg/dl; PTH: 100-300 mg/dl; potassium: 3.5-5.5 mg/dl.
Important biomarkers such as complete blood count, urea, and albumin were not considered, as these test results were not released by the clinic for this study.
STATISTICALANALYSIS
Software program Bioestat 5.0 was used in statistical analysis. A five-percent significance level was defined. The correlation coefficient was used to measure the degree of correlation between two metric variables. Spearman’s rank correlation coefficient was used for variables not following a normal distribution.
R
ESULTSmean age of 51.90 ± 14.19 years. The time since the diagnosis of kidney disease ranged from one month to 17 years (mean of 5.31 ± 4.02). The population was homogeneous with respect to gender, as 15 females and 15 males were enrolled in the study. Patients had been on dialysis for 1-197 months, and a mean of 43.37 ± 47.38 months.
When level of income was considered, 26 (76.6%) patients were on class C. Data on diseases associated with CKD are presented in Graph 1.
variables, since each variable may yield different diagnoses for the same patient. The results of patient nutritional assessments are shown in Table 1.
Graph 1. Results on diseases associated with chronic kidney disease. SH: Systemic hypertension; DM: Diabetes Mellitus.
In the analysis of anthropometric variables, the categorization of patients according to the BMI classification proposed by Riella & Martins15 revealed
that 50% (n = 15) of the subjects had malnutrition, 36.7% (n = 11) were normally nourished, and 13.3% (n = 4) were overweight. According to the classification proposed by the WHO,16 none of the
patients was malnourished, 56.7% (n = 17) were eutrophic, and 43.3% (13) were overweight.
According to the MUAMC, 6.7% (n = 2) of the subjects had severe malnutrition, 3.3% (n = 1) had moderate malnutrition, and 20% (n = 6), had mild malnutrition, i.e., 30% (9) had some degree of malnutrition.
According to the TST, 73.3% (n = 22) of the indi-viduals were malnourished; of these, 63.3% (n = 19) had severe malnutrition, 6.7% (n = 2) had moderate malnutrition, and 3.3% (n = 1) had mild malnutrition.
The final nutritional diagnosis established based on anthropometric data indicated that 80% (n = 24) of the included subjects were malnourished. This diagnosis was not reflected on all anthropometric
TABLE 1 NUTRITIONALSTATUSACCORDINGTO BMI,
MUAC, AND TST
Variables n %
BMI (Riela)
Malnutrition 15 50.0 Adequate 11 36.7 Overweight 4 13.3 BMI (WHO)
Malnutrition 0 0.0 Adequate 17 56.7 Overweight 13 43.3 Categorization according to MUAC
Severe malnutrition 2 6.7 Moderate malnutrition 1 3.3 Mild malnutrition 6 20.0 Adequate/eutrophic 16 53.3 Overweight 5 16.7 Categorization according to TST
Severe malnutrition 19 63.3 Moderate malnutrition 2 6.7 Mild malnutrition 1 3.3 Eutrophic 4 13.3 Overweight 1 3.3
Obesity 3 10.0
Nutritional diagnosis
Malnutrition 24 80.0 Eutrophic 4 13.3
Obesity 2 6.7
Total 30 100.0
Biochemical parameters15 revealed that only
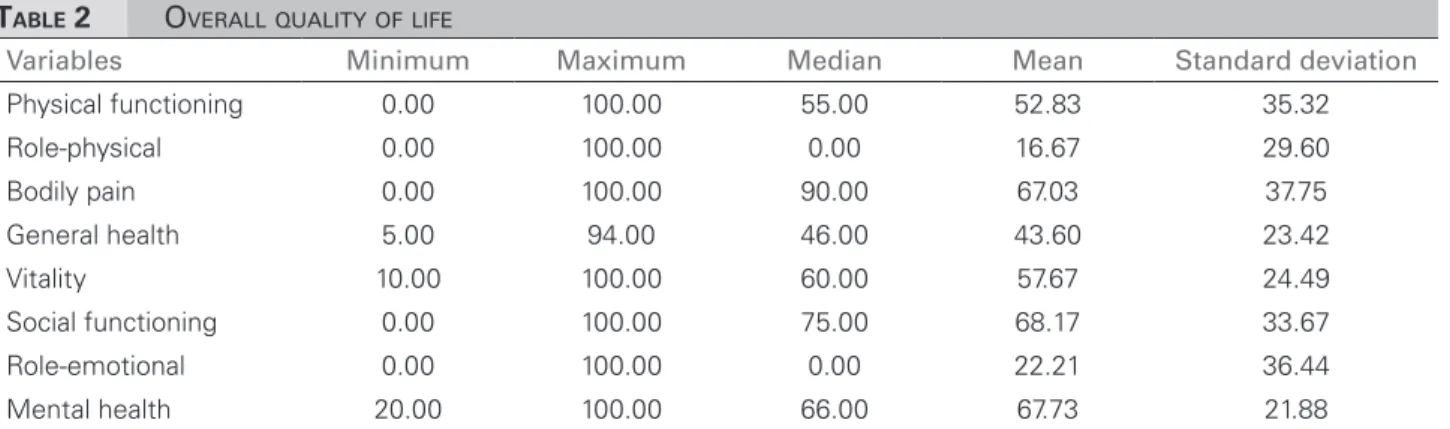
The lowest mean score observed among the SF-36 scales was in the role-physical (RP) scale (16.67 ± 29.60) and the highest in social functioning (SF) (68.17 ± 33.67), as shown in Table 2.
The mean values found in the analysis of the 24-hour dietary recall forms presented in Table 3 show that the subjects’ mean calorie intake (kcal/kg of body weight/day) was below the recommended levels for patients on hemodialysis. As 80% of the patients had some degree of malnutrition, adequate intake should be of at least 32 kcal/kg of body weight/day. Protein intake was also lower than recommended. The mean intake of carbohydrates and lipids was adequate.
The mean intake of total cholesterol was adequate, but the standard deviation revealed that intake values were significantly scattered, thus showing that many patients were having much less or much more cholesterol than recommended.
The lower values found for fiber intake in some patients speak of how little attention this nutrient has been given. The mean intake of calcium was far below adequate levels (410.81 ± 265.60 mg). The mean intakes of phosphorus (821.93 ± 357.19 mg), potassium (1770.18 ± 609.53 mg), and sodium (2470.90 ± 975.06 mg) were within recommended levels.
Table 4 shows a statistically significant correlation between HRQOL (physical functioning, bodily pain, vitality, and role-emotional scales) and variable values for Kcal/kg of bodyweight/day (mean 3-day value). All correlation coefficients were positive, i.e., as the value of variable Kcal/kg/day increases, so do the scores of qua-lity of life. The highest correlation coefficient was found between Kcal/kg/day and the physical functional scale, showing that higher Kcal/kg/day intake led to better physical functional capacity. There was no significant correlation between time on hemodialysis and QoL.
No statistically significant correlations were found between HRQOL and variables TST, MUAC, and BMI.
Table 5 shows the correlations between HRQOL and Kcal, PTN/kg of body weight/day, and CHO. Statistically significant (positive) correlations were seen between quality of life and the following: KCAL and physical functioning and bodily pain scales, the strongest of which with physical functioning; CHO and physical functioning and bodily pain scales, the strongest of which with bodily pain; PTN/kg of bodyweight/day and physical functioning, role-physical, bodily pain, vitality, role-emotional, and mental health scales, the strongest of which with physical functioning.
Correlations were found between HRQOL and fiber and calcium intake. Statistically significant correlations were seen between HRQOL and the following: fiber intake and physical functioning, bodily pain, and role-emotional scales, the strongest of which with bodily pain; calcium intake and the role-physical scale, phosphorus and physical functioning, bodily pain, and role-emotional scales, the strongest of which with bodily pain.
Quality of life and time for which the patient had been on dialysis were also tested, but no statistically significant correlation was found between these variables.
D
ISCUSSIONLow socioeconomic status has been implicated as a risk factor for chronic disease.18 In our study,
78.3% of the patients had low income levels (classes C and D). Zambonato et al.19 found that 89.6% of
CKD patients on dialysis were in classes C, D, and E. According to the authors, the association between low socioeconomic status and CKD can be attributed to factors such as difficulty having access to health care and inadequate management of hypertension and DM. Another factor that may bias the results of
TABLE 2 OVERALLQUALITYOFLIFE
Variables Minimum Maximum Median Mean Standard deviation
TABLE 3 24-HOURDIETARYRECALL (THREE-DAYMEANVALUES)
Variable Minimum Maximum Median Mean Standard deviation
Dry weight (kg) 46.40 110.20 64.50 66.26 12.55 KCAL 787.97 2972.38 1399.20 1445.70 466.21 Kcal/Kg of bodyweight/day 10.59 44.63 22.47 22.70 8.53 CHO (g) 100.58 445.77 197.45 206.36 74.87 PTN/Kg of bodyweight/day 0.30 1.92 0.92 1.02 0.41 PTN (g) 33.11 126.10 62.73 64.38 22.34 LIP (g) 23.22 84.98 40.90 40.61 14.14 Cholesterol (mg) 58.13 673.51 139.90 162.37 112.73 Fiber (g) 8.05 39.09 16.52 18.62 7.22 Ca (mg) 63.91 1258.81 349.80 410.81 265.60 P (mg) 340.89 1769.64 810.39 821.93 357.19 K (mg) 791.10 3447.44 1708.31 1770.18 609.53 Na (mg) 881.48 5721.95 2350.94 2470.90 975.06
TABLE 4 CORRELATIONSBETWEENQUALITYOFLIFE, KCAL/KG OFBODYWEIGHT/DAYANDTIMEONDIALYSIS
Quality of life
Kcal/kg of bodyweight/day (3-day mean values) Time on hemodialysis Correlation
coefficient p-value
Correlation
coefficient p-value
Physical functioning 0.669* 0.000 -0.283 0.130 Role-physical 0.342 0.064 -0.155 0.415 Bodily pain 0.604* 0.000 -0.103 0.587 General health 0.158 0.404 0.201 0.287 Vitality 0.419* 0.021 -0.180 0.342 Social functioning 0.180 0.340 0.210 0.266 Role-emotional 0.376* 0.040 -0.121 0.524 Mental health 0.288 0.123 -0.072 0.706
* Statistically significant correlation coefficients.
TABLE 5 CORRELATIONSBETWEENQUALITYOFLIFEANDINTAKEOF KCAL, CHO, AND PTN/KG OFBODYWEIGHT/DAY
Quality of life KCAL Carbohydrates PTN/Kg of bodyweight/day
Coefficient p-value Coefficient p-value Coefficient p-value
Physical functioning 0.568* 0.001 0.444* 0.010 0.610* 0.000 Role-physical 0.279 0.135 0.273 0.144 0.470* 0.009 Bodily pain 0.529* 0.003 0.461* 0.010 0.603* 0.000 General health -0.026 0.890 -0.048 0.802 0.076 0.691 Vitality 0.097 0.012 0.201 0.287 0.492* 0.006 Social functioning 0.949 0.325 -0.162 0.392 0.222 0.239 Role-emotional 0.325 0.080 0.253 0.178 0.439* 0.015 Mental health 0.254 0.176 0.215 0.254 0.419* 0.021
* Statistically significant correlation coefficients.
the study is that the clinic where the study was carried out saw patients from the Brazilian public health care system (SUS) only. According to the 2011 Dialysis Census, 84.9% of the HD centers provided their services to SUS patients.3
Systemic hypertension and diabetes mellitus are significant risk factors for the development of CKD.20 In our study, systemic hypertension and
in a study done in 2005, in which 42.4% of the subjects were hypertensive, 12.9% had diabetes, and 19.8% had both hypertension and diabetes.21
According to Batista et al.,22 successful clinical
management of CKD must include the following items: rigorous management of hypertension; glucose control in diabetic patients; correction of proteinuria; management of anemia; management of calcium and phosphorus levels; management of metabolic acidosis; and prevention of malnutrition.
The analysis of anthropometric data revealed significant discrepancies between the BMI classifications proposed by Riella & Martins15 and
the WHO.16 However, anthropometric measurements
have been found to be highly reproducible and 90% sensitive.13 Bioelectrical impedance tests were used
in overweight and obese dialysis patients to find reductions in body cell mass and phase angle, which suggested that even when BMI values were above normal patients could be at risk for malnutrition.23
The reported prevalence of malnutrition ranged from 6.7% to 73.3% in the different anthropometric methods used. A study with 58 dialysis patients from northeastern Brazil found, through anthropometric assessment, that 12.1% of the patients were malnourished according to the BMI, 84.5% accor-ding to TST, and 43% accoraccor-ding to the MUAC.24 A
study conducted in 20 dialysis centers with 574 pa-tients looked into BMI, arm circumference, TST, and MUAC and noted moderate/severe malnutrition in 51.6% of the male and 46.3% of the female patients.25
The mean age of the patients in our study was si-milar to that of Cabral et al.26 The 47 patients seen at
the Nephrology Service of the University Hospital of Pernambuco enrolled by the authors had a mean age of 50.4 years. To the authors, this sample comprised a relatively young group when compared to cohorts of European patients, whose reported mean age ranged between 58 and 62 years.
Oliveira et al.24 reported their patients had been
on dialysis for a mean of 4.27 years, whereas the indi-viduals in our study had been on dialysis for a mean of 3.61 years. In the United States the risk of death is estimated to increased by 6% for each additional year in dialysis after adjustments for several covariates. However, it is not clear whether the correlation between time on dialysis and risk of death is linear.27
In terms of HRQOL, although no statistically significant differences were found in the areas of
quality of life and gender, with the exception of the bodily pain domain, male patients had higher scores in all scales. A multicenter prospective study carried out in Canada enrolled 9,423 individuals and found that males had substantially higher scores than fema-les in all scafema-les and components of the SF-36; accor-ding to the authors, their scores were also higher than their American counterparts in all SF-36 scales.28
Biochemical tests usually draw attention to alterations patients are possibly experiencing. PTH values indicate the presence of secondary hyperparathyroidism in this population. This is a common complication among patients with chronic renal disease induced by hypocalcemia, hyperphosphatemia, calcitriol deficiency [1.25(OH)2D3] and skeletal resistance to PTH.29
Riella & Martins15 explained that PTH is released in
increased amounts in response to hypocalcemia to correct the reduction in calcium serum levels, once PTH acts on bone, which leads to release of calcium and phosphate.
Biochemical tests also indicate the presence of hyperkalemia, which, in severe cases, may trigger fatal arrhythmias. The dietary intake of this mineral should be controlled by managing potassium levels in the dialysate and educating patients on which foods they should cut down and on the proper preparation of foods to reduce the intake of potassium.15
The SF-36 elicited the areas in which patients had impaired performance. The scale with the most significant level of involvement was physical functioning, followed by role-emotional, and general health, which had mean scores below 50.
Comparing our results with those of other studies conducted in Brazil that used the SF-36 in HD patients, we observed that the role-physical scale also had the lowest scores.30 The findings reported by
Castro et al.31 corroborate our results as the social
functioning, bodily pain and mental health scales had the highest scores.
Cunha et al.32 described higher scores than our
study in social functioning. In contrast, the scale with the lowest score in the aforementioned study was bodily pain - curiously among the scales with the highest scores in our study.
Coelho et al.33 concluded in their study that patients
The analysis of patient 24-hour dietary recall forms revealed that the three-day mean calorie intake in Kcal/Kg/day was far below the ideal conditions for individuals as described in our sample. Most patients had calorie intake deficits in the range of at least 10 kcal/kg of body weight/day in relation to the minimum level required for weight repletion, while 80% of the patients had some degree of malnutrition.
Energy intake values close to our findings were reported by Martinez et al.35 In contrast, Favalessa
et al.36 described considerably higher mean energy intake
values that were closer or reached recommended levels. Mean protein intake was below appropriate levels required for weight repletion. Favalessa et al.36 and
Batista et al.22 reported mean protein intakes below
recommended levels, as also seen in our study. Valenzuela et al.5 found high mean protein intake levels, but 47% of
their sample also had less protein than recommended. By their turn, Santos et al.4 and Koehnlein et al.37 described
adequate mean protein intake levels.
Phosphorus and potassium intake levels were within normal range, as also reported by Valenzuela et al.,5 Batista et al.22, and Koehnlein et al.37 Favalessa
et al.36 described mean phosphorus intake below the
recommended levels, along with adequate levels of mean potassium intake.
Calcium intake was below recommended levels, which can be explained by the fact that calcium-rich foods are avoided because they are sources of phosphorus. A number of studies with patients on hemodialysis corroborate our findings.26,29,35
The mean sodium intake levels reported in our study are close to the recommended levels.15 Batista
et al.22 reported a similar finding. Vaz38 described
lower sodium intake levels.
The method used to investigate calorie intake, the R24h, has the following strengths: it is affordable, easy and quick to apply to patients, and allows for quantitative and qualitative assessment of patients’ diets. However, it also has limitations, such as relying on patients’ memories and on estimated food portion sizes, which may underestimate or overestimate interviewee actual calorie intake levels.39
Cupisti et al.40 carried out a study in Italy with
CKD patients on HD and observed mean intakes of cholesterol within the recommended range, at levels close to those found in our study.
Calorie intake seems to directly impact QoL, according to the data found in this population. Calorie intake was correlated with the physical functioning, vitality, role-physical, and role-emotional scales. These scales refer to difficulties in physical capacities and limitations in the type and amount of activities of daily living performed, the level of energy and fatigue, and the psychological well-being of patients.
Protein intake was correlated with more scales of HRQOL. Protein intake in hemodialysis patients was found to directly interfere with the capacity patients have of performing daily living activities because of fatigue or pain.
C
ONCLUSIONSeveral inadequacies in food intake were found in this study, indicating that patients do not maintain adequate nutrition, as recommended for their underlying disease. The lack of nutritional counseling may have led to these inadequacies. Food intake was correlated with quality of life, as the individuals with better quality of life were those who had higher levels of calorie intake.
However, one should be cautious when using this data, because food quality is very important for these patients. And increasing calorie intake in a disorganized manner, without guidance or proper recommendation, may adversely affect the patients’ general condition.
It is important to remember that this is a sample in which the majority of the patients was categorized as malnourished. However, at a global level this finding may not be consistent with every population and cannot, therefore, be extrapolated to any given set of subjects without prior study. Recent studies have shown that there are populations in which a significant portion of the sample is overweight. It is important to remember that obesity itself is a risk factor for CKD. Therefore, one must identify the limits of increasing or not the calorie intake levels of the target population.
R
EFERENCES1. Chaves GA, Graça MD, Gallo VC. Consumo alimentar e esta-do nutricional de pacientes com esta-doença renal crônica em trata-mento dialítico. Rev Bras Ciênc Saúde 2007;5:11-7.
2. Marques AB, Pereira DC, Ribeiro RCHM. Motivos e frequên-cia de internação dos pacientes com insuficiênfrequên-cia renal crônica em tratamento hemodialítico. Arq Ciênc Saúde 2005;12:67-72. 3. Sesso RCC, Lopes AA, Thomé FS, Lugon JR, Watanabe Y, San-tos DR. Diálise Crônica no Brasil - Relatório do Censo Brasilei-ro de Diálise, 2011. J Bras NefBrasilei-rol 2012;34:272-7. DOI: http:// dx.doi.org/10.5935/0101-2800.20120009
4. Santos PR, Pontes LRSK. Mudança do nível de qualidade de vida em portadores de insuficiência renal crônica terminal durante seguimento de 12 meses. Rev Assoc Med Bras 2007;53:329-34. DOI: http://dx.doi.org/10.1590/S0104-42302007000400018 5. Valenzuela RG, Giffoni AG, Cuppari L, Canziani ME. Estado
nutricional de pacientes com insuficiência renal crônica em he-modiálise no Amazonas. Rev Assoc Med Bras 2003;49:72-8. DOI: http://dx.doi.org/10.1590/S0104-42302003000100037 6. Cunha FL, Zatta TL, Vasconcelos P, Barbosa AM, Santos
JS, Rosa LFO. Avaliação da qualidade de vida de portadores de insuficiência renal crônica em diálise renal. Enferm Glob 2011;10:165-71.
7. Barbosa LMM, Junior MPA, Bastos KA. Preditores de qualida-de qualida-de vida em pacientes com doença renal crônica em hemodiá-lise. J Bras Nefrol 2007;2:222-8.
8. Resolução 196/96 do Conselho Nacional de Saúde/Minis-tério da Saúde. Dispõe sobre diretrizes e normas regulamen-tadoras da pesquisa envolvendo seres humanos [Acesso em: 01 nov 2012]. Disponível em: http://www.bioetica.ufrgs.br/ res19696.htm.
9. ABEP - Associação Brasileira de Empresas de Pesquisa. Crité-rio de Classificação Econômica Brasil - CCEB. Disponível em: acesso em: 29 mai. 2012.
10. Ciconelli RM. Tradução para o português e validação do ques-tionário genérico de avaliação de qualidade de vida “Medical outcomes study 36 item short-form health survey (SF-36)” [Tese de doutorado]. São Paulo: Universidade Federal de São Paulo: Escola Paulista de Medicina; 1999.
11. Cabral DL. Comparação dos instrumentos SF-36 e perfil de saúde no Nottingham para avaliação da qualidade de vida de indivíduos pós Acidente Vascular Encefálico [dissertação]. Re-cife: Departamento de Fisioterapia da Universidade Federal de Pernambuco - UFPE; 2011.
12. Fisberg RM, Martini LA, Slater B. Métodos de inquéritos ali-mentares. In: Fisberg RM, Slater B, Marchioni DML, Martini LA, org. Inquéritos alimentares: métodos e bases científicos. 1ª ed. Barueri: Manole; 2005. p.1-29.
13. Blackburn GL, Thornton PA. Nutritional assessment of the hospitalized patient. Med Clin North Am 1979;63:11103-15. PMID: 116095
14. Frisancho AR. New norms of upper limb fat and muscle areas for assessment of nutritional status. Am J Clin Nutr 1981;34:2540-5. PMID: 6975564
15. Martins C, Riella MC. Nutrição e hemodiálise. In: Riella MC, Martins CM. Nutrição e o rim. Rio de Janeiro: Guanabara Koogan; 2011. p.114-31.
16. World Health Organization. Obesity Technical Report Series. Health Organization Consultation, Geneva; 2000. p.256. 17. Fontes D. Avaliação do estado nutricional do paciente
grave-mente enfermo [dissertação]. Belo Horizonte: Faculdade de Medicina da Universidade Federal de Minas Gerais, Faculdade de Medicina, Departamento de Cirurgia; 2011.
18. Adler NE, Ostrove JM. Socioeconomic status and health: what we know and what we don't. Ann N Y Acad Sci 1999;896:3-15. PMID: 10681884 DOI: http://dx.doi. org/10.1111/j.1749-6632.1999.tb08101.x
19. Zambonato TK, Thomé FS, Gonçalves LFC. Perfil Socioe-conômico dos pacientes com doença renal crônica em diá-lise na região noroeste do Rio Grande do Sul. J Bras Nefrol 2008;30:192-9.
20. Romão Jr JE. A doença renal crônica: do diagnóstico ao trata-mento. Prát Hosp (São Paulo, 1999) 2007;183-7.
21. Ribeiro RCHM, Oliveira GASA, Ribeiro DF, Bertolin DC, Ce-sarino CB, Lima LCEQ, et al. Caracterização e etiologia da in-suficiência renal crônica em unidade de nefrologia do interior do Estado de São Paulo. Acta Paul Enferm 2008;21:207-11. DOI: http://dx.doi.org/10.1590/S0103-21002008000500013 22. Batista LKC, Pinheiro HS, Fuchs RC, Oliveira T, Belchior FJE,
Galil AGS, et al. Manuseio da doença renal crônica com hiper-tensão e diabetes. J Bras Nefrol 2005;27:8-13.
23. Guida B, De Nicola L, Pecoraro P, Trio R, Di Paola F, Iodice C, et al. Abnormalities of bioimpedance measures in overwei-ght and obese hemodialyzed patients. Int J Obes Relat Me-tab Disord 2001;25:265-72. DOI: http://dx.doi.org/10.1038/ sj.ijo.0801475
24. Oliveira CMC, Kubrusly M, Mota RS, Silva CAB, Oliveira VN. Desnutrição na insuficiência renal crônica: qual o melhor méto-do diagnóstico na prática clínica? J Bras Nefrol 2010;32:57-70. 25. Marcén R, Teruel JL, de la Cal MA, Gámez C. The impact of
malnutrition in morbidity and mortality in stable haemodialy-sis patients. Spanish Cooperative Study of Nutrition in Hemo-dialysis. Nephrol Dial Transplant 1997;12:2324-31.
26. Cabral PC, Diniz AS, Arruda IKG. Avaliação nutricional de pa-cientes em hemodiálise. Rev Nutr 2005;18:29-40. DOI: http:// dx.doi.org/10.1590/S1415-52732005000100003
27. Chertow GM, Johansen KL, Lew N, Lazarus JM, Lowrie EG. Vintage, nutritional status, and survival in hemodialysis pa-tients. Kidney Int 2000;57:1176-81. PMID: 10720970 DOI: http://dx.doi.org/10.1046/j.1523-1755.2000.00945.x
28. Hopman WM, Towheed T, Anastassiades T, Tenenhouse A, Poliquin S, Berger C, et al. Canadian normative data for the SF-36 health survey. Canadian Multicentre Osteoporosis Study Research Group. CMAJ 2000;163:265-71. PMID: 10951722 29. Peters BSE, Jorgetti V, Martin LA. Influência do
hiperparati-reoidismo secundário grave no estado nutricional de pacientes com insuficiência renal crônica. Rev Nutr 2006;19:111-8. DOI: http://dx.doi.org/10.1590/S1415-52732006000100012 30. Cattai GBP, Rocha FA, Nardo Junior N, Pimentel GGA.
Quali-dade de vida em pacientes com insuficiência renal crônica - SF-36. Ciênc Cuid Saúde 2007;6:460-7.
31. Castro M, Caiuby AVS, Draibe SA, Canziani MEF. Qualidade de vida de pacientes com insuficiência renal crônica em hemo-diálise avaliada através do instrumento genérico SF-36. Rev As-soc Med Bras 2003;49:245-9. DOI: http://dx.doi.org/10.1590/ S0104-42302003000300025
32. Cunha MS, Andrade V, Guedes CAV, Meneghetti CHZ, Aguiar AP, Cardoso AL. Avaliação da capacidade funcional e da qua-lidade de vida em pacientes renais crônicos submetidos a trata-mento hemodialítico. Fisioter Pesq 2009;16:155-60.
33. Coelho CC, Aquino ES, Lara KL, Peres TM, Barja PR, Lima EM. Repercussões da insuficiência renal crônica na capacida-de capacida-de exercício, estado nutricional, função pulmonar e mus-culatura respiratória de crianças e adolescentes. Rev Bras Fisioter 2008;12:1-6. DOI: http://dx.doi.org/10.1590/S1413-35552008000100002
34. Reboredo MM, Henrique DMN, Bastos MG, Paula RB. Exer-cício físico em pacientes dialisados. Rev Bras Med Esporte 2007;13:427-30. DOI: http://dx.doi.org/10.1590/S1517-86922007000600014
36. Favalessa E, Neitzke L, Barbosa GC, Molina MDCB, Salaro-li LB. AvaSalaro-liação nutricional e consumo aSalaro-limentar de pacien-tes com insuficiência renal crônica. Rev Bras Pesqui Saúde 2009;11:39-48.
37. Koehnlein EA, Yamada NA, Giannasi ACB. Avaliação do estu-do nutricional de pacientes em hemodiálise. Acta Sci Health Sci 2008;30:65-71. DOI: http://dx.doi.org/10.4025/actascihealths-ci.v30i1.4397
38. Vaz IMF. Consumo e hábitos alimentares de pacientes em he-modiálise crônica do Hospital das Clínicas de Goiânia-GO. [dissertação]. Goiânia (GO). Universidade Federal de Goiás; 2010.
39. Holanda LB, Barros Filho AA. Métodos aplicados em inquéri-tos alimentares. Rev Paul Pediatria 2006;24:62-70.