E L S E V I E R Ecological Modelling 82 (1995) 151-160
A mechanistic model of the effects of light and temperature on
algal primary productivity
P. Duarte
Faculdade de Ciencias e Tecnologia, Quinta de Torre, 2825 Monte de Caparica, Portugal
Received 15 December 1993; accepted 10 May 1994
Abstract
In this work a model of algal primary productivity combining a mechanistic light function with a temperature Arrhenius function is presented.
Data on primary productivity obtained with algae acclimated to different environmental conditions was used to test the model. A simple method for model parameter estimation based on regression analysis is described. The parameter estimates can be improved by a non-linear least-squares method (e.g. the Gauss-Newton method) resulting in a significant fit to the observed data as tested by regression analysis.
According to the present model, the initial slope of the productivity/light curves is temperature dependent whilst the optimal light intensity is temperature independent. These model predictions were validated by the obtained experimental results.
Keywords: Algae; Light; Production, primary; Temperature
1. Introduction
During the last decades several mathematical formulations of algal primary productivity ( P ) as a function of light intensity ( I ) were developed (e.g. Steele, 1962; Vollenweider, 1965; Jassby and Platt, 1976; Platt et al., 1980; Iwakuma and Ya- suno, 1983). Those formulations are mainly em- pirical giving a static representation of the depen- dence of the production rate on light intensity (Eilers and Peeters, 1988).
There are a few parameters that are common to almost all models or can be derived from them, namely the initial slope (S) of the P versus I curves (or quantum yield), the optimal light inten- sity (/opt) and the maximal production rate (Pm~)-
The choice of a particular formulation may lead to different estimates of the P - ! curve parame- ters (Frenette et al., 1993). A detailed description of some of the existing models can be found in Jassby and Platt (1976), Iwakuma and Yasuno (1983), Odum (1983) and Parsons et al. (1984).
Equations that combine the effects of several environmental variables such as light intensity, temperature and nutrient concentrations can also be found (e.g. Keller, 1989). In this case Pm~x is usually expressed as a function of an other pa- rameter (e.g. temperature) a n d / o r limiting fac- tors multiplied by the light function (e.g. Cloern, 1977; Keller, 1989; Fasham et al., 1990).
Eilers and Peeters (1988) proposed a dynamic mechanistic formulation for the relationship be- 0304-3800/95/$09.50 © 1995 Elsevier Science B.V. All rights reserved
tween light intensity and the rate of photosynthe- sis. As stated by those authors a dynamic model can be more useful for testing the effects of different factors on model parameters and char- acteristics of the production curves. Eilers' model describes the photosynthetic processes and those connected with photoinhibition, producing P - I
curves similar to those obtained with the models of Vollenweider (1965) and Platt et al. (1980).
Eilers' model predicts that the initial slope of the P - I curves is temperature independent whilst Pm~x and /opt change in the same proportion to temperature. This conflicts with recent physiolog- ical data (see e.g. Davison (1991) for a review). The initial photochemical reactions are tempera- ture independent but the subsequent biochemical reactions are dependent on temperature. Be- cause of this, the light harvesting efficiency or slope may also vary with temperature.
There seems to be general agreement on the temperature dependence of Pm~x through an ex- ponential relationship at temperatures below the temperature optimum (see Cloern, 1977 and Keller, 1989). The dependence of/opt o n temper- ature does not appear to be clearly established.
The experimental measurement of the P - I
curve parameters is complicated by the fact that they may change as algae adapt to varying envi- ronmental conditions. Light intensity, tempera- ture and nutrient concentrations are known to influence the light harvesting efficiency of algae (Davison, 1991; Falkowski and LaRoche, 1991; Turpin, 1991). These changes may be relevant for multiple-day laboratory experiments.
A way to reduce the natural variability of the
P - I curve characteristics is to keep the individu- als at constant conditions during a time period large enough for them to acclimate. The available data suggests that acclimation begins a few hours after the algae are exposed to a change in tem- perature a n d / o r light (Algarra and Niell, 1990; Davison, 1991; Falkowski and LaRoche, 1991).
The objectives of this work are the following: 1. development of a production model incorpo-
rating the influence of temperature on photo- synthesis;
2. development of a methodology allowing an easy estimation of the model parameters;
3. validation of the model by comparison of its predictions to experimental data obtained with the red algae Gelidium sequipedale pre- acclimated to different conditions.
2. Methodology
2.1. Structure of the model
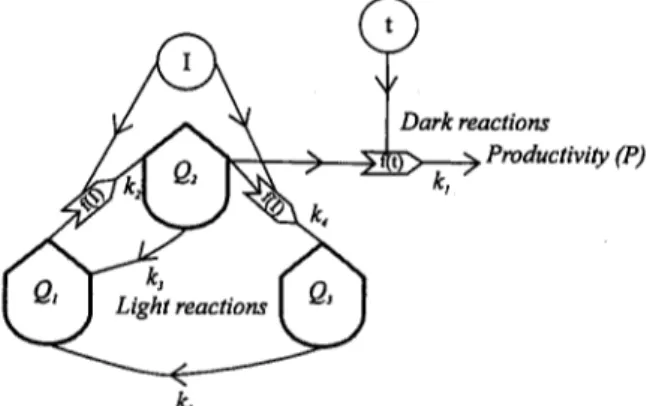
Eilers and Peeters (1988) considered three possible states for the absorbing pigments ("pho- tosynthetic factories" (PSF) sensu Crill, 1977): fundamental, excited and inhibited. The transi- tions from the fundamental to the excited state and from the excited to the inhibited state are proportional to I and to the rate constants k 1 and k 2 (Fig. 1). The recovery rate or probability of the excited PSF to the fundamental state ( k 3
in Fig. 1) is assumed to be dependent on how fast energy is used in the dark temperature-depen- dent reactions. The recovery rate of the inhibited to the fundamental state (k 5 in Fig. 1) corre- sponds to repair from photoinhibition.
In the present model the existence of these three possible states for the light absorbing pig- ments (PSF) is also considered. The fluxes be- tween the three states are biophysical and de- pend solely on light intensity and on the numeri- cal values of the constants (k 2 to k 5) shown in
~Dark reactions
~, ~
Productivity (P)
@
k,
P. Duarte ~Ecological Modelling 82 (1995) 151-160 153
Fig. 1. The constant k 3 is not assumed to be necessarily related to the dark reactions as in Eilers' model, because the recovery of the excited to the fundamental state may occur without the liberation of oxygen from the water (Megard et al., 1984) and consequent energy generation to the dark reactions. The transition of absorbed energy to the organic compounds that are synthe- sised in the dark reactions of photosynthesis is temperature dependent as all biochemical pro- cesses. This temperature dependence is repre- sented by an Arrhenius function with coefficient's d and e (Fig. 1). This function can be improved to achieve a maximum above which temperature will inhibit photosynthesis (Odum, 1983). In the pre- sent work such modification was not imple- mented because the experimental data used to test the model did not cover a temperature range large enough to attain that maximum.
Therefore in the model presented in this paper there is a clear separation between the light and dark photosynthetic reactions. This is the main difference from Eilers' model where the recovery of the pigments from the excited state is directly connected to those reactions. In a recent paper Eilers and Peeters (1993) gave an interesting dy- namic analysis of the previously described model (Eilers and Peeters, 1988), providing some impor- tant results that can help to clarify the influence of light intensity and incubation time in the anal- ysis of productivity experiments. However, the influence of temperature is analysed in a way similar to their previous work (Eilers and Peeters, 1988).
In the derivation of differential equations that follows it will be clear how the differences be- tween the Eiler's and the present model are reflected in the predicted behaviour of the P - I
curve parameters.
Let Q1, Q2 and 03 represent the quantities of PSF at the different states and P the photosyn- thetic gross productivity. From the possible tran- sitions under steady state-conditions it follows:
aQ1
Ot = - k 2 Q l I + k3Q2 + ksQ3 = 0 (1)
OQ2
ot = k E Q l I - kaQ2 - k 4 Q 2 I = 0 (2)
OQ3
at = k 4 Q 2 I - ksQ3 = 0 (3)
Q~ + Q2 + Qa = k (4)
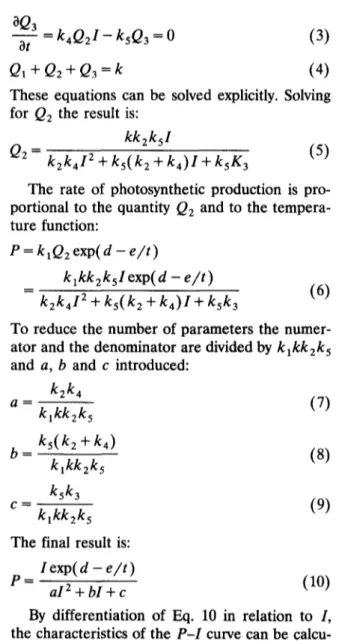
These equations can be solved explicitly. Solving for Q2 the result is:
k k E k s I
Q2 = k2k412 + k5(k 2 + k 4 ) i + k5K3 (5)
The rate of photosynthetic production is pro- portional to the quantity Q2 and to the tempera- ture function:
P = k l Q E e x p ( d - e / t )
k l k k 2 k s I exp( d - e / t )
(6)
kEk4 I2 + ks(k 2 + k 4 ) I + ksk3
To reduce the number of parameters the numer- ator and the denominator are divided by k l k k E k 5
and a, b and c introduced:
k2k4
a (7)
k l k k z k 5
k5(k 2 + k4)
b (8)
k l k k E k 5
ksk3
c = - - (9)
k l k k 2 k s
The final result is:
I e x p ( d - e / t )
(10)
P = aI2 + bI + c
By
differentiation of Eq. 10 in relation to I, the characteristics of the P - I curve can be calcu- lated:/opt = ~
(11)
exp( d - e / t )
Pm~,= 2av~ + b (12)
exp( d - e / t )
S -- (13)
c
light function can be expressed in terms of /opt, Pmax and S by the following reverse solutions:
exp(d - e / t )
a = Sio2pt (14)
e x p ( d - e / t ) 2 exp(d - e / t )
b -- Pma~ (15)
e x p ( d - e / t )
C =
S
Stopt
(16)
2.2. Experimental
Gelidium sesquipedale fronds were collected on the west coast of Portugal near Lisbon. After collection the algae were kept in the laboratory for a period of more than three weeks and accli- mated to artificial "Winter" and "Summer" con- ditions. Water temperature, photoperiod and light intensity during daylight hours were kept stable during the acclimation pre-treatments. This pre- cautions were used in order to reduce the natural variability of the model parameters as a result of adaptation to varying environmental conditions (Cosby et al., 1984) and to evaluate its variability due to seasonal physiological adaptation.
Four pre-treatments were employed: two simu- lating winter conditions and two simulating sum- mer conditions. Temperature was kept at 14.5°C in the first two pre-treatments and at 18.5°C in the last two, whilst photoperiod was respectively 11.5 and 14.5 h. Each pair of winter and summer pre-treatments differed only in the light intensity used, reproducing the average light intensity con- ditions at 9 and 13 m depth. In the winter pre- treatment these corresponded to 9 and 4 /zmol m -2 s -~ photons respectively whilst in the sum- mer pre-treatment corresponded to 16 and 11 /zmol m -2 s- 1 photons respectively.
After the pre-treatment algal samples were placed in 1000-ml jars in an incubation chamber and submitted to various combinations of temper- ature and light intensity. Productivity was mea- sured from oxygen differences. The temperatures used were 11, 14, 18, 22 and 26 ° C. At each of these temperatures, productivity was measured at the light intensities 0, 2, 4, 97, 206 and 270/~mol
m -2 S -1, leading to five sets of productivity re- sults versus light intensity from each pre-treat- ment. Three replicates and a control were used for each light/temperature combination. For fur- ther details on experimental procedures see Duarte (1990) and Duarte and Ferreira (1993).
2.3. Fitting the m o d e l to experimental data
Fitting was carried out separately on data ob- tained with algae pre-treated in each of the four different ways described previously. The fit of the model to experimental data is complicated by the fact that Eq. 10 is a two-dimensional function representing a surface rather than a line.
A two-step fitting methodology was followed in this work. In the first step preliminary estimates of a, b, c, d and e must be obtained. In the second step these estimates are optimised with a non-linear least squares procedure such as the Gauss-Newton or the Marquardt algorithm (Marquardt, 1963; Glass, 1967).
The first step can be divided in two stages. In the first, a second-order bivariate regression of P as a function of light and temperature is calcu- lated using the usual formula:
P = a o + a l I + a2t + a3 I2 + a4 t2 + a s I t (17) By differentiation and maximisation of the re- gression equation in relation to I and t, /opt and the optimum temperature top t c a n be estimated:
0P
= a 1 + 2 a 3 I + ast = 0 (18)
= a 2 + 2a4t + a s I = 0 (19) a 1 + ast
/opt = 2a 3 (20)
a z + a s I
top t = 2 a 4 (21)
When the range of experimental data includes only the exponential part of the temperature de- pendence as in the present work, Eq. 21 will lead to a top t outside the experimental temperature range. In certain cases the obtained value may be biologically meaningless. If any of these problems
m
oI
OP
P. Duarte ~Ecological Modelling 82 (1995) 151-160 155
arises, a temperature as close as possible to the optimum value must be used to calculate /opt with Eq. 20. The choice should be among the highest tested temperatures.
Solving the regression equation for Iop t and top t allows the calculation of Pm~," The slope can be calculated as the value of the derivative when I - - 0 .
In the second stage, productivity values at the estimated/opt and all measured temperatures are computed from the regression equation. A linear regression analysis is performed on the natural logarithms of the calculated P values as a func- tion of 1 / t to estimate the parameters d and e of the Arrhenius function. At
/opt
light intensity, temperature will be responsible for most of the variance of the productivity data, under the as- sumption that there are no other limiting factors. The light function parameters a, b and c are then calculated with the reverse Eqs. 14, 15 and 16.In the second step the partial derivatives of Eq. 10 with respect to each of the five parameters must be calculated and they are the following:
OP 13 exp(d - e / t )
- - = - ( 2 2 )
Oa ( a i 2 + b i + c ) 2
aP I2 exp(d - e / t )
- - = - ( 2 3 )
ab ( a i 2 + b i + c ) z
OP I e x p ( d - e / t )
- - = - ( 2 4 )
ac ( a i 2 + b i + c ) 2
OP I e x p ( d - e / t )
(25)
Od a I 2 + bI + c
aP I exp(d - e / t )
- - = - ( 2 6 )
Oe ( a I 2 + b l + c ) t
In the present work the Gauss-Newton and the Marquardt methods were used to optimise the parameter values by minimising the residual sum of squares (Glass, 1967). Normally the pre- liminary parameter estimates obtained as de- scribed above are generally accurate enough con- sidering the experimental and analytical errors involved typically in productivity measurements.
Thus in some cases, the use of the non-linear least-squares techniques did not improve signifi- cantly the preliminary parameter estimates.
The predictive ability of the fitted model was tested by model II regression analysis (Laws and Archie, 1981; Sokal and Rohlf, 1981) between the measured and calculated values. The slope of the regression line, the y-intercept and the propor- tion of variance explained by the regression, were used as measures of the model goodness of fit.
2.4. Behaviour of the P - I curve parameters in relation to temperature
To test the model predictions on the behaviour of S and /opt with changing temperature a sec- ond-order polynomial fit was carried out on each set of productivity results obtained at each of the five experimental temperatures (see above). S and Iopt were estimated in a similar way to that described above (Eqs. 17, 18, 19, 20 and 21) but having only light intensity as the independent variable:
P = a l I + a 2 I 2 (27)
G P P
r n g l C ~ - I 0 . ] ~ h-~ ' '
0 . 4 ~ ~ 0.
26 °C
2 ~ 16
eq
¢M
PFD gmolrn-2s -~
aP
8--7 = al + 2 a 2 I = 0 (28)
a l
/opt = 2 a 2 (29)
As before, the slope was calculated from the derivative when I---0. Therefore, for each pre- treatment five values of S and lop t were esti- mated.
The effects of temperature and acclimation on the variance of S and /opt were tested by a two-way ANOVA model I without replication. Five levels were considered for temperature and four for acclimation (the four pre-treatments). A Tukey's test was used to confirm the absence of a significant interaction between the two factors at the 95% confidence level (Underwood, 1981). The use of the two-way ANOVA would not be correct in the presence of a significant interaction
between both factors due to the lack of replica- tion (Sokal and Rohlf, 1981).
3. Results and discussion
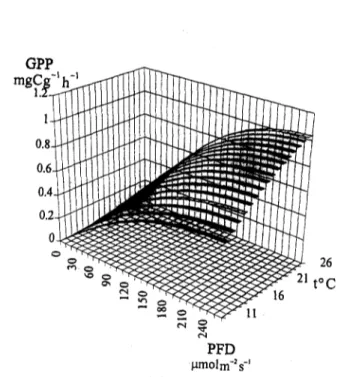
Fig. 2 shows the general shape of the gross primary productivity curves obtained by fitting the model to the experimental data. There was no evidence of photoinhibition. The measured and calculated productivities are well within the range observed by the author during field experi- ments (Duarte and Ferreira, 1993).
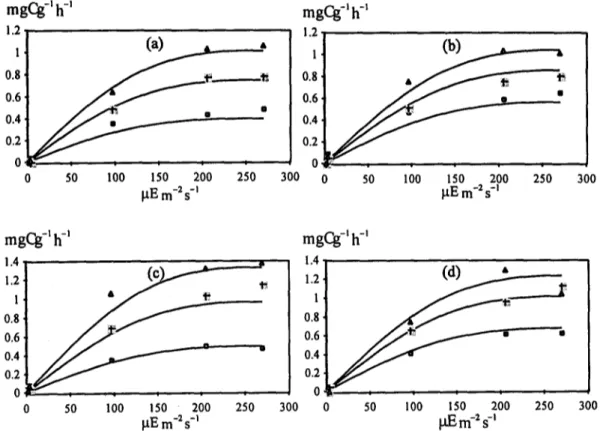
Figs. 3a-d show the productivity results and estimates at three of the tested temperatures with algae pre-acclimated as explained above. It should be noted that fitting was carried on two dimen- sions (light and temperature), i.e. on a surface
mgCg -I h-' mgCg -l h -I
2,
l --
"
l
( b )0.81
,o.8
0.6 0.6 •
0.4 0.4
0.2 0.2
0 ~ : : : ' : 0 " I 1 ~ - - , * . ,
0 50 100 150 200 250 300 0 50 100 150 200 250 300
gEm -2 s -I I~E m -2 s -I
mgCg -I h -I
mgCg-' h-'
°o:, " -° - i
0'20 . : . . , 0 I V , , , , ,
0 50 100 150 200 250 300 0 50 100 150 200 250 300
I~E m -2:1 I~E m-2 s-i
P. Duarte ~Ecological Modelling 82 (1995) 151-160
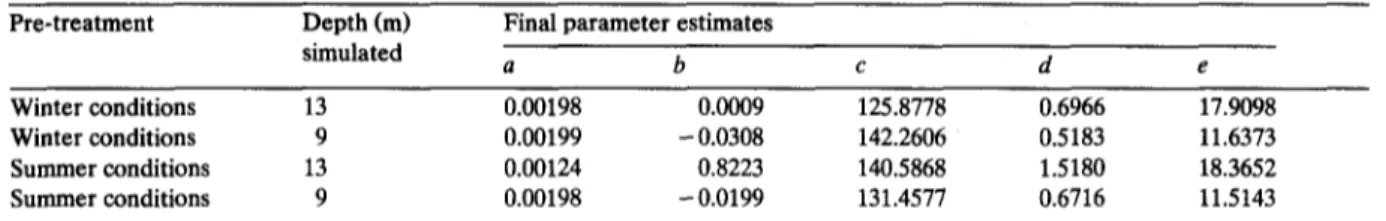
Table 1
Final model parameter estimates (see text for explanation)
157
Pre-treatment Depth (m) simulated
Final parameter estimates
a b c d e
Winter conditions 13 0.00198 0.0009 125.8778 0.6966 17.9098
Winter conditions 9 0.00199 - 0.0308 142.2606 0.5183 11.6373
Summer conditions 13 0.00124 0.8223 140.5868 1.5180 18.3652
Summer conditions 9 0.00198 - 0.0199 131.4577 0.6716 11.5143
and not on each of the shown lines (see above). In Table 1 the final model parameter estimates used to calculate the productivity curves shown in Fig. 3 are shown.
Figs. 4a-d summarise the results of the linear regressions between the measured and predicted productivity values at all light/temperature com- binations for algae acclimated in the four differ-
Predicted = (-0. 004 ± O. 082 ) + (1.030 ± O. 040 ). Observed
1.2
"x:) 0.8
(D
0.6 I~ 0.4 0.2
(a)
J
0 0.2 0.4 0.6 0.8 1 O b s e r v e d
1.2 1.
0 . 8 ,
' ~ 0.6, 0.4. 0.2, 0 1.2
Predicted = (0.037 ± O. 032 ) + (0. 968 ± O, 072 ). Observed
~ m
0 0.2 0.4 0.6 0.8 1 1.2 O b s e r v e d
Predicted = (0.002 + 0.034 ) + (1.003 + 0.065 ).Observed
1.4 1.4
1.2 aP 1.2
~ 0 8
= •
:.~ 0.8'8
; ~ 0 . 6 ~ 0.6
0.4 0.4
0.2 0.2
0 0
Predicted = ( .0.005 + O. 030 ) + (I. 010 + 0,058 ). Observed
0 0.2 0.4 0.6 0.8 1 1.2 1.4 0 0.2 0.4 0.6 0.8 1 1.2 1.4
O b s e r v e d O b s e r v e d
ent ways described above. None of the y-inter- cepts differ significantly from zero and none of the slopes differ significantly from 1 at the 95% confidence level. The ratio between explained to total variance is very close to 1 (always above 0.96). From these results it may be concluded that the quality of the fitting is good.
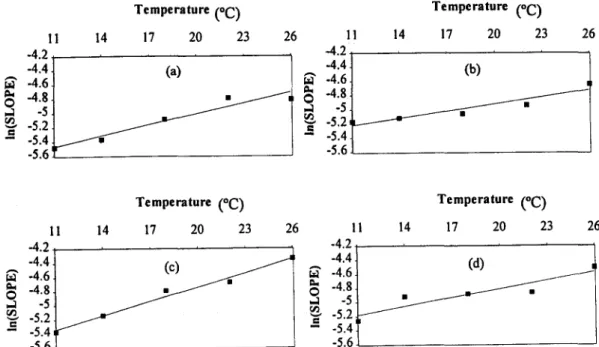
The results obtained with the two-way ANOVAs on the separate effects of acclimation and temperature on S and /opt confirmed the null hypothesis about the absence of significant treatment effects in all cases except the tempera- ture on the slope ( p < 0.05). These results con- firmed the model predictions on the temperature independence of /opt and temperature depen- dence of S.
A linear regression analysis was carried out between In(S) and temperature. The regression obtained is highly significant (Fig. 5) confirming the exponential relationship between S and tem- perature predicted by the model.
Recently, the model of Eilers and Peeters (1988) was used by Bendoricchio et al. (1993) for
modelling the photosynthetic efficiency of Ulva rigida. These authors fitted Eilers' model to dif- ferent P - I curves obtained at various tempera- tures by expressing the parameters a and b as an exponential decaying function of temperature.
According to the model described in this work the temperature functions obtained by those au- thors could not be explained by changes in the parameters a and b itself but to the parameters S and Pm~x on which they depend. Neglecting the temperature functions from the model presented here, Eqs. 14 and 15 can be rewritten as in Eilers and Peeters (1988):
1
a = ~I~OT'~ t ( 3 0 )
1 2
b = - - (31)
Pmax S/opt
Using these equations and assuming that S and Pm~x will behave as predicted in this work, a and b will decay exponentially with temperature.
I1 14 -4.2
-4.4 t -4.6
!-5 2
-- -5.4 ~ . t - - - I f f
-5.6
Temperature (oC)
17 20 23 26
(a)
/ J /
11 -4.2 -4.4 -4.6 -4.~
~- -5.2
- -5.4
-5.6
Temperature (°C)
14 17 20 23 26
(b)
11 14
Temperature (oC)
17 20 23 26
-4.2
-4.6
-5:2
-- -5.4 -5.6
Temperature (oC)
1 i 14 17 20 23 26
-4.2 ,
-4.4 t (d)
-4.6
-48
J
-1 -5 ~ / -5.2 ~'- -5.4
-5.6
P. Duarte ~Ecological Modelling 82 (1995) 151-160 159 This could explain the trends observed by Ben-
doricchio et al. (1993). On the other hand, if Eqs. 14 and 15 are used, since S and Pma~ change exponentially with temperature, the ratios be- tween the temperature functions and these pa- rameters are constant, reason why a and b will not change with incubation temperature. This is a very important difference between the model pre- sented here where a and b are assumed to ac- count only for biophysical reactions and Eilers' model in which a and b also account for temper- ature-dependent biochemical reactions.
From the results described above the present model appears to provide a good description of the behaviour of the P - I curve parameters ac- cording to what is known from the physiology of photosynthesis. The usefulness of the model has been demonstrated by the quality of the fittings obtained with experimental data. The two-step fitting procedure described above proved very effective in overcoming the natural difficulties in fitting a two-dimensional function with five pa- rameters (Eq. 10) to experimental data.
Acknowledgements
This work was supported by JNICT (PhD grant no. 154-IG) and INETI.
The author wishes to thank Dr J.G. Ferreira and Dr A. Afonso for helpful discussion and revision of the draft manuscript. Drs C. Peneda, F. Duarte, Cancela da Fonseca L. and O. Luis are also gratefully acknowledged for assistance in laboratory work.
References
Algarra, P. and Niell, F.X., 1990. Short-term pigment re- sponse of Corallina elongata Ellis et Solander to light intensity. Aquat. Bot., 36: 127-138.
Bendoricchio, G., Coffaro, G. and Di Luzio, M., 1993. Mod- elling the photosynthetic efficiency for Ulva rigida growth. Ecol. Model., 67: 221-232.
Cloern, J.E., 1977. Effects of light intensity and temperature on Cryptomonas ovata (Cryptophyceae) growth and nutri- ent uptake rates. J. Phycol., 13: 389-395.
Cosby, B.J., Hornberger, G.M. and Kelly, M.G., 1984. Identi- fication of photosynthesis-light models for aquatic sys- tems. II. Application t o a macrophyte dominated stream.
Ecol. Model., 23: 25-51.
Crill, P.A., 1977. The photosynthesis-light curve: a simple analog model. J. Theor. Biol., 6: 503-516.
Davison, I.R., 1991. Minireview. Environmental effects on algal photosynthesis: Temperature. J. Phycol., 27: 2-8. Duarte, P., 1990. Determina~o da produtividade liquida da
alga agar6fita Gelidium sesquipedale. In: 1 ° Encontro na- cional sobre macroaigas marinhas. LNETI, Lisboa, 97-105. Duarte, P. and J.G. Ferreira, 1993. A methodology for param- eter estimation in seaweed productivity modelling. Hydro- biologia, 260/261: 183-189.
Eilers, P.H.C. and Peeters, J.C.H., 1988. A model for the relationship between light intensity and the rate of photo- synthesis in phytoplankton. Ecol. Model., 42: 199-215. Eilers, P.H.C. and Peeters, J.C.H., 1993. Dynamic behaviour
of a model for photosynthesis and photoinhibition. Ecol. Model., 69: 113-133.
Falkowski, P.G. and LaRoche, J., 1991. Minireview. Acclima- tion to spectral irradiance in algae. J. Phycol., 27: 8-14. Fasham, M.J.R., Ducklow, H.W. and McKelvie, S.M., 1990. A
nitrogen-based model of plankton dynamics in the oceanic mixed layer. J. Mar. Res., 48: 591-639.
Frenette, J.-J., Demers, S., Legendre, L. and Dodson, J., 1993. Lack of agreement among models for estimating the photosynthetic parameters. Limnol. Oceanogr., 38: 679- 687.
Glass, R.N., 1967. A technique for fitting nonlinear models to biological data. Ecology, 48: 1010-1013.
Iwakuma, T. and Yasuno, M., 1983. A comparison of several mathematical equations describing photosynthesis-light curve for natural phytoplankton populations. Arch. Hydro- biol., 97: 208-226.
Jassby, A.D. and Platt, T., 1976. Mathematical formulation of the relationship between photosynthesis and light for phy- toplankton. Limnol. Oceanogr., 21: 540-547.
Keller, A.A., 1989. Modeling the effects of temperature, light, and nutrients on primary productivity: An empirical and a mechanistic approach compared. Limnol. Oceanogr., 34: 82-95.
Laws, E.A. and Archie, J.W., 1981. Appropriate use of regres- sion analysis in marine biology. Mar. Biol., 65: 13-16. Marquardt, D.W., 1963. An algorithm for least-squares esti-
mation of nonlinear parameters. J. Soc. Ind. Appl. Math., 11: 431-441.
Megard, R.O., Tonkyn, D.W. and Senft, W.H., 1984. Kinetics of oxygenic photosynthesis in planktonic algae. J. Plankton Res., 6: 325-337.
Odum, H.T., 1975. An energy circuit language for ecological and social systems: Its physical basis. In: B.C. Patten (Editor), Systems Analysis and Simulation in Ecology, Vol. I1. Academic Press, London, pp. 139-211.
Parsons, T.R., Takahashi, M. and Hargrave, B., 1984. Biologi- cal Oceanographic Processes, 3rd edn. Pergamon Press, Oxford, 330 pp.
Platt, T., Gallegos, C.L. and Harrison, W.G., 1980. Photoinhi- bition of photosynthesis in natural assemblages of marine phytoplankton. J. Mar. Res., 38: 687-701.
Sokal, R.R. and F.J. Rohlf, 1981. Biometry. The Principles and Practice of Statistics in Biological Research. W.H. Freeman and Co., San Francisco, 776 pp.
Steele, J.H., 1962. Environmental control of photosynthesis in the sea. Limnol. Oceanogr., 7: 137-150.
Turpin, D.H., 1991. Minireview. Effects of inorganic N avail- ability on algal photosynthesis and carbon metabolism. J. Phycol., 27: 14-20.
Underwood, A.J., 1981. Techniques of analysis of variance in experimental marine biology and ecology. Oceanogr. Mar. Biol. Ann. Rev., 19: 513-605.