Planning abilities of children aged
4 years and 9 months to 8 ½ years
Effects of age, fluid intelligence and school type
on performance in the Tower of London test
Leandro Fernandes Malloy-Diniz
1, Cláudia Cardoso-Martins
2, Elaine Pacheco Nassif
1,
Angela Maria Levy
1, Wellington Borges Leite
3, Daniel Fuentes
4Abstract – The present study investigated the relationship between age and one type of environmental factor, namely, type of school (i.e., private vs. public), and the development of mental planning ability, as measured by the Tower of London (TOL) test.Methods: Participants comprised 197 public and 174 private school students, ranging in age from 4 years and 9 months to 8 years and 6 months. Besides the TOL test, students were admin-istered Raven’s Colored Matrices. Results: Results confirmed the findings of previous studies that both age and school type are important predictors of mental planning. Furthermore, results also suggest that the relationship between type of school and mental planning ability cannot be accounted for by differences in students’ fluid intelligence. Conclusion: In the present study, the TOL test continued to differentiate public from private school students, even after we controlled for the effect of differences on the Raven test.
Key words: planning, cognition, neuropsychology, private vs. public school, socioeconomic status, child development.
Habilidades de planejamento em crianças com idade entre 4 anos e nove meses e 8 anos e meio: efeitos da idade, inteligência fluida, tipo de escola na performance do teste da Torre de Londres.
Resumo – O presente estudo investigou a relação entre idade, e um tipo de fator ambiental, o tipo de ambiente escolar (público x privado) e o desenvolvimento das habilidades mentais de planejamento medidas pelo teste da Torre de Londres (TOL). Métodos: Os participantes foram 197 estudantes de escolas públicas e 174 de escolas privadas com idade variando de 4 anos e 9 meses a 8 anos e 6 meses. Além do TOL, foi administrado o teste das Matrizes Coloridas de Raven. Resultados: Os resultados confirmam os achados de estudos prévios de que tanto a idade e o tipo de escola são importantes preditores das habilidades de planejamento. Além disso, eles também sugerem que a relação entre o tipo de escola e as habilidades de planejamento não podem ser explicadas por diferenças na inteligência fluída dos estudantes. Conclusão: No presente estudo, o teste da torre de Londres dife-renciou crianças de escolas públicas e privadas mesmo após ter sido controlado o efeito das diferenças medidas pelo teste das Matrizes Coloridas de Raven.
Palavras-chave: planejamento, cognição, neuropsicologia, escola particular vs. escola pública, fatores socioeco-nômicos, desenvolvimento infantil.
1Universidade FUMEC – Grupo de pesquisa em Neuropsicologia e Neurociências. Nova Lima. Belo Horizonte. Brasil. 2Departamento de Psicologia da
Faculdade de Filosofia e Ciências Humanas da Universidade Federal de Minas Gerais. 3GEDAHI – (Grupo de Estudos dos Distúrbios da Aprendizagem,
Atenção e Hiperatividade). 4Unidade de Psicologia e Neuropsicologia do Hospital das Clínicas da USP, São Paulo, Brasil.
Leandro Fernandes Malloy-Diniz – Avenida do Contorno, 3979 / sala 404 - CEP Belo Horizonte MG - Brazil. E-mail: [email protected] Received 01/15/2008. Received in final form 02/16/2008. Accepted 02/23/2008.
Mental planning is defined as a series of activities entailing 1) identification of the steps needed to reach a given goal; 2) analysis of the alternative means of solving the problem or problems at hand; and 3) selection of the approach that seems to be the most advantageous.1 Not
basal ganglia and the cerebellum.2 There is evidence that
impairments in these processes are related to develop-mental disorders such as ADHD, Tourette Syndrome and Autism, and can affect normal performance on tasks that assess planning ability.3
Both age and fluid intelligence (i.e., the ability to rea-son about and solve novel problems)4 have been shown to
be important predictors of performance on tasks measur-ing plannmeasur-ing ability (e.g., Tower of London and Tower of Hanoi).4 As reviewed briefly below, the results of recent
studies suggest that environmental variables also exert a powerful influence on the development of executive func-tions, including mental planning.
Several studies have demonstrated a strong association between socioeconomic status (SES) and cognitive devel-opment.5-7 Recently, Noble et al.6 suggested that the
influ-ence of SES may vary as a function of the neurocognitive system involved. Specifically, they suggested that neuro-cognitive systems that undergo protracted developmental periods may be particularly susceptible to environmental influences. Accordingly, they found that performance on tasks subserved by the frontal cortex and the left perisyl-vian systems, both of which involve prolonged periods of postnatal development, correlated strongly with SES. In contrast, performance on tasks assessing neurocognitive systems with shorter periods of postnatal development, such as the occipitotemporal-visual and the parietal sys-tems was more immune to SES differences.
SES is a complex variable that encompasses a multitude of influences. Noble, Norman and Farah5 have shown that
parental education is the most predictive constituent of SES for the development of executive functions and language skills, suggesting that home variables that are likely to be affected by parental education, such as, for example, the home literacy environment and parent-child styles of
in-teraction, are important influences on the development of mental planning and language skills. Recent research by Ar-dilla et al.7 with Mexican and Colombian children suggests
that the school environment also has an important impact on the development of mental planning. In particular, these researchers have shown that the type of school attended by the child – private vs. public – accounts for variations in tasks measuring executive functions and mental planning, above and beyond differences in parental education. In the present study, we extend the work by Ardilla et al. by in-vestigating whether the influence of the type of school is independent of variations in children’s fluid intelligence.
Methods
Participants
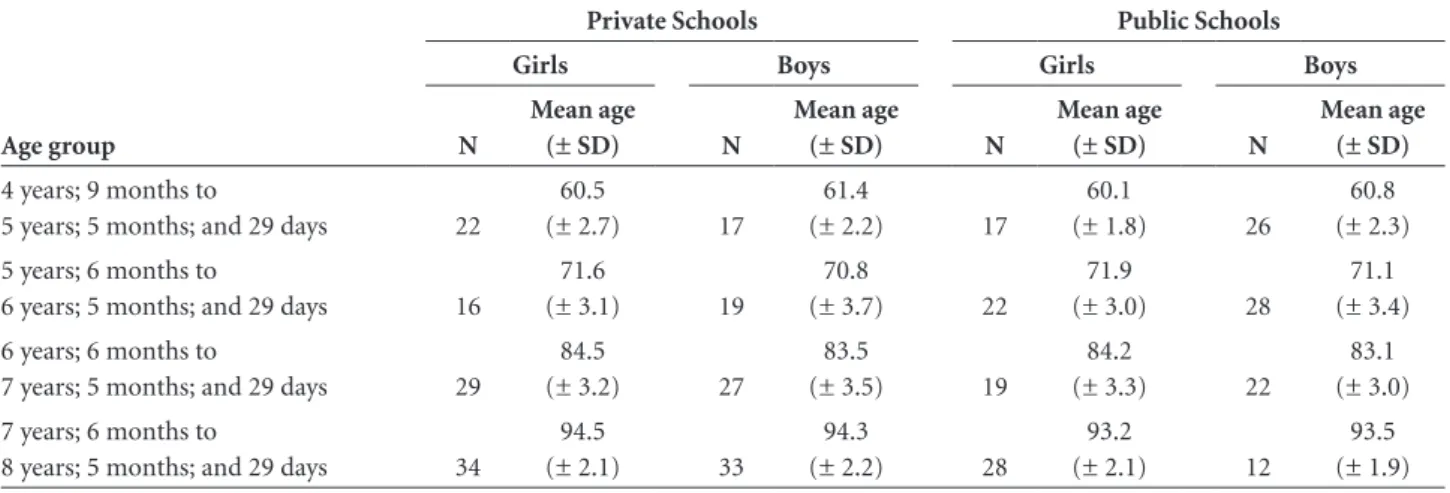
Participants comprised 197 children (101 girls, 96 boys) enrolled in private schools, and 174 (86 girls, 88 boys) en-rolled in public schools in a major Brazilian city. At both schools, children were divided into four age groups: 4 years, 9 months to 5 years, 5 months, 29 days; 5 years, 6 months to 6 years, 5 months, 29 days; 6 years, 6 months to 7 years, 5 months, 29 days; and, finally, 7 years, 6 months to 8 years, 5 months, 29 days (Table 1). At the time of the assessment, 82 participants were enrolled in preschool classes (39 private and 43 public school students), 227 in 1st grade classes (129
private and 108 public school students), and 52 in 2nd grade
classes (29 private and 23 public school students). Children were chosen randomly from schools’ regis-tration records. To participate in the study, children had to present no history of neurological and/or psychological impairments. In addition, only children who were enrolled in age appropriate classes were included in the study.
Instruments
The Tower of London (TOL) task8was used to assess
Table 1. Mean age (in months) and number of girls and boys as functions of age group and type of school.
Age group
Private Schools Public Schools
Girls Boys Girls Boys
N
Mean age
(± SD) N
Mean age
(± SD) N
Mean age
(± SD) N
Mean age (± SD)
4 years; 9 months to
5 years; 5 months; and 29 days 22
60.5
(± 2.7) 17
61.4
(± 2.2) 17
60.1
(± 1.8) 26
60.8 (± 2.3) 5 years; 6 months to
6 years; 5 months; and 29 days 16
71.6
(± 3.1) 19
70.8
(± 3.7) 22
71.9
(± 3.0) 28
71.1 (± 3.4) 6 years; 6 months to
7 years; 5 months; and 29 days 29
84.5
(± 3.2) 27
83.5
(± 3.5) 19
84.2
(± 3.3) 22
83.1 (± 3.0) 7 years; 6 months to
8 years; 5 months; and 29 days 34
94.5
(± 2.1) 33
94.3
(± 2.2) 28
93.2
(± 2.1) 12
mental planning. The Krikorian’s9 task is performed on
a wooden board consisting of three pegs of descending height, on which three balls (one green, one red, and one blue) can be arranged, three on the first peg, two on the second, and one on the third. In each of 12 different prob-lems, the participant is asked to arrange the balls on the test board according to a picture display. The board is always presented with the balls arranged in the same configura-tion, that is, with the green and blue balls placed on the first peg (the green ball under the blue one), and the blue ball on the second peg. The participant is told that only one ball can be moved at a time, and that he or she should try to solve the problem with the fewest ball movements possible. For each problem, the participant gets three points if the problem is solved in the first trial, two points if the prob-lem is solved in the second trial, one point if it is solved in the third and, finally, zero if he or she cannot solve the problem within the three trials. The score corresponds to the total sum of points.
Raven’s Colored Matrices10 (RCM) were used to assess
fluid intelligence. The test consists of three sets of 12 prob-lems each. For each problem, the child is shown an incom-plete design or matrix with six figures printed underneath it. The child’s task consists of pointing to the figure that completes the matrix. For each correct response, the child earns 1 point. The child’s score corresponds to the total number of points (Maximum score=36 points).
The children were tested individually in a quiet loca-tion at their school. The TOL test was always administered before the RCM.
Statistics were calculated with the SPSS 15.0 (Statistical Package for Social Sciences). Student’s t-tests were used to compare public and private school student performance on the TOL and Raven’s measures, while Pearson’s correla-tion was used to calculate the associacorrela-tion between perfor-mance on the TOL test and perforperfor-mance on RCM. Finally, an analysis of variance (ANOVA) was calculated to test the effects of age, type of school, and gender, as well as any interaction between these factors, with scores on the Raven test as covariates. Tukey HSD multiple comparison post-hoc tests were used as appropriate.
This study was approved by the Research Ethics Com-mittee of FUMEC University (REF263/2007), Belo Hori-zonte, MG, Brazil.
Results
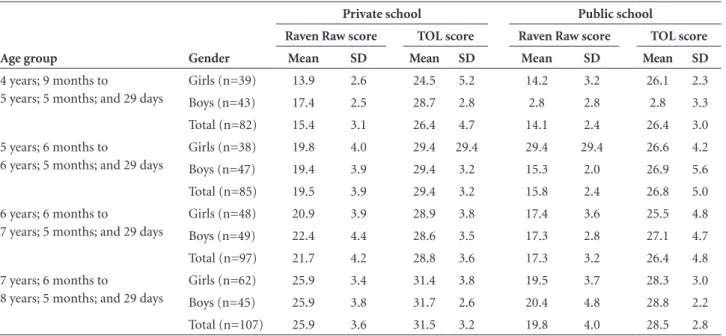
Table 2 lists the results for the TOL and the RCM tests, separately for the private and public schools, and for the four age ranges. As can be seen from this table, scores on both tasks varied across the two types of school. Specifi-cally, private school students performed significantly bet-ter than public school students on both the TOL (t(369)= 5,55, p<.001) and the RCM (t (369)=10,09, p<.001). In addition, performance on RCM correlated significantly with performance on the TOL (r =.42, p<.001). In view of these results, the scores on the TOL were submitted to an ANOVA with gender, age, and type of school as between-subjects factors, using scores on RCM.
There was a trend for gender to be significant (F(1, 354) =3.81, p=052). This resulted from a small difference
fa-Table 2. Mean scores on the TOL and Raven tests as functions of age, gender, and type of school.
Age group Gender
Private school Public school
Raven Raw score TOL score Raven Raw score TOL score Mean SD Mean SD Mean SD Mean SD
4 years; 9 months to
5 years; 5 months; and 29 days
Girls (n=39) 13.9 2.6 24.5 5.2 14.2 3.2 26.1 2.3 Boys (n=43) 17.4 2.5 28.7 2.8 2.8 2.8 2.8 3.3 Total (n=82) 15.4 3.1 26.4 4.7 14.1 2.4 26.4 3.0 5 years; 6 months to
6 years; 5 months; and 29 days
Girls (n=38) 19.8 4.0 29.4 29.4 29.4 29.4 26.6 4.2 Boys (n=47) 19.4 3.9 29.4 3.2 15.3 2.0 26.9 5.6 Total (n=85) 19.5 3.9 29.4 3.2 15.8 2.4 26.8 5.0 6 years; 6 months to
7 years; 5 months; and 29 days
Girls (n=48) 20.9 3.9 28.9 3.8 17.4 3.6 25.5 4.8 Boys (n=49) 22.4 4.4 28.6 3.5 17.3 2.8 27.1 4.7 Total (n=97) 21.7 4.2 28.8 3.6 17.3 3.2 26.4 4.8 7 years; 6 months to
8 years; 5 months; and 29 days
voring boys (Mean=27.92, SD=4.44, for the girls and M= 28.54, SD=4.06, for the boys). Both age and school type had a significant effect on TOL performance (F(3, 354)=4, 31,
p=.005, for age and F(1, 354)=9.18, p=.003, for school type. As can be seen from Table 1, performance on the TOL improved with age and was higher for private school stu-dents than for public school stustu-dents. Tukey HSD multiple comparisons showed that the oldest age group performed significantly better than all other age groups (all ps<.001). There was also a trend for a significant difference between the first and the second age groups. Finally, no significant interactions were found among age and gender, age and school type, gender and school type, or gender, age and school type.
Discussion
The main goal of the present study was to replicate Ar-dilla et al.7 finding that private school students perform
sig-nificantly better than public school students on tasks mea-suring mental planning. In particular, we were interested in investigating if this effect is independent of differences in private and public school students’ fluid intelligence.
In the present study, performance on RCM was signifi-cantly correlated with performance on the TOL, confirm-ing Zook et al.4 finding that fluid intelligence is an
impor-tant correlate of mental planning. Furthermore, the public school students performed significantly more poorly than the private school students on both the TOL and the RCM. Notwithstanding these effects, our results showed that the effect of type of school on TOL performance is not medi-ated by differences in students’ fluid intelligence.
These results extend Ardilla et al.findings, and suggest that characteristics of the school environment may con-tribute to SES differences in neurocognitive development. Several differences between Brazilian private and public schools could account for the results of the present study. For example, there is evidence11 of a difference favoring
private schools as opposed to public schools in terms of both physical and professional resources. A more in-depth assessment of children’s school environments, including teacher-student styles of interaction, is needed to help us disentangle the factors that influence the development of planning ability. Likewise, it will be important to assess differences in students’ motivation and beliefs about intel-ligence,12 and how these variations are related to variations
in students’ planning ability, as well as to school environ-ment variables. Very likely, the results of this research will have important educational implications. Future studies should also explore the effect of possible interactions be-tween type of school attendance and other environmen-tal variables. For example, it is often the case that private
school students begin to attend school at an earlier age than public school students, and it is possible that this factor ac-counts for a substantial portion of the variation observed in TOL performance.
The distribution of the TOL scores was slightly nega-tively skewed, confirming Portela et al.13 suggestion that the
TOL version used in the present study is relatively easy. As a matter of fact, the mean score found for our oldest par-ticipants, i.e., 30.36 (SD=3.40) was almost identical to the mean score found by Souza et al.14 for a group of Brazilian
adults (Mean=31.5; SD=3, for the men and Mean= 28.5; SD=3, for the women). Despite this limitation, our findings confirmed the results of previous studies15 that age is an
im-portant predictor of variations in mental planning ability. Given the close association between age and performance in executive functions tasks,16 this finding is hardly surprising.
In sum, the present results strongly suggest that both biological and environmental influences are involved in the development of such systems. An important question for future research consists of investigating which specific causal factors in the environment are really important, and how they interact with biological influences to determine the growth of the neurological bases of planning ability.
References
1. Malloy-Diniz LF, Fuentes D, Sedó M, Leite WB. Neuropsico-logia das funções executivas. In: Fuentes D, Malloy-Diniz LF, Camargo C, Cosenza R, editores. Neuropsicologia: teoria e Prática, Porto Alegre:Artmed; 2007:187-206.
2. Diamond A. Close interrelation of motor development and cognitive development and of the cerebellum and prefrontal cortex. Child Dev 2000;71:44-56.
3. Pennington BF, Ozonoff S. Executive functions and de-velopmental psychopathology. J Child Psychol Psychiatry 1996;37:51-87.
4. Zook NA, Davalos DB, Delosh EL, Davis HP. Working mem-ory, inhibition, and fluid intelligence as predictors of per-formance on Tower of Hanoi and London tasks. Brain Cogn 2004;56:286-292.
5. Noble KG, Norman MF, Farah MJ. Neurocognitive correlates of socioeconomic status in kindergarten children. Dev Sci 2005;8:74-87.
6. Noble KG, McCandliss BD, Farah MJ Socioeconomic gradi-ents predict individual differences in neurocognitive abilities. Dev Sci 2007;10:464-480.
7. Ardila A, Rosselli M, Matute E, Guajardo S. The influence of the parents’ educational level on the development of executive functions. Dev Neuropsychol 2005;28:539-560.
9. Krikorian R, Bartok J, Gay N. Tower of London procedure: a standard method and developmental data. J Clin Exp Neu-ropsychol 1994;16:840-850.
10. Raven JC, Court JH, Raven J. Manual for Raven’s Progressive Matrices and Vocabulary Scales, Section 2, Coloured Progres-sive Matrices, London: H. K. Lewis & Co., Ltd; 1984. 11. Brazilian Secretary of Education – BRAZIL 2003. Quality
of Education. http://www.inep.gov.br/download/saeb/2003/ boletim_4serie.pdf. Access on november 20th 2006.
12. Dweck CS, Elliott ES. Achievement motivation. In: P. Mussen, EM Hetherington, editores, Handbook of child psychology. New York: Wiley; 1983.
13. Portella MJ, Marcos-Bars T, Rami-Gonzalez L,
Navarro-Odriozola V, Gasto-Ferrer C, Salamero M. Tower of London: mental planning, validity and the ceiling effect. Rev Neurol 2003;37:210-213.
14. Souza R, Ignacio FA, Cunha FC, Oliveira DL, Moll J. Contri-butions to the neuropsychology of executive behavior: per-formance of normal individuals on the Tower of London and Wisconsin tests. Arq Neuropsiquiatr 2001;59:526-531. 15. Romine CB, Reynolds CR. A model of the development of
frontal lobe functioning: findings from a meta-analysis. Appl Neuropsychol 2005;12:190-201.