The evaluation of sequential platelet counts has
prognostic value for acute kidney injury patients
requiring dialysis in the intensive care setting
Carla Valente,I,IIMa´rcio Soares,III Eduardo Rocha,I,II,IVLucio Cardoso,IVElizabeth MaccarielloI,II,V
INepHro Consultoria em Doenc¸as Renais, Rio de Janeiro/RJ, Brazil.IIRede D’Or de Hospitais, Rio de Janeiro/RJ, Brazil.IIIInstituto D’Or de Pesquisa e Ensino
– IDOR, Rio de Janeiro/RJ, Brazil.IVUniversidade Federal do Rio de Janeiro, Faculdade de Medicina, Department of Nephrology, Rio de Janeiro/RJ, Brazil. VUniversidade do Estado do Rio de Janeiro, Hospital Universita´rio Pedro Ernesto, Department of Nephrology, Rio de Janeiro/RJ, Brazil.
OBJECTIVE:To evaluate the prognostic value of platelet counts in acute kidney injury patients requiring renal replacement therapy.
METHODS:This prospective cohort study was performed in three tertiary-care hospitals. Platelet counts were obtained upon admission to the intensive care unit and during the first week of renal replacement therapy on days 1, 3, 5 and 7. The outcome of interest was the hospital mortality rate. With the aim of minimizing individual variation, we analyzed the relative platelet counts on days 3, 5, 7 and at the point of the largest variation during the first week of renal replacement therapy. Logistic regression analysis was used to test the prognostic value of the platelet counts.
RESULTS:The study included 274 patients. The hospital mortality rate was 62%. The survivors had significantly higher platelet counts upon admission to the intensive care unit compared to the non-survivors [175.56103/ mm3 (108.5–259
6103/mm3) vs. 1486103/mm3 (8021416103/mm3)] and during the first week of renal replacement therapy. The relative platelet count reductions were significantly associated with a higher hospital mortality rate compared with the platelet count increases (70%vs. 44% at the nadir, respectively). A
relative platelet count reduction .60% was significantly associated with a worse outcome (mortality rate = 82.6%). Relative platelet count variations and the percentage of reduction were independent risk factors of hospital mortality during the first week of renal replacement therapy.
CONCLUSION: Platelet counts upon admission to the intensive care unit and at the beginning of renal replacement therapy as well as sequential platelet count evaluation have prognostic value in acute kidney injury patients requiring renal replacement therapy.
KEYWORDS: Platelets; Acute Kidney Injury; Mortality; Prognosis; Intensive Care Unit.
Valente C, Soares M, Rocha E, Cardoso L, Maccariello E. The evaluation of sequential platelet counts has prognostic value for acute kidney injury patients requiring dialysis in the intensive care setting. Clinics. 2013;68(6):803-808.
Received for publication onJanuary 29, 2013;First review completed onFebruary 16, 2013;Accepted for publication onFebruary 16, 2013 E-mail: [email protected]
Tel.: 55 21 2249-9131
& INTRODUCTION
Acute kidney injury (AKI) is a frequent complication in patients admitted to the intensive care unit (ICU) and is associated with high mortality rates, particularly when renal replacement therapy (RRT) is required (1). In this setting, the outcomes for AKI patients are mainly related to indivi-dual characteristics, such as older age, the number of organs in failure, the presence of co-morbidities, reduced functional capacity and the severity of their acute illness (1–4).
Recently, low platelet counts (PCs) have been recognized as a prognostic marker in the ICU (5,6). Significantly low initial thrombocytopenia (PC,506103/mm3) has been
shown to predict higher mortality rates in community-acquired pneumonia as well as in surgical and medical ICU patients (7–9). Moreover, sequential PC evaluations have been identified as an independent mortality risk factor (10). In advanced renal failure with uremia, the PC is usually normal or slightly reduced (11). Although 16% to 55% of end-stage renal disease patients may present with throm-bocytopenia, values under 1006103/mm3 are infrequent
without a superimposed cause (12,13). In AKI, however, a low PC has been recognized as a prognostic marker (6,14). Moreover, severe thrombocytopenia at the beginning of RRT has been associated with hospital mortality (14).
PC measurements are simple, low-cost, usually obtained daily and associated with ICU and hospital mortality rates. However, the prognostic value of the PC and an assessment Copyrightß2013CLINICS– This is an Open Access article distributed under
the terms of the Creative Commons Attribution Non-Commercial License (http:// creativecommons.org/licenses/by-nc/3.0/) which permits unrestricted non-commercial use, distribution, and reproduction in any medium, provided the original work is properly cited.
No potential conflict of interest was reported.
of its over-time variations in patients requiring RRT in the ICU have not been completely elucidated. Therefore, the aim of the present study was to evaluate the prognostic value of the PC and its sequential evaluation in AKI patients during the first week of RRT.
& PATIENTS AND METHODS
This prospective cohort study was conducted from January 2007 to December 2009 in nine medical and surgical ICUs at three tertiary-care hospitals in Rio de Janeiro, Brazil. The study was approved by the ethics committees of the participating institutions without the need for informed consent because this was an observational study.
Patients’ characteristics
All of the AKI patients who needed RRT during the first week of ICU admission were included. End-stage renal disease patients on chronic dialysis and patients within ,24 h of admission to the ICU were excluded. AKI was classified according the Risk, Injury, Failure, Loss and End-stage renal disease (RIFLE) criteria immediately before the start of RRT. Decisions to start, change the method of, and stop RRT were made together by the nephrologists and intensivists individually responsible for the patients. The same team of nephrologists managed the patients in all of the participating ICUs. The prescribed RRT modalities were daily conventional dialysis (daily-IHD), prolonged intermit-tent RRT (PIRRT) and continuous RRT (CRRT) according to the patient’s hemodynamic status (R.I.O.S. allocation system) (4). CRRT was employed in patients receiving vasoactive drugs and in patients with the potential for hemodynamic and neurologic instabilities. The RRT procedures were performed using DIAPACT (B. Braun, Melsungen, Germany), and the intermittent procedures were performed using AK200 series (Gambro, Lund, Sweden) machines. Polysulfone (PS, Fresenius, Frankfurt, Germany) mem-branes, customized bicarbonate solutions and a blood flow rate of 200 to 300 ml/min were prescribed in each dialysis procedure. When anticoagulation was needed, low molecu-lar weight (LMW) heparin was prescribed. Demographic, clinical and laboratory data were prospectively collected. The previous comorbidities [Charlson index and chronic health status (Knaus)] (15,16), main diagnosis for ICU admission, pre-morbid renal function, need for mechanical ventilation or vasopressors for more than 24 h, contributing factors for AKI and severity of the acute illness [SAPS II (17) and SOFA (18)] were also recorded.
Platelet Counts Data
PCs were determined daily using a Sysmex XE210D. Thrombocytopenia was considered present when the PC was,1506103/mm3(8). A 10% range variation in PC was
established as acceptable for determining a stable measure-ment. The prospectively collected PC data included the following items: absolute PC on the day of ICU admission (D0) and absolute PC during the first week of RRT on days 1, 3, 5 and 7 (D1, D3, D5 and D7, respectively).
The relative PC variation during the first week of RRT was calculated as follows: relative PC between D1-D3 of RRT = [(PC D3-PC D1/PC D1)]*100; relative PC between D1-D5 of RRT = [(PC D5- PC D1/PC D1)]*100; relative PC between D1-D7 of RRT = [(PC D7-PC D1/PC D1)]*100; relative PC at the point of highest PC variation (nadir or
acme) = [(PC D3-PCD1 or PC D5-PCD1 or PC D7-PC D1)/PC D1]*100, according to an individual’s variation time points.
The measured PCs were stratified as follows (10). The absolute PCs on the first day of RRT were divided into $1506103/mm3, 1002149.96103/mm3, 50299.96103/mm3
and ,506103/mm3. The relative PC variations were
classified as reduced, stable or increased over the D1-D3, D1-D5 and D1-D7 assessment periods. The relative PC reductions during the first week of RRT were divided into $60%, 30% to 59.9%, 10% to 29.9% and,10% over the D1-D3, D1-D5 and D1-D7 assessment periods. The relative PC reductions during the first week of RRT using the PC nadir were divided into$60%, 30% to 59.9%, 10% to 29.9% or #10% over the D1-D3; D1-D5 or D1-D7 assessment periods. The hospital mortality rate was the outcome of interest.
Statistical analysis
A single data manager entered the data into a computer database. Standard descriptive statistics were used to describe the study population. Continuous variables are presented as the mean¡SD or median (25–75% interquartile
range) and were compared using Student’s t-test or the chi-squared test, as appropriate. Logistic regression analysis was used to identify the factors associated with the hospital mortality rate. Variables yielding p-values ,0.25 by the univariate analysis and variables considered clinically important were entered in a forward multivariate logistic regression analysis. The results of both the uni- and multivariate analyses were summarized by estimating the odds ratios (ORs) and their respective 95% confidence intervals (CIs). Possible interactions and collinear relation-ships were tested. Discrimination was evaluated by calcu-lating the area under the receiver operating characteristic curve (AROC) (19). The Hosmer-Lemeshow goodness-of-fit test was used to evaluate the model’s calibration (22). A two-tailedp,0.05 was considered statistically significant.
& RESULTS
Characteristics of the study population
A total of 274 patients who developed AKI requiring RRT during the first week of ICU admission were included in the study. The mean age was 69¡16 years. The main cause of
AKI was sepsis (68%). At the time that dialysis was indicated, the severity of the renal injury was classified using the RIFLE criteria as follows: RIFLE-F = 143 (52.2%); RIFLE-I = 59 (21.5%), and RIFLE-R = 72 (26.3%). The indica-tions for RRT (the same patient could have more than one simultaneously) were as follows: hypervolemia [150 (55%)], metabolic acidosis [168 (61%)], hyperkalemia [24 (9%)], dysnatremias [14 (5%)], azotemia [128 (47%)] and oligoa-nuria [59 (22%)]. CRRT was the most common dialysis modality, and it was prescribed in 220 patients (80.2%) with hemodynamic or neurologic instability or severe metabolic disorders. Anticoagulation was not prescribed for most RRT procedures [244 patients (89%)]. LMW heparin was used in all 30 patients (11%) who received anticoagulation on at least one occasion. The patients’ main demographic and clinical characteristics and the laboratory results are shown in Table 1.
Outcome analysis
were 14 days (range 8–31 days) and 22 days (range 11–44 days), respectively. In the univariate analysis, mechanical ventilation, vasoactive drugs, poor chronic health status (Knaus C and D) and co-morbidities (Charlson.1) were significantly associated with a worse outcome (Table 2).
Platelet Counts Outcome Results
On D0 of the ICU admission, survivors had a significantly higher mean PC than non-survivors [175.56103/mm3
(108.522596103/mm3) vs. 1486103/mm3 (8021416103/
mm3)] (p= 0.03). On D1 of RRT, 8.8% of patients already
had severe thrombocytopenia (PC ,506103/mm3). The
hospital mortality in this group was significantly higher (87.5%, p= 0.014). During the first week of RRT, the
survivors had a significantly higher mean PC than the non-survivors [D1 of RRT = 1786103/mm3(113.522586103/
mm3)
vs. 148.56103/mm3(8322416103/mm3) (p= 0.02); D3
of RRT = 1376103/mm3 (8222116103/mm3) vs. 97.56103/
mm3(52
21786103/mm3) (p= 0.001); D5 of RRT = 1296103/
mm3 (69.5
22186103/mm3) vs. 796103/mm3 (41.32139.56
103/mm3) (p= 0.001); D7 of RRT = 1566103/mm3 (95.92 2386103/mm3) vs. 88.56103/mm3(4621666103/mm3) (p=
0.001)] (Figure 1).
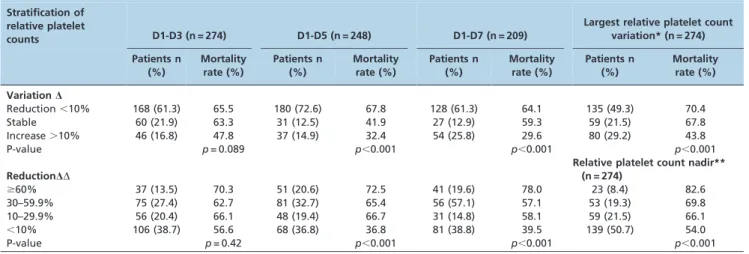
To remove baseline individual PC variations during the first week of RRT, relative PCs and relative PCs using the observed main variation point (nadir or acme) were calculated and analyzed. Reduced or stabilized relative PCs were associated with a higher mortality rate (Table 3). Similarly, a higher percentage of the relative PC reduction during the first week of RRT was associated with a higher hospital mortality rate. A PC reduction .60% was asso-ciated with a worse outcome on D1-D3 (70.3%,p= 0.42),
D1-D5 (72.5%, p,0.001), D1-D7 (78.0%, p,0.001) and at the nadir (82.5%, p,0.001). The results are shown in Table 3.
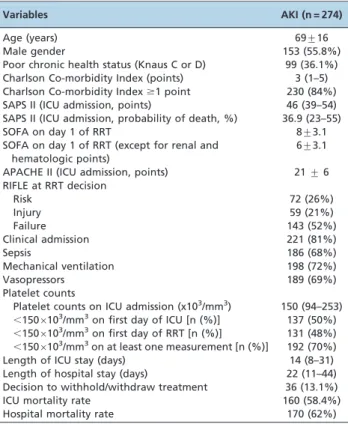
Table 1 -Patient demographics, clinical characteristics and laboratory data (n = 274).a
Variables AKI (n = 274)
Age (years) 69¡16
Male gender 153 (55.8%)
Poor chronic health status (Knaus C or D) 99 (36.1%) Charlson Co-morbidity Index (points) 3 (1–5) Charlson Co-morbidity Index$1 point 230 (84%) SAPS II (ICU admission, points) 46 (39–54) SAPS II (ICU admission, probability of death, %) 36.9 (23–55)
SOFA on day 1 of RRT 8¡3.1
SOFA on day 1 of RRT (except for renal and hematologic points)
6¡3.1
APACHE II (ICU admission, points) 21¡6 RIFLE at RRT decision
Risk 72 (26%)
Injury 59 (21%)
Failure 143 (52%)
Clinical admission 221 (81%)
Sepsis 186 (68%)
Mechanical ventilation 198 (72%)
Vasopressors 189 (69%)
Platelet counts
Platelet counts on ICU admission (x103/mm3) 150 (94–253) ,1506103/mm3on first day of ICU [n (%)] 137 (50%)
,1506103/mm3on first day of RRT [n (%)] 131 (48%)
,1506103/mm3on at least one measurement [n (%)] 192 (70%)
Length of ICU stay (days) 14 (8–31)
Length of hospital stay (days) 22 (11–44) Decision to withhold/withdraw treatment 36 (13.1%)
ICU mortality rate 160 (58.4%)
Hospital mortality rate 170 (62%)
aThe results are expressed as the mean
¡standard deviation or median (interquartile range); n = number of patients (%); RRT = renal replacement therapy; ICU = intensive care unit; RIFLE = Risk, Injury, Failure, Loss and End-Stage Renal Disease acute kidney injury severity score; SOFA = sepsis-related organ failure assessment; SAPS II = Simplified Acute Physiology Score.
Table 2 -Univariate analysis of patient characteristics associated with hospital mortality rate (n = 274).a
Variables Survivors n = 104 (38%) Non-Survivors n = 170 (62%) Odds Ratio (95% CI) p-value
Age (years) 63.4¡17.5 72.8¡14.2 1.04 (1.02–1.06) ,0.001
Male gender 54 (51.9%) 99 (58.3%) 1.2 (0.7–2.1) 0.30
Clinic admission 82 (78.9%) 139 (81.8%) 1.2 (0.6–2.2) 0.50
Sepsis 64 (61.5%) 122 (70.6%) 1.5 (0.9–2.6) 0.70
Mechanical ventilation 68 (65.5%) 130 (76.5%) 1.7 (1.0–2.9) 0.04
Vasoactive drugs 61 (58.7%) 128 (98.5%) 2.1 (1.2–3.6) 0.04
Poor chronic health status (Knaus C and D) 14 (13.5%) 85 (50.0%) 6.4 (3.9–12.7) 0.001
Co-morbidities (Charlson.1) 77 (74.0%) 153 (90.0%) 3.1 (1.6–6.1) 0.001
SAPS II (on first day of RRT) 41.6¡10.7 49.9¡10.6 1.08 (1.05–1.11) ,0.001
SOFA (without renal and hematologic points) 3.8¡3.0 5.4¡3.0 2.6 (1.8–3.7) ,0.001 Dialysis on the first day of ICU admission 82 (78.9%) 113 (66.5%) 0.5 (0.3–0.9) 0.02
aThe results are expressed as the mean¡standard deviation (SD) or median (interquartile range); n = number of patients (%); ICU = intensive care unit; CI = confidence interval; SOFA = Sepsis-related Organ Failure Assessment; SAPS II = Simplified Acute Physiology Score.
Figure 2 shows the Kaplan–Meier survival curve using the percentage of relative PC reduction at the nadir.
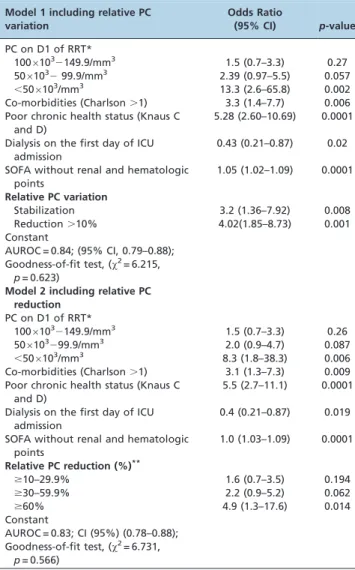
To evaluate the prognostic value of PCs in the study population, two different models were built and entered into the multivariate analysis. To avoid collinearity, each model included a severity of illness score (SOFA) without renal and hematologic points and a platelet variable (either the reduction or stabilization of the relative PC or the percentage of relative PC reduction) (Table 4).
& DISCUSSION
In this prospective study, we demonstrated that throm-bocytopenia was significantly associated with a worse outcome in dialytic AKI in the ICU and that sequential PC
analysis could be used as a prognostic tool in this population.
Thrombocytopenia is one of the most common laboratory findings in the ICU (5,21–22). In the present study, 50% of patients already had PCs below 1506103/mm3 upon ICU
admission. Moreover, 48% of patients had thrombocytope-nia on the first day of RRT, and 70% had at least one PC measurement below 1506103/mm3 during the study.
Nonetheless, a PC,506103/mm3was observed in only 24
patients (8.8%) upon RRT initiation and in 40 patients (14%) throughout the first week of RRT. Our data suggest that, similar to the findings that have been described for the general ICU population, in AKI patients requiring RRT, thrombocytopenia occurs frequently, but severe thrombo-cytopenia is unusual (23,24).
Lower PCs have been associated with higher ICU mortality rates. Brogly et al. (7) reported that a PC of ,506103/mm3on the first day in the ICU in patients with
severe community-acquired pneumonia was an indepen-dent factor for hospital mortality. Similarly, Vandershueren et al. (8) reported that thrombocytopenia occurring during ICU admission was an independent marker of illness severity and was associated with a higher hospital mortality rate. In AKI patients, thrombocytopenia on the first day of RRT has been associated with a worse outcome (14). Similarly, in the present study, severe thrombocytopenia (a PC,506103/m m3) on D1 of RRT was associated with a
significantly higher in-hospital mortality rate compared with the whole study population (87.5%vs. 62%).
In healthy individuals, the consistency and reproduci-bility of PCs are well established (25,26). The normal baseline PC range is 150 to 3506103/mm3 for the general
population, and the amount of variation for a given individual on sequential evaluations is small (approxi-mately 606103/mm3) (23). However, in the ICU setting,
the PC variation over time behaves as a more sensitive variable than the absolute PC to distinguish survivors and non-survivors (27). To minimize the basal individual PC differences, we sequentially analyzed the relative PCs and showed that a reduced relative PC during the first week of RRT was associated with a higher mortality. Nevertheless,
Table 3 -Hospital mortality rate according to platelet count variations and reductions.
Stratification of relative platelet
counts D1-D3 (n = 274) D1-D5 (n = 248) D1-D7 (n = 209)
Largest relative platelet count variation* (n = 274)
Patients n (%)
Mortality rate (%)
Patients n (%)
Mortality rate (%)
Patients n (%)
Mortality rate (%)
Patients n (%)
Mortality rate (%)
VariationD
Reduction,10% 168 (61.3) 65.5 180 (72.6) 67.8 128 (61.3) 64.1 135 (49.3) 70.4
Stable 60 (21.9) 63.3 31 (12.5) 41.9 27 (12.9) 59.3 59 (21.5) 67.8
Increase.10% 46 (16.8) 47.8 37 (14.9) 32.4 54 (25.8) 29.6 80 (29.2) 43.8
P-value p= 0.089 p,0.001 p,0.001 p,0.001
ReductionDD
Relative platelet count nadir** (n = 274)
$60% 37 (13.5) 70.3 51 (20.6) 72.5 41 (19.6) 78.0 23 (8.4) 82.6
30–59.9% 75 (27.4) 62.7 81 (32.7) 65.4 56 (57.1) 57.1 53 (19.3) 69.8
10–29.9% 56 (20.4) 66.1 48 (19.4) 66.7 31 (14.8) 58.1 59 (21.5) 66.1
,10% 106 (38.7) 56.6 68 (36.8) 36.8 81 (38.8) 39.5 139 (50.7) 54.0
P-value p= 0.42 p,0.001 p,0.001 p,0.001
PC = platelet count; RRT = renal replacement therapy; Days (D) 1,3,5,7 of RRT;D= Relative PC variation = PC (D3-D1)/D16100; PC (D5-D1)/D16100; PC
(D7-D1)/D1]6100 (results are shown as reduction.10%, stable and increase.10% compared to D1); * = largest relative PC variation = relative PC (nadir or acme at D1-D3 or D1-D5 or D1-D7);DD= Relative PC reduction = PC (D3-D1)/D16100; PC (D5-D1)/D16100; PC (D7-D1)/D1]6100 (results are shown as
percentages); ** = Nadir = Relative PC reduction at the point of the largest relative PC reduction at D1-D3 or D1-D5 or D1-D7.
this result was only statistically significant after D5 of RRT. Moreau et al. (10) recently described the profile of PCs in ICU patients. The authors noted that the drop in PCs from the normal range occurred during the first three days in the ICU, and the nadir was observed on D3 in the survivors and D4 in the non-survivors. This result may have been a confounding factor in our results. However, when we minimized this possible individual PC variation over time, performing the analysis based on the point of largest PC variation (nadir or acme), the relative PC reduction or stabilization was significantly associated with a higher hospital mortality rate. Similarly, a higher relative PC reduction was associated with a worse outcome, particularly when the reduction was over 60%. Our results corroborate the results observed in the literature for general ICU patients (10).
In the present study, the patients who presented a bimodal PC pattern with an increase in PC after developing thrombocytopenia had a more favorable prognosis. Our data corroborated the reports of Akca et al. (24) and Nijsten et al. (27) who identified the same bimodal PC pattern more frequently in critically ill survivors than in non-survivors.
The sequential evaluation of PCs in the present study, similarly to the findings for ICU patients but different from the results observed for end-stage renal disease patients, indicate that PC variation is an independent predictor of the hospital mortality rate in patients with AKI requiring RRT in the ICU and performs better than many prognostic markers in AKI (7–13,28). However, we would reiterate that no prognostic score should be used for predictions about individual patients, although using a simple and accessible measurement such as PC may help in clinical decision making to improve resource allocation in the ICU and in stratifying AKI patients in need of RRT in clinical trials.
As for the limitations of our analysis, we did not measure PCs in the dialysis circuit nor did we routinely quantify the heparin-induced antibodies. Previous reports have shown that small continuous platelet losses make a cumulative contribution to the thrombocytopenia observed in dialyzed AKI patients in the ICU (29). However, these losses seem to be related to the in vivo use of cuprophane membranes and to the non-albumin content of dialysis solutions when tested in artificial systems (29). Despite the negative correlation between the blood flow rate and platelet loss in CRRT, Docci et al. reported that platelet losses in RRT can be minimized by increasing the blood flow rate and that such losses can be avoided almost entirely when the blood flow rate is maintained .200 ml/min during a dialysis procedure (30,31). In the present study, all of the patients underwent RRT, and PS membranes were prescribed for all of the procedures. In addition, we maintained a 200-ml/min blood flow rate even during CRRT. LMW heparin was prescribed in 11% of cases, and no heparin-induced thrombocytopenia was suspected or confirmed.
In conclusion, the PCs upon ICU admission and at the beginning of RRT as well as its sequential evaluation during the first week of RRT have prognostic value in AKI patients requiring RRT.
& ACKNOWLEDGMENTS
In addition to institutional funds, Dr. Soares received an individual research grant from CNPq.
& AUTHOR CONTRIBUTIONS
Valente C collected the data and prepared the manuscript. Soares M and Cardoso L performed the statistical analysis and revised the manuscript. Rocha E revised the manuscript. Maccariello E performed the data analysis and wrote the manuscript.
& REFERENCES
1. Metnitz PG, Kreen CG, Steltzer H, Lang T, Ploder J, Lenz K, et al. Effect of acute renal failure requiring renal replacement therapy on outcome in critically ill patients. Crit Care Med. 2002;30(9):2051-8, http://dx.doi. org/10.1097/00003246-200209000-00016.
2. Bagshaw SM, Laupland KB, Doig CJ, Mortis G, Fick GH, Mucenski M, et al. Prognosis for long-term survival and renal recovery in critically ill patients with severe acute renal failure: a population-based study. Crit Care. 2005;9(6):R700-9, http://dx.doi.org/10.1186/cc3879.
Table 4 -Multivariate models of the predictive factors for hospital mortality in acute kidney injury patients requiring renal replacement therapy (n = 274).
Model 1 including relative PC variation
Odds Ratio
(95% CI) p-value
PC on D1 of RRT*
10061032149.9/mm3 1.5 (0.7–3.3) 0.27 506103299.9/mm3 2.39 (0.97–5.5) 0.057 ,506103/mm3 13.3 (2.6–65.8) 0.002
Co-morbidities (Charlson.1) 3.3 (1.4–7.7) 0.006 Poor chronic health status (Knaus C
and D)
5.28 (2.60–10.69) 0.0001
Dialysis on the first day of ICU admission
0.43 (0.21–0.87) 0.02
SOFA without renal and hematologic points
1.05 (1.02–1.09) 0.0001
Relative PC variation
Stabilization 3.2 (1.36–7.92) 0.008
Reduction.10% 4.02(1.85–8.73) 0.001
Constant
AUROC = 0.84; (95% CI, 0.79–0.88); Goodness-of-fit test, (x2= 6.215,
p= 0.623)
Model 2 including relative PC reduction
PC on D1 of RRT*
10061032149.9/mm3 1.5 (0.7–3.3) 0.26 506103299.9/mm3 2.0 (0.9–4.7) 0.087
,506103/mm3 8.3 (1.8–38.3) 0.006
Co-morbidities (Charlson.1) 3.1 (1.3–7.3) 0.009 Poor chronic health status (Knaus C
and D)
5.5 (2.7–11.1) 0.0001
Dialysis on the first day of ICU admission
0.4 (0.21–0.87) 0.019
SOFA without renal and hematologic points
1.0 (1.03–1.09) 0.0001
Relative PC reduction (%)**
$10–29.9% 1.6 (0.7–3.5) 0.194
$30–59.9% 2.2 (0.9–5.2) 0.062
$60% 4.9 (1.3–17.6) 0.014
Constant
AUROC = 0.83; CI (95%) (0.78–0.88); Goodness-of-fit test, (x2= 6.731,
p= 0.566)
AKI = acute kidney injury; RRT = renal replacement therapy; ICU = intensive care unit; PC = platelet count; OR = odds ratio; CI = confidence interval; AROC = area under the receiver operating characteristic curve;*PC on D1 of RRT = platelet count on the first day of renal replacement therapy, **Relative PC reduction at the point of the largest variation = [(PC at
3. de Mendonca A, Vicent JL, Suter PM, Moreno R, Dearden NM, Antonelli M, et al. Acute renal failure in the ICU: risk factors and outcome evaluated by the SOFA score. Intensive Care Med. 2000;26(7):915-21. 4. Maccariello E, Soares M,Valente C, Nogueira l, Valenc¸a RV, Machado JE,
et al. RIFLE classification in patients with acute kidney injury in need of renal replacement therapy. Intensive Care Med. 2007;33(4):597-605, http://dx.doi.org/10.1007/s00134-007-0535-0.
5. Strauss R, Wehler M, Mehler K, Kreutzer D, Koebnick C, Hahn EG. Thrombocytopenia in patients in the medical intensive care unit: bleeding prevalence, transfusion requirements, and outcome. Crit Care Med. 2002;30(8):1765-71, http://dx.doi.org/10.1097/00003246-200208000-00015.
6. Samimagham HR, Kheirkhah S, Haghighi A, Najmi Z. Acute kidney injury in intensive care unit: incidence, risk factors and mortality rate. Saudi J Kidney Dis Transpl. 2011;22(3):464-70.
7. Brogly N, Devos P, Boussekey N, Georges H, Chiche A, Leroy O. Impact of thrombocytopenia on outcome of patients admitted to ICU for severe community-acquired pneumonia. J Infect. 2007;55(2):136-40.
8. Vanderschueren S, De Weerdt A, Malbrain M, Vankersschaever D, Frans E, Wilmer A, et al. Thrombocytopenia and prognosis in intensive care. Crit Care Med. 2000;28(6):1871-6, http://dx.doi.org/10.1097/00003246-200006000-00031.
9. Vandijck DM, Blot SI, De Waele JJ, Hoste EA, Vandewoude KH, Decruyenaere JM. Thrombocytopenia and outcome in critically ill patients with bloodstream infection. Heart Lung. 2010;39(1):21-6. 10. Moreau D, Timsit JF, Vesin A, Garrouste-Orgeas M, de Lassence A,
Zahar JR, et al. Platelets count decline: an early prognostic marker in critically ill patients with prolonged ICU stays. Chest. 2007;131(6):1735-41, http://dx.doi.org/10.1378/chest.06-2233.
11. Eknoyan G, Wacksman SJ, Glueck HI, Will JJ. Platelet function in renal failure. N Engl J Med. 1969;280(13):677-81.
12. Boccardo P, Remuzzi G, Galbusera M. Platelet dysfunction in renal failure. Semin Thromb Hemost. 2004;30(5):579-89, http://dx.doi.org/10. 1055/s-2004-835678.
13. Remuzzi G, Pusineri F. Coagulation defects in uremia. Kidney Int. 1988;Suppl 24:S13-7.
14. Chertow GM, Christiansen CL, Cleary PD, Munro C, Lazarus JM. Prognostic stratification in critically ill patients with acute renal failure requiring dialysis. Arch Intern Med. 1995;155(14):1505-11, http://dx.doi. org/10.1001/archinte.1995.00430140075007.
15. Knaus WA, Zimmerman JE, Wagner DP, Draper EA, Lawrence DE. APACHE-acute physiology and chronic health evaluation: a physiolo-gically based classification system. Crit Care Med. 1981;9(8):591-7, http://dx.doi.org/10.1097/00003246-198108000-00008.
16. Charlson ME, Pompei P, Ales KL,Mackenzie CR. A new method of classifying prognostic comorbidity in longitudinal studies: development and validation. J Chronic Dis. 1987;40(5):373-83, http://dx.doi.org/10. 1016/0021-9681(87)90171-8.
17. Le Gall JR, Lemeshow S and Saulnier F. A new Simplified Acute Physiology Score (SAPS II) based on a European/North American multicenter study. JAMA. 1993;270(24):2957-63.
18. Vincent JL, Moreno R, Takala J, Willatts S, De Mendonc¸a A, Bruining H, et al. The SOFA (Sepsis-related Organ Failure Assessment) score to describe organ dysfunction/failure. On behalf of the Working Group on Sepsis-Related Problems of the European Society of Intensive Care Medicine. Intensive Care Med. 1996;22(7):707-10.
19. Hanley JA, McNeil BJ. The meaning and use of the area under a receiver operating characteristic (ROC) curve. Radiology. 1982;143(1):29-36. 20. Hosmer DW, Hosmer T, Le Cessie S, Lemeshow S. A comparison of
goodness-of-fit test for the logistic regression model. Stat Med. 1997;16(9):965-80, http://dx.doi.org/10.1002/(SICI)1097-0258(19970515) 16:9,965::AID-SIM509.3.0.CO;2-O.
21. Baughman RP, Lower EE, Flessa HC, Tollerud DJ. Thrombocytopenia in the intensive care unit. Chest. 1993;104(4):1243-7, http://dx.doi.org/10. 1378/chest.104.4.1243.
22. Hui P, Cook DJ, Lim W, Fraser GA, Arnold DM. The frequency and clinical significance of thrombocytopenia complicating critical illness: a systematic review. Chest. 2011;139(2):271-8, http://dx.doi.org/10.1378/ chest.10-2243.
23. Hanes SD, Quarles DA, Boucher BA. Incidence and risk factors of thrombocytopenia in critically ill trauma patients. Ann Pharmacother. 1997;31(3):285-9.
24. Akca S, Haji-Michael P, de Mendonc¸a A, Suter P, Levi M, Vicent JL. Time course of platelets counts in critically ill patients. Crit Care Med. 2002;30(4):753-6, http://dx.doi.org/10.1097/00003246-200204000-00005. 25. Brecher GM, Schneiderman M, Cronkite EP. The reproducibility and
constancy of the platelets count. Am J Clin Pathol. 1953;23(1);15-26. 26. Ross DW, Ayscue LH, Watson J, Bentley SA. Stability of hematologic
parameters in healthy subjects. Intraindividual versus interindividual variation. Am J Clin Pathol. 1988;90(3):262-7.
27. Nijsten MW, Ten Duis HJ, Zijlstra JG, Porte RJ, Zwaveling JH, Paling JC, et al. Blunted rise in platelets count in critically ill patients is associated with worse outcome. Crit Care Med. 2000;28(12):3843-6, http://dx.doi. org/10.1097/00003246-200012000-00017.
28. Lima EQ, Zanetta DM, Castro I and Yu L. Mortality risk factors and validation of severity scoring systems in critically ill patients with acute renal failure. Ren Fail. 2005;27(5):547-56, http://dx.doi.org/10.1080/ 08860220500198771.
29. Remuzzi A, Boccardo P, Benigni A. In vitro platelet adhesion to dialysis membranes. Nephrol Dial Transplant. 1991;6 Suppl 2:36-9.
30. Mulder J, Tan HK, Bellomo R, Silvester W. Platelet loss across the hemofilter during continuous hemofiltration. Int J Artif Organs. 2003;26(10):906-12.