Treatment of a sanitary landfill leachate using combined solar
photo-Fenton and biological immobilized biomass reactor at
a pilot scale
Vı´tor J.P. Vilar
a,*, Elisangela M.R. Rocha
b, Francisco S. Mota
b, Ame´lia Fonseca
c,
Isabel Saraiva
c, Rui A.R. Boaventura
aaLSRE
eLaboratory of Separation and Reaction Engineering, Departamento de Engenharia Quı´mica, Faculdade de Engenharia da
Universidade do Porto, Rua Dr. Roberto Frias, 4200-465 Porto, Portugal
bUniversidade Federal do Ceara´, Campus do Pici, Centro de Tecnologia, Departamento de Engenharia Hidra´ulica e Ambiental, Laborato´rio de
Saneamento (LABOSAN), Avenida da Universidade, 2853eBenfica, 60020-181 Fortaleza, Brazil
cEfacec Ambiente, SA, Rua Eng. Frederico Ulrich
eGuardeiras, Apartado 3003, 4471-907 Moreira da Maia, Portugal
a r t i c l e
i n f o
Article history:
Received 20 December 2010 Received in revised form 7 February 2011
Accepted 14 February 2011 Available online 22 February 2011
Keywords:
Sanitary landfill Leachate Solar-driven photo-Fenton Anoxic and aerobic biological treatment
Pilot plant
a b s t r a c t
A solar photo-Fenton process combined with a biological nitrification and denitrification system is proposed for the decontamination of a landfill leachate in a pilot plant using
photocatalytic (4.16 m2of Compound Parabolic Collectors
eCPCs) and biological systems
(immobilized biomass reactor). The optimum iron concentration for the photo-Fenton
reaction of the leachate is 60 mg Fe2þL 1. The organic carbon degradation follows a
first-order reaction kinetics (k¼0.020 L kJUV 1,r0¼12.5 mg kJUV 1) with a H2O2consumption
rate of 3.0 mmol H2O2kJUV 1. Complete removal of ammonium, nitrates and nitrites of the
photo-pre-treated leachate was achieved by biological denitrification and nitrification, after previous neutralization/sedimentation of iron sludge (40 mL of iron sludge per liter of photo-treated leachate after 3 h of sedimentation). The optimum C/N ratio obtained for the
denitrification reaction was 2.8 mg CH3OH per mg NeNO3 , consuming 7.9 g/8.2 mL of
commercial methanol per liter of leachate. The maximum nitrification rate obtained was
68 mg NeNH4þper day, consuming 33 mmol (1.3 g) of NaOH per liter during nitrification
and 27.5 mmol of H2SO4per liter during denitrification. The optimal phototreatment energy
estimated to reach a biodegradable effluent, considering ZahneWellens, respirometry and
biological oxidation tests, at pilot plant scale, is 29.2 kJUV L 1(3.3 h of photo-Fenton at
a constant solar UV power of 30 W m 2), consuming 90 mM of H
2O2when used in excess,
which means almost 57% mineralization of the leachate, 57% reduction of polyphenols concentration and 86% reduction of aromatic content.
ª2011 Elsevier Ltd. All rights reserved.
1.
Introduction
The overall aim of the Landfill Directive (Council Directive, 1999/31/ECof 26 April 1999) on the landfill of MSW (Municipal
Sludge Wastes) is “to prevent or reduce as far as possible negative effects on the environment, in particular the pollution of surface water, groundwater, soil and air, and on the global environment, including the greenhouse effect, as well as any
*Corresponding author. Tel.:þ351 918257824; fax:þ351 225081674.
E-mail address:[email protected](V.J.P. Vilar).
A v a i l a b l e a t w w w . s c i e n c e d i r e c t . c o m
j o u r n a l h o m e p a g e : w w w . e l s e v i e r . c o m / l o c a t e / w a t r e s
0043-1354/$esee front matterª2011 Elsevier Ltd. All rights reserved.
resulting risk to human health, from the landfilling of waste,
during the whole life-cycle of the landfill” (1999/31/EC, 1999).
Leachate production is inevitable due to rainwater percolation through the landfill and wastes decomposition, so a leachate treatment plant is required in a sanitary landfill. The high
variability of leachate composition and quantity (Tatsi and
Zouboulis, 2002; Kulikowska and Klimiuk, 2008), reinforced by the presence of high recalcitrant substances, such as humic
and fulvic acids (Kang et al., 2002), xenobiotics and pesticides
(Baun et al., 2004), heavy metals and inorganic
macro-constituents (Ca2þ, Mg2þ, Kþ, Naþ, NH
4þ, Cl , HCO3 , SO42 ,
etc.) (Christensen et al., 2001; O¨man and Junestedt, 2008),
depending on the age of the landfill, climatic conditions, soil
properties, waste type and composition (Christensen et al.,
2001), is nowadays recognized as one of the greatest
environ-mental problems in terms of water pollution.
Normally, old landfill leachates (>10 years), present a low
BOD5/COD ratio (<0.1), indicating low biodegradability due to
the release of high molecular weight recalcitrant organic
molecules and high concentration of NH3eN, which makes
difficult being treated by conventional biological processes (Chian and DeWalle, 1976; Calace et al., 2001; Renou et al.,
2008). The main source of ammoniacal nitrogen in leachate
results from the slow anaerobic hydrolysis of proteins present in the solid wastes, resulting in a slow release of ammonia, which can reach high concentrations in stabilized landfill
leachates (Jokela and Rintala, 2003). Normally, for
concentra-tions higher than 100 mg L 1(Burton and Watson-Craik, 1998),
untreated NH3eN is highly toxic to aquatic organisms, as
confirmed by toxicity tests usingBrachydanio rerio(Silva et al.,
2004),Daphnia magna(Assmuth and Penttila¨, 1995) andVibrio fischeriluminescent bacteria (Nohava et al., 1995).
Due to its ability to enhance the biodegradability of recal-citrant compounds in the leachate, advanced oxidation processes (AOPs), using the combination of strong oxidants,
e.g. O3, H2O2, irradiation, e.g. ultraviolet (UV) (Kurniawan et al.,
2006), ultrasound (US) (Gonze et al., 2003) or electron beam (EB)
(Deng and Englehardt, 2007), and catalysts, e.g. Fe2þ(Primo et al., 2008) and photocatalysts, e.g. TiO2(Weichgrebe et al.,
1993), to produce hydroxyl radicals, have been considered as
one of the most promising options for leachate treatment, which can be improved through the use of renewable solar energy, as UV/Vis photon source.
It has been demonstrated that the photo-Fenton reaction is
more efficient for the treatment of the leachates (Rocha et al.,
2011) than TiO2, since the reaction rate is much higher and
very low iron concentrations is enough for promoting leachate treatment. The advantage of the photo-Fenton process is the higher light sensitivity up to 580 nm, corresponding to 35% of
solar radiation spectrum, when compared withz5% for TiO2
photocatalysis.
Biological nitrogen removal requires a two-step process:
aerobic nitrification of ammonia to nitrite (Eq. 1) and then
nitrite is converted to nitrate (Eq.2); anoxic denitrification of
nitrate to nitrogen gas (Eq.3).
NHþ
4þ
3
2O2/NO2 þH2Oþ2Hþðammonia oxidizing bacteriaÞ
(1)
NO2þ1
2O2/NO3 ðnitrite oxidizing bacteriaÞ (2)
NO3/NO2/NO/N2O/N2 (3)
Denitrification occurs in the absence of oxygen, where nitrate or nitrite is the electron acceptor and requires a carbon source as electron donor. Normally, methanol is used as
substrate when an external carbon source is necessary (Eqs.4
and 5), however acetic acid, methane and others can be used (Randall et al., 1992).
6NO3 þ5CH3OHþCO2/3N2þ6HCO3
þ7H2Oðnitrate removal processÞ (4)
6NO2 þ3CH3OHþCO2/3N2þ6HCO3
þ3H2Oðnitrite removal processÞ (5)
Complete nitrification requires 2 mol of oxygen per mol of
ammonia to be nitrified (Eqs.1 and 2). If denitrification is to be
considered after a nitrification process, partial nitrification to nitrite implies 25% less oxygen demand compared to complete nitrification, and this shortcut of the nitrate would mean a reduction in the total carbon source required for denitrifi-cation because carbon is needed for conversion of nitrate to nitrite, which can yield up to 40% savings in methanol
consumption (Eqs.4 and 5). Approximately 7.14 mg of
alka-linity (as CaCO3) are consumed per mg NeNH4oxidized and
3.57 mg (as CaCO3) of alkalinity production per mg of NeNO3
reduced, meaning that for nitrogen biological elimination in
a nitrificationedenitrification cycle, 3.57 mg of alkalinity (as
CaCO3) is consumed.
Temperature, pH and dissolved oxygen are the main parameters that control the nitrification and denitrification
processes efficiency (Randall et al., 1992). Alleman (1984)
showed that the optimal pH values are between 7.9 and 8.2 for nitrification and between 7.2 and 7.6 for denitrification. Ruiz et al. (2003)studied the nitrification of synthetic
waste-water with high ammonia concentration (10 g NeNH4þL 1) at
a temperature of 30C and concluded that for pH values lower
than 6.45 and higher than 8.95 complete inhibition of nitrifi-cation takes place. Setting a DO concentration in the reactor at
0.7 mg L 1, it was possible to accumulate more than 65% of the
loaded ammonia nitrogen as nitrite with a 98% ammonia conversion, representing a reduction of 20% in the oxygen
consumption. Below 0.5 mg L 1of DO, ammonia was
accu-mulated and over a DO of 1.7 mg L 1complete nitrification to
nitrate was achieved.
Different methanol demands, as external carbon source, for denitrification process of landfill leachates have been
reported: 2.43 g CH3OH/g NeNO3 (3.6 g COD/g NeNO3)
(Kulikowska and Klimiuk, 2004), 2.8e3.0 g CH3OH/g NeNO3
(4.5e4.1 g COD/g NeNO3) (Christensson et al., 1994), which are
more than 2 times higher than the stoichiometric mass ratio
between consumed methanol-C and nitrate-N (C/N¼ 0.46).
Modin et al. (2007)studied the denitrification using methane
as external carbon source, showing a C/N ratio of 7.1 g CeCH4/
g NeNO3, approximately seven times higher than the
8NO3þ5CH4/4N2þ8HO þ6H2Oþ5CO2 (6)
The objective of this study is to evaluate the possibility of combining a solar photo-Fenton process, as pre-oxidation step, to enhance the biodegradability of a landfill leachate, with a biological oxidation treatment (nitrification and deni-trification) for nitrogen and residual DOC removal.
2.
Experimental methodology
2.1. Sanitary landfill leachate samples
Leachate samples were collected at MSW sanitary landfill
nearby Porto.Table 1presents the main chemicalephysical
characteristics of the leachate used in this work.
2.2. Solar CPC pilot plant
The photo-Fenton experiments were carried out under sun-light in 100-L pilot plant installed at the roof of the Chemical Department, Faculty of Engineering, University of Porto (FEUP), Portugal. The pilot plant consists of a photocatalytic system,
constituted by compound parabolic collectors (CPCs) (4.16 m2),
mounted on a fixed platform tilted 41 (local latitude), two
polypropylene storage conic tanks (50 and 100 L), two
recircu-lation pumps (20 L min 1) (ARGAL model TMB), two flowmeters
(Stu¨be, model DFM 165-350), polypropylene valves (FIP) and connecting tubing, being operated in batch mode. The pilot plant has also a sedimentation tank and a biological reactor system, consisting in a conditioner tank and an immobilized biomass reactor. The solar collectors are made-up of four CPC
units (1.04 m2) with 5 borosilicate tubes each (Schott-Duran
type 3.3, Germany, cut-off at 280 nm, internal diameter 46.4 mm, length 1500 mm and thickness 1.8 mm) connected by polypropylene junctions. The pilot plant can be operated in two
ways: using the total CPCs area (4.16 m2) or using 2.08 m2of
CPCs area individually, giving the possibility of performing two different experiments at the same time and at the same solar radiation conditions.
The intensity of solar UV radiation is measured by a global UV radiometer (ACADUS 85-PLS) mounted on the pilot plant at
the same angle, which provides data in terms of incident WUV
m 2. Eq.(7)allows to obtain the amount of accumulated UV
energy (QUV,n kJ L 1) received on any surface in the same
position with regard to the sun, per unit of volume of water
inside the reactor, in the time intervalDt:
QUV;n¼QUV;n 1þDtnUVG;nAr
Vt
; Dtn¼tn tn 1 (7)
wheretnis the time corresponding ton-water sample,Vttotal
reactor volume, Ar illuminated collector surface area and
UVG;naverage solar ultraviolet radiation measured during the
periodDtn. All experiments were done from April to December
2009 during cloudy and sunny days.
2.3. Biological oxidation system
The biological oxidation system is composed by a neutraliza-tion/sedimentation conic-bottom tank (75 L), a conditioner flat-bottom tank (50 L) and an immobilized biomass reactor (IBR) (50 L). The neutralization/sedimentation tank is equip-ped with a pH meter (CRISON) and a mechanical stirrer (TIMSA). The conditioner tank is equipped with a pH control unit (CRISON, electrode and PH27P controller) for pH
adjust-ment using either H2SO4or NaOH dosed by means of two
metering pumps (DOSAPRO MILTON ROY, GTM series, model A) and a mechanical stirrer (TIMSA). The IBR is a flat-bottom
container packed with 25e30 L of propylene rings (nominal
diameter 50 mm), colonized by activated sludge from a municipal wastewater treatment plant (Freixo WWTP). The bioreactor is also equipped with a dissolved oxygen control unit (CRISON, electrode and OXI49P controller) and air is supplied by a blower (compressor-HAILEA model V-20; ceramic air diffuser) for maintaining the oxygen in the system in the selected range.
2.4. Analytical determinations
Evaluation of H2O2 concentration during experiments was
performed by the metavanadate method, based on the
reac-tion of H2O2 with ammonium metavanadate in acidic
medium, which results in the formation of a redeorange color
peroxovanadium cation, with maximum absorbance at Table 1eLandfill leachate characterization.
Parameters Values
pH 7.6
T (C) 21.5
Redox Potential (mV) 98
Conductivity (mS cm 1) 20.7
Volatile Suspended Solids (mg L 1) 235
Total Suspended Solids (mg L1) 337
COD (mg O2L 1) 4505
BOD5(mg O2L 1) 300
BOD5/COD 0.07
Total Dissolved Carbon (mg C L 1) 1158
Inorganic Carbon (mg C L 1) 60
DOC (mg C L 1) 1098
Polyphenols (mg caffeic acid L1) 93.0
Dissolved Iron (mg (Fe2þ þFe3þ
) L 1) 8.5
Absorbance at 254 nm (diluted 1:25) 1.07 Nitrite (mg NeNO2 L 1) 469
Nitrate (mg NeNO3 L 1) 85.9
Ammoniacal nitrogen (mg NeNH4þL 1) 167
Total Nitrogen (mg N L1) 1780
Phosphates (mg PO43 L 1) 3.2
Total Phosphorous (mg P L 1) 10.8
Sulfate (mg SO42 L1) 374
Chloride (mg Cl L 1) 3823
Sodium (g NaþL 1) 2.6
Potassium (g KþL 1) 2.8
Copper (mg Cu2þL 1) 0.1
Total chromium (mg Cr L 1) 2.2
Manganese (mg Mn2þL 1) 0.9
Arsenic (mg As L 1) 95.6
Lead (mg Pb2þL 1) 36.4
Zinc (mg Zn2þL 1) 1.2
Cadmium (mg Cd2þL 1) 0.4
Nickel (mg Ni2þ
450 nm (Nogueira et al., 2005). Iron concentration was deter-mined by colorimetry with 1,10-phenantroline according to ISO 6332.
The total polyphenols concentration was measured by spe-ctrophotometry at 765 nm using the reagent Folin-Ciocalteau
(Merck) (Folin and Ciocalteau, 1927). The polyphenols content is
expressed as mg L 1of caffeic acid.
Sulfate, chloride, nitrate and nitrite were measured by ion chromatography (Dionex DX-120), using a Dionex Ionpac AS9-HC
4 mm250 mm column. The programme for anions
determi-nation comprises a 20 min run using 9 mM Na2CO3as eluent, at
a flow rate of 1.0 mL min 1. Ammonium, phosphates, total
phosphorous, total nitrogen and COD were determined by
Merck
Spectroquant kits.
The quantification of total suspended solids and volatile suspended solids was carried out according to the Standard
methods (Clesceri et al., 2005).
Dissolved organic carbon (DOC) was measured in
a TCeTOCeTN analyzer (Shimadzu, model TOC-VCSN)
provided with an NDIR detector. UVeVis spectrum between
200 and 700 nm, absorbance at 450 nm (vanadate method), 510 nm (phenantroline method), 765 nm (Folin-Ciocalteau method) and 254 nm (aromatic content) were obtained using
a UNICAM Heliosaspectrophotometer. All samples were
pre-filtrated through 0.2mm Nylon VWR membrane filters before
analysis. pH, temperature, conductivity and ORP were measured using a pH meter HANNA HI 4522. Metal ions
concentrations (Kþ, Naþ, Cu2þ, total Cr, Mn2þ, total As, Pb2þ,
Zn2þ, Cd2þand Ni2þ) were obtained, after a previous digestion
of the leachate according to Standard Methods (Clesceri et al.,
2005), by atomic absorption spectrometry (GBC 932 Plus
Atomic Absorption Spectrometer and GBC GF 3000 graphite furnace system).
2.5. Biodegradability assays
Before biological tests and other analysis involving chemical
oxidation, excess H2O2present in samples was removed using
a small volume of 0.1 g L 1solution of catalase (2500 U mg 1
bovine liver) after adjusting the sample pH to 6.5e7.5.
Biochemical oxygen demand (BOD5) was determined
according to OECD-301F test using an OxiTop (manometric
respirometry), described in Standard Methods (Clesceri et al.,
2005). Respirometric tests were performed using a YSI Model
5300 Biological oxygen monitor and a YSI Model 5301B ther-mostatic bath, allowing to measure the oxygen uptake rate (OUR) by the active sludge in the presence of the partially photo-treated samples. The respirometer cell was loaded with 5 mL of the sample saturated with air, and continuously magnetically stirred. 1 mL of activated sludge suspension from a WWTP of Porto (Portugal) was added to the sample, and the oxygen consumption (OUR) measured during 30 min.
A 28 days biodegradability ZahneWellens test was
per-formed according to the EC protocol, Directive 88/303/EEC (EPA, 1996). 250 mL of the pre-treated samples at different photo-Fenton times, without hydrogen peroxide, were added to an open glass vessel, magnetically stirred and kept in the
dark at 25C. Activated sludge from a WWTP in Porto,
previ-ously centrifuged, and mineral nutrients (KH2PO4, K2HPO4,
Na2HPO4, NH4Cl, CaCl2, MgSO4and FeCl3) were added to the
samples. The control and blank experiments were prepared using glucose as carbon source, which is highly biodegradable, and distilled water, respectively, and was also added the mineral nutrients and activated sludge. The percentage
of biodegradation (Dt) was determinate by the following
equation:
Dt¼
1 Ct CB
CA CBA
100 (8)
whereCAandCBAare the DOC (mg L 1) in the sample and in
the blank, measured 3 h after starting the experiment,Ctand
CB are the DOC (mg L 1) in the sample and in the blank,
measured at the sampling time t. The photo-Fenton
pre-treated samples are considered biodegradable when Dt is
higher than 70% (EMPA, 1992).
2.6. Experimental procedure
A volume of 50 or 105 L of sanitary landfill leachate was added
to the recirculation tank of the CPC units (2.08 or 4.16 m2) and
homogenized by turbulent recirculation during 15 min in darkness (a first control sample was taken to characterize the
wastewater). pH was adjusted with H2SO4 (Pancreac, 98%
purity) to 2.6e2.9 (2 mL H2SO4L 1) to avoid iron hydroxide
precipitation and another sample was taken after 15 min to
confirm the pH. Afterward, iron salt (60 mg Fe2þL 1) was also
added (FeSO4.7H2O, Panreac) and well homogenized for
15 min and a third sample was taken for iron concentration control. Finally, the first dose of hydrogen peroxide (30% w/v, Panreac) was added, the CPCs were uncovered and samples were taken at pre-defined times to evaluate the degradation process. In the kinetic study, the hydrogen peroxide concen-tration was maintained in excess, between 200 and
500 mg L 1, by supplementing small amounts of H
2O2 as
consumed. For the biodegradability tests, a new photo-Fenton experiment was performed maintaining all the parameters,
with the exception of H2O2dose. In this case, a small amount
of H2O2was added to the photoreactor, and after H2O2total
consumption, a sample was taken for bioassays and a new
dose of H2O2was added. This procedure of “additionetotal
consumptionesample collectioneaddition” is very important
since it prevents any reaction in dark conditions after sample collection, during the storage and possible interferences in the bioassays. Considering this procedure, the experimental data
must be expressed in terms of H2O2consumption and not
accumulated UV energy per liter of leachate.
The pre-treated leachate by photo-Fenton reaction was pumped into the neutralization tank, where pH was neutral-ized with NaOH to a pH around 7 under stirring (1 mL NaOH 50% per L pre-treated leachate), leading to iron precipitation as
Fe(OH)2, followed by a period of 3 h for sedimentation of iron
sludge (40 mL of iron sludge per liter of leachate
photo-treated). A very small concentration of iron (<0.1 mg L 1,
analyzed by AAS after preliminary acid digestion) was detec-ted in the supernatant after iron precipitation. Following this preliminary step, the neutralized photo-treated effluent was pumped to the conditioner tank, and afterward to the IBR previously colonized by activated biomass, which operates as
pump) between the conditioner tank and the IBR and pH is
controlled in a range of 6.5e7.5.
3.
Results and discussion
3.1. Leachate characterization
Table 1presents the main chemical/physical characteristics of the leachate after a pre-treatment in a reception/equalization lagoon with pure oxygen injection, an activated sludge reactor with an anoxic and aerobic zone and a secondary clarifier. The pre-treated effluent presents a strong dark-brown colour
associated with a high organic charge (DOC¼1098 mg C L 1;
COD¼4505 mg O2L 1), high nitrogen content (1780 mg N L 1),
high polyphenols concentration (93.0 mg caffeic acid L 1) and
a low BOD5/COD (0.07) ratio, indicating the low
biodegrad-ability of the leachate. The leachate presents also a high aromatic content measured as absorbance at 254 nm (the wavelength at which the aromatic compounds present
maximum absorption) (Mrkva, 1983). Another relevant point is
the high conductivity attributed to the high concentration of chloride, sulfate, ammonium ions, potassium and sodium. The effluent contains also a high concentration of suspended, dissolved and volatile solids. Heavy metals were relatively low, except total chromium.
3.2. Solar photo-Fenton process
Rocha et al. (2011)showed that the photo-Fenton reaction is faster than the Fenton reaction and the heterogeneous
pho-tocatalysis with TiO2, TiO2/H2O2/UV or homogeneous with
H2O2/UV. The optimum iron concentration for the
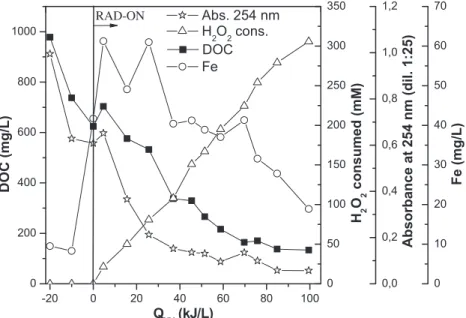
photo-Fenton treatment of this leachate is 60 mg Fe2þL 1(Fig. 1). The
photo-Fenton kinetics shows a slow initial reaction rate,
fol-lowed by a first-order kinetic behavior (k ¼0.020 L kJUV 1,
r0¼12.5 mg kJUV 1), with a H2O2consumption rate of 3.0 mmol
H2O2kJUV 1, and finally, a reaction period characterized by
a lower DOC degradation and H2O2consumption until the end
of the experiment, presumably due to formation of
low-molecular carboxylic groups (Kavitha and Palanivelu, 2004).
3.3. Evaluation of combined biological and photo-Fenton
treatment
In order to assess the biocompatibility of the pre-treated
effluent, different biodegradability tests, such as Zahne
Well-ens and activated sludge respirometry, were performed at
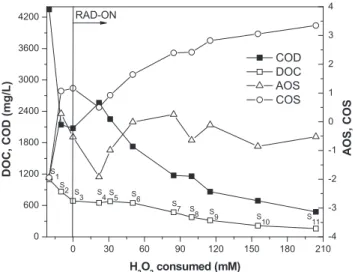
different stages of the solar photo-Fenton reaction. Fig. 2
presents the evolution of DOC, COD and two parameters, AOS (average oxidation state) and COS (carbon oxidation state), which can be used to evaluate the oxidation degree and
efficiency of the oxidative process, respectively (Amat et al.,
2007; Arques et al., 2007):
AOS¼4 1:5COD
DOC (9)
COS¼4 1:5COD
DOC0
(10)
where DOC is the dissolved organic carbon at time t(mg of
C L 1), DOC
0 is the initial dissolved organic carbon of the
solution (mg of C L 1) and COD is the chemical oxygen
demand at timet(mg of O2L 1). AOS takes values betweenþ4
for CO2, the most oxidized state of C, and 4 for CH4, the most
reduced state of C. The AOS only takes into consideration the
organic matter in the solution. In COS calculation, CO2
elimi-nated from the solution (with an oxidation stateþ4) is also
taken into account (Amat et al., 2007; Arques et al., 2007).
The COD concentration decreases 89% (from 4348 to
477 mg O2L 1), showing a strong oxidation of the organics,
which is well correlated with the COS parameter, which increased from 1.9, indicating the presence of rather reduced
-20 0 20 40 60 80 100
0 200 400 600 800 1000
RAD-ON
DOC
D
O
C
(m
g
/L
)
Q
UV(kJ/L)
0 50 100 150 200 250 300 350
H
2
O
2cons.
H
2
O
2c
o
n
s
u
m
e
d
(m
M)
0,0 0,2 0,4 0,6 0,8 1,0 1,2
Abs. 254 nm
A
b
s
o
rb
a
n
c
e
a
t
2
5
4
n
m
(d
il
.
1
:2
5
)
0 10 20 30 40 50 60 70
Fe
F
e
(
m
g
/L
)
Fig. 1eDOC degradation of landfill leachate, H2O2consumed, iron concentration and aromatic content (absorbance at
organic compounds, toþ3.4, which means strong
minerali-zation and generation of highly oxidized intermediates.Fig. 2
also shows that AOS starts at 1.9, increases rapidly to
approximately 0.28 due to acidification, decreasing again to the initial value and then increases to 0.25 and remains almost constant during the phototreatment. The increase of AOS suggests that more oxidized organic intermediates are formed during the treatment and, after AOS reaches a plateau, the chemistry of the intermediates generated does not vary
significantly (Sarria et al., 2002).
The BOD5/COD ratio has been established as a more
reli-able parameter to evaluate the biodegradability (Marco et al.,
1997; Esplugas et al., 2004; Metcalf and Eddy, 2005), as it is not affected either by the amount or by the oxidation state of
organic matter (Amat et al., 2009). Fig. 3 shows a very
important increase of BOD5/COD ratio (from 0.07 to 0.44),
suggesting that photo-oxidation enhanced significantly the
biodegradability. The OUR/OUR0profile shows also the same
trend, showing a high increase after 155 mM of H2O2
consumed (OUR0 is the oxygen uptake rate for the raw
leachate used in this work). At the end of the phototreatment the OUR increased approximately six times when compared
with the raw leachate (OURraw leachate ¼ 1.04 10 3 mol
O2mol 1C h 1), indicating that photo-oxidation treatment
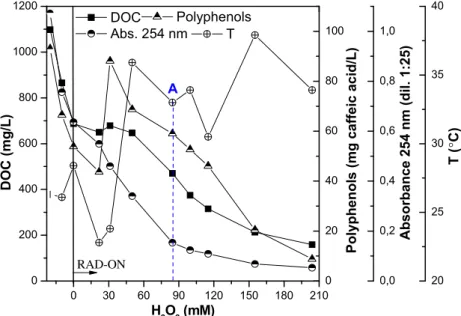
leads to more biodegradable organic carbon, which can be assimilated by the activated sludge. Polyphenols concentra-tion and aromatic content given by absorbance at 254 nm after
dilution 1:25 (Fig. 4), shows a similar profile, leading to 78%
reduction after 155 mM of H2O2consumed, and only more 12%
until the end of the experiment (204 mM).
According to the ZahneWellens test (Fig. 5), which involves
longer periods of contact (28 days) of the sample with micro-organisms to allow some adaptation of the biomass, the first four samples (non-treated, after pH adjustment, after iron
addition and after 22 mM H2O2 consumed) present a poor
biodegradation level, between 14 and 20%. However, as expected, the biodegradability of the leachate was enhanced during the photo-Fenton treatment and a value higher than 70% biodegradation after 28 days was achieved for sample 10. Although sample 10 seems to be the best point to stop the pre-oxidation process, samples 7, 8 and 9 also present high biodegradability levels of 61%, 66% and 68%, respectively, which corresponds to savings in the UV energy requirements
of 50%, 41% and 24% and H2O2consumption of 54%, 47% and
22%, relatively to sample 10.
The high concentration of nitrogen in landfill leachates constitutes, beyond the presence of recalcitrant carbon compounds, a big environmental concern that must be solved. The concentration profiles of nitrate, nitrite, ammonium and total nitrogen during the photo-Fenton reaction are shown in Fig. 6. The total nitrogen concentration, after a first decrease 0 30 60 90 120 150 180 210
0 600 1200 1800 2400 3000 3600 4200
COD DOC
D
O
C
,
C
O
D
(m
g
/L
)
H2O2 consumed (mM)
-4 -3 -2 -1 0 1 2 3 4
AOS COS
A
O
S
,
C
O
S
RAD-ON
S 2 S
3 S4S5 S6 S
7 S
8 S9 S
10 S11 S
1
Fig. 2eDOC, COD, AOS, and COS evolution as a function of
the hydrogen peroxide consumption during the photo-Fenton process.
0 200 400 600 800 1000 1200
RAD-ON
DOC
D
O
C
(m
g
/L
)
H
2
O
2(mM)
A
0.0 0.1 0.2 0.3 0.4 0.5
BOD
5/COD
B
O
D
5/C
O
D
0 1 2 3 4 5 6 7
OUR/OUR
0
O
U
R
/O
U
R
00 10 20 30 40 50 60
Fe
F
e
(
m
g
/L
)
0 30 60 90 120 150 180 210
Fig. 3eDOC, BOD5/COD ratio, OUR/OUR0and Fe concentration evolution as a function of the hydrogen peroxide
during the acidification process, maybe due to retention of nitrogenated compounds in the foam formed, returned to the initial value (between sample 4 and 5) and remained
approx-imately constant during the photo-Fenton reaction (z1.7 g
N L 1).
The high concentration of nitrite (z469 mg NeNO2 L 1) can
be justified by the nitrification/denitrification stages in the biological system installed in the sanitary landfill, taking into consideration that leachate samples used for the experiments performed in this work were collected after the biological
process. However, almost all nitrite were easily oxidized to nitrate after acidification. The leachate presents initially a low
concentration of nitrates (86 mg NeNO3 L 1) that increased
abruptly tow1178 mg NeNO3 L 1at sample 4 (22 mM of H2O2
consumed) and remained approximately constant until the end of the experiment. This behavior is explained by the nitrite conversion into nitrate and by the conversion of organic nitrogen into ammoniacal nitrogen, which remained
approx-imately constant between 115 and 154 mg NeNH4þL 1, and
then into NO3 . The oxidation of ammonia to nitrate was also
observed during the photo-Fenton process applied to a
bio-recalcitrant industrial compound, a-methylphenylglycine
(Oller et al., 2007).
After sample 6, the organic nitrogen remained
approxi-mately constant (360 mg N L 1), which corresponds to the
0 30 60 90 120 150 180 210 0
200 400 600 800 1000 1200
RAD-ON
DOC
D
O
C
(m
g
/L
)
H
2O
2(mM)
A
0 20 40 60 80 100
Polyphenols
Po
ly
p
h
e
n
o
ls
(m
g
c
a
ffe
ic
a
c
id
/L
)
0,0 0,2 0,4 0,6 0,8 1,0
Abs. 254 nm
A
b
s
o
rb
a
n
c
e
2
5
4
n
m
(d
il
.
1
:2
5
)
20 25 30 35 40
T
T
(
°
C
)
Fig. 4eDOC, polyphenols concentration, absorbance at 254 nm and temperature evolution as a function of the hydrogen
peroxide consumption during the photo-Fenton process.
0 4 8 12 16 20 24 28
0 10 20 30 40 50 60 70 80 90 100
Dt
(%
)
Time (days)
0 10 20 30 40 50 60 70 80 90 100
Dt
(%
)
Fig. 5eZahneWellens test for samples taken during the
photo-Fenton process (initial sample is also showed, as the reference):5eS1, DOC[1098 mg LL1;9eS2,
DOC[865 mg LL1;>eS3, DOC[688 mg LL1;AeS4,
DOC[650 mg LL1;+eS5, DOC[678 mg LL1;
7
eS6,DOC[647 mg LL1;
;
eS7, DOC[470 mg LL1;B eS8,
DOC[374 mg LL1;C
eS9, DOC[315 mg LL1;6 eS10,
DOC[213 mg LL1;:
eS11, DOC[158 mg LL1;
-eReference.
1 2 3 4 5 6 7 8 9 10 11 0
300 600 900 1200 1500 1800
N
TOTAL
NO
-2+NO -3+NH
+ 4
NO -2
NO
-3
NH+
4
N-NO
- ; N-2
NO
- ;N3
-NH
+ ; N4
TO
TAL
(m
g/
L)
Sample Number
0 300 600 900 1200 1500 1800
N-NO
-; N2
-N
O
-;N3
-N
H
+; N4
TO
TAL
(
m
g/L)
Fig. 6eProfile of nitrate, nitrite, ammoniacal nitrogen and
difference between the total nitrogen and the sum of nitrites, nitrates and ammoniacal nitrogen. It seems that between
sample 1 and 6 (50.2 mM of H2O2consumed), 700 mg of organic
nitrogen per liter was converted into ammonia, and then into nitrite and nitrate. Approximately 90% of the organic nitrogen converted to ammonia was due to leachate acidification to pH 2.8.
The concentration profile of Cl , SO42 , PO43 ions and total
phosphorous are presented inFig. 7. The chloride
concentra-tion in soluconcentra-tion decreased sharply from 3.8 g L 1to 2.2 g L 1,
after the acidification process, possible due to the retention in the foam formed, but it was gradually released into the solu-tion, remaining almost constant during the photo-Fenton
reaction at 3.2 g L 1.
The sulfate concentration increased drastically after the addition of sulfuric acid for the acidification of leachate to
pHz2.8 and addition of iron sulfate, and remained constant
during the reaction (2.6 g L 1).
The concentration of total phosphorous and phosphates remained approximately constant during the photo-Fenton
treatment at 1 mg PePO43 and 11.6 mg P L 1, respectively.
3.4. Evaluation of biological nitrification and
denitrification
In order to evaluate the optimal phototreatment time to reach a biodegradable effluent and nitrogen removal by a biological
nitrificationedenitrification system, another photo-Fenton
experiment was carried out in order to get a photo-treated
leachate with a residual organic carbon of 446 mg L 1,
324 mg L 1and 220 mg L 1, which corresponds to the more
biodegradable samples, 7, 9 and 10 of the ZahneWellens test.
After the pre-oxidation, the pre-treated leachate was
neutralized to pH 7, leading to iron precipitation as Fe(OH)2,
and after iron sludge removal, the wastewater was introduced into the biological system constituted by a conditioner tank and IBR previously colonized by activated sludge from a municipal WWTP. A volume of 60 L of the pre-treated
leachate (DOC¼324 mg L 1) and 10 L of suspended biomass
resulted from the inoculation suspension (DOC¼1150 mg L 1,
resulting from the use of methanol during the adaptation period), were added to the biological reactor.
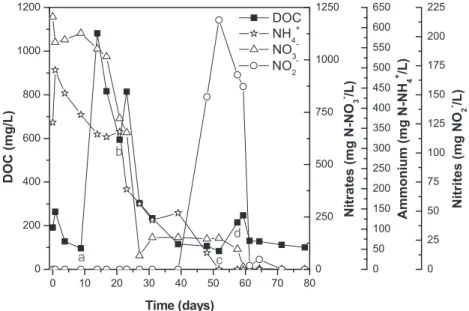
Fig. 8presents the evolution of DOC, NH4þ, NO3 and total
nitrogen concentration during the denitrification process. It can be seen an increase in DOC due to the addition of 10 L of suspended biomass and a decrease of total nitrogen and nitrates due to dilution and adsorption of nitrogenated organic compounds on the biomass. During the first three days, almost no denitrification was observed, but almost all the DOC present initially in the pre-treated leachate was consumed. After the first addition of methanol (370 mL,
0.96 g cm 3) on the third day (point a), a decay ratio of 312 mg
C day 1and 175 mg N
eNO3 day 1, which is equivalent to
4.75 mg CH3OH per mg NeNO3 (2.48 mg NO3 per mg C), was
observed.Fig. 8also shows a small decay of ammonia along
the denitrification process. Between the 9th and 14th days the DOC remained almost constant, meaning that this residual
organic carbon (120 mg C L 1) is not biodegradable by this kind
of biomass. Another addition of methanol (25 mL, point b) was enough to eliminate all the nitrates present in the photo-treated leachate.
The second experiment was performed with a
photo-treated leachate (446 mg L 1, point 7), in order to study the
denitrification and nitrification processes and to evaluate the biodegradability of all organic carbon. In this case, the mass ratio between methanol and nitrate obtained was to 3.6 mg
CH3OH per mg NeNO3 achieving the same final residual DOC
of 120 mg L 1.
After complete removal of nitrates (1st denitrification step), aeration was promoted in order to have sufficient oxygen to perform a nitrification cycle. This test was
per-formed in winter, at an average temperature of 13C. In these
conditions almost no nitrification occurred during 20 days. So, it was decided to collect 4 L of the wastewater and perform
the study at controlled temperature (23 C) and aeration
conditions.
1 2 3 4 5 6 7 8 9 10 11
0 500 1000 1500 2000 2500 3000 3500 4000
Chloride
C
h
lo
ri
d
e
(m
g
C
l
-
/L
)
Sample Number
0 500 1000 1500 2000 2500 3000
Sulphate
Su
lp
h
a
te
(m
g
SO
2
-
/L
4)
0 2 4 6 8 10 12 14 16 18
Phosphate
Ph
o
s
p
h
a
te
(m
g
P-PO
3
-4
/L
)
0 2 4 6 8 10 12 14 16 18
Total phosphorous
T
o
ta
l
p
h
o
s
p
h
o
ro
u
s
(
m
g
P/
L
)
Ilies and Mavinic (2001) showed that decreasing the
temperature from 20 to 10C, nitrification and denitrification
processes suffered major inhibition.Isaka et al. (2007)showed
that using nitrifying bacteria entrapped in a gel carrier increased the nitrification rates at low temperatures (0.71 kg
N m 3day 1at 10C, DO
>7 mg L 1, 7.5<pH<8.0). However,
ammonium nitrogen at low concentrations was detected in the effluent, showing that cultivated ammonium-oxidizing bacteria at low temperatures had low affinity for ammonium nitrogen.
Fig. 9shows that after four days of adaption period, the
ammonia removal rate was 87 mg NH4þ per day (68 mg
NeNH4þ per day), converted into 90.1 mg NO3 per day
(20.3 mg NeNO3 per day) and 33 mg NO2 per day (10 mg
NeNO2 per day), which leads to the ratios 3.4 mg
NeNH4þmg 1NO3 and 6.8 mg NeNH4þmg 1NeNO2 . At the
end of the nitrification reaction 305 mg NeNH4þ L 1 were
converted into 43 mg NeNO2 L 1and 178 mg NeNO3 L 1,
which means that approximately 170 mg N were converted
into N2, consuming 33 mmol of NaOH per liter (1.3 g NaOH per
liter). After the nitrification cycle, a second denitrification cycle was performed adding 3.4 mL of methanol at point a and 0.2 mL of methanol at point b, obtaining a denitrification ratio
of approximately 3 mg CH3OH per mg of (NeNO3 þNeNO2 ),
which indicates that less carbon is needed for reduction of
nitrites instead of nitrates.Canziani et al. (2006)studied the
nitrification and denitrification of old landfill leachates
(0.2e4 g NeNH4þL 1,T¼33C, pH¼8.0) showing that for
values of DO between 0.2 and 0.5 mg L 1, 90% oxidation of
ammonia to nitrite was achieved. The impact of organic
carbon on nitrification performance performed by Ling and
Chen (2005)showed that 60e70% nitrification rate reduction
was observed when COD/N ration increased from 0 to 3
(T¼20C).
During nitrification, DOC removal is very slow, however, some of the organic carbon from the photo-treated leachate is eliminated during denitrification, leading to a final DOC of
86 mg L 1and final COD of 227 mg O
2L 1. Denitrification of the
leachate consumed 27.5 mmol H2SO4per liter.
A last denitrification/nitrification experiment was per-formed in a 4 L- suspended biomass reactor at temperature
(22 C) and aeration controlled conditions, using a
photo-treated leachate with a residual DOC of 240 mg L 1, which is
equivalent to sample 10 of the biodegradability tests (Fig. 10). In
this case the C/N ratio obtained for the denitrification reaction
was 2.8 mg CH3OH per mg NeNO3 (points a, b, c and d indicate
the addition of 15, 5, 5 and 2.5 mL of methanol), which is similar
to the ratios reported byKulikowska and Klimiuk (2004), 2.43 g
CH3OH g 1NeNO3(3.6 g COD g 1NeNO3), andChristensson
et al. (1994), 2.8e3.0 g CH3OH g 1NeNO3(4.5e4.1 g COD g 1
NeNO3), although those values are more than 2 times
higher than the stoichiometric mass ratio between consumed
0 3 6 9 12 15
0 200 400 600 800 1000 1200
b
addition of biomass
DOC
D
O
C
(m
g
/L
)
Time (days)
a
0 200 400 600 800 1000 1200 1400 1600 1800
NO3
-T
o
ta
l
N
itr
o
g
e
n
,
A
m
m
o
n
iu
m
,
N
itr
a
te
s
(
m
g
N
/L
)
312 mg C/day
175 mg N-NO3-/day NH4+
Total Nitrogen
Fig. 8eEvolution of total nitrogen, nitrate, nitrite,
ammonia and DOC concentration during the biological denitrification of the photo-treated leachate (initial DOC of 324 mg LL1).
0 50 100 150 200 250 300 350
DOC
D
O
C
(m
g
/L
)
Time (days)
68 mg N-NH4+/day
3,4 g NO3-/g C
0 50 100 150 200 250
NO3
-N
itr
a
te
s
(m
g
N
-N
O3 - /L
)
0 50 100 150 200 250 300 350 400
NH4+
A
m
m
o
n
iu
m
(m
g
N
-N
H4 + /L
)
0 10 20 30 40 50 60 70
b NO2
-N
itr
it
e
s
(
m
g
N
O2 - /L
)
a
0 4 8 12 16 20 24
Fig. 9eEvolution of total nitrogen, nitrate, nitrite, ammonium and DOC concentration during the denitrification/nitrification
methanol-C and nitrate-N (C/N¼0.46) (Eqs.4 and 5).Modin et al. (2007)showed that methane can be a potentially inexpensive carbon source for the denitrification of leachates, since methane is generated in landfills, although the use of methane for electricity generation, presence of hydrogen sulphide impurities and indirect methane oxidation when used for
denitrification (Thalasso et al., 1997) can be negative points.
Considering the ratio above mentioned, the total denitrifi-cation of nitrates, considering the nitrates formed during the nitrification process, requires 4.4 g of methanol per liter of leachate or 4.6 mL of commercial methanol per liter of leachate. It was observed a parallel nitrification reaction with
a decay of 11.7 mg NeNH4þper day even at very low oxygen
concentrations (<0.2 mg O2L 1). The absence of biodegradable
carbon between days 30 and 50, stopped the denitrification
reaction. Oxygen concentration was maintained between 0.5 and 2.0, and nitrification of the remaining ammonia is observed and consequently lead to the formation of nitrates and nitrites. After total elimination of ammonia, two more additions of methanol (points c and d), were sufficient for complete denitrification. In this experiment the lowest
dis-solved organic carbon concentration obtained was 83 mg L 1.
According to these results, complete removal of ammoni-acal nitrogen, nitrates and nitrites is possible for this pre-treated leachate and sample 7 of the phototreatment can be considered the best one for the combination with a biological oxidation process. So, the optimal phototreatment energy
estimated to reach a biodegradable effluent is 29.2 kJUV L 1
(3.3 h of photo-Fenton at a constant solar UV power of
30 W m 2), consuming 90 mM of H
2O2when used in excess,
0 10 20 30 40 50 60 70 80
0 200 400 600 800 1000 1200
DOC
D
O
C
(m
g
/L
)
Time (days)
0 250 500 750 1000 1250
NO
3-N
itr
a
te
s
(m
g
N
-N
O
3-
/L
)
0 50 100 150 200 250 300 350 400 450 500 550 600 650
NH
4+A
m
m
o
n
iu
m
(m
g
N
-N
H
4+
/L
)
0 25 50 75 100 125 150 175 200 225
d
c
b
NO
2-N
itr
ite
s
(m
g
N
O
2-
/L
)
a
Fig. 10eEvolution of total nitrogen, nitrate, nitrite, ammonium and DOC concentration during the denitrification/
nitrification of the photo-treated leachate (initial DOC of 220 mg LL1).
Table 2eLandfill leachate characteristics at the best phototreatment time and discharge limits (Decree n. 236/98).
Parameter LOPT LPBT DLPL DLBL DLUL DLCHL
pH 2.9 7.0 6.0e9.0 6.0e8.5 6e9 5.5e8.5
BOD5, 20C (mg O2L 1) 260 e 40 120** 220 20
COD (mg O2L 1) 1174 227 150 360** e 60
DOC (mg C L 1) 470 83
e e e e
Nitrite (mg NeNO2 L 1) 0 <0.5 e e e e
Nitrate (mg NO3 L 1) 5300 <5 50 e e e
Ammoniacal nitrogen (mg NeNH4þL 1) 149 <1 10 e 10 12 Total Nitrogen (mg N L1) 1280
<10 15 10 e 20
Sulfate (g SO42 L 1) 2.6 2.6 2 e e
Total phosphorous (mg P L 1) 11.4 7.0 10 1
e 1.5
Phosphates (mg PO42 L1) 2.9 2.0 e e e e
Polyphenols (mg caffeic acid L1) 59
e e e e e
Chloride (g Cl L1) 3.2 3.2
e e e e
Dissolved iron (mg L 1) 39.3
<0.05* 2* 10 e 5
*Total iron; **Flow rates between 200 and 1000 m3/day; LOPT-Leachate at the Optimum Phototreatment time; LPBT-Leachate Photo-Bio-Treated;
which means almost 57% mineralization of the leachate, 57% reduction of polyphenols concentration and 86% reduction of aromatic content.
Although total nitrogen removal was achieved using a nitrification/denitrification process, aeration and an external organic carbon source are needed. A promising process, called Anammox, can save up to 90% of operation costs as compared to
the traditional nitrogen removal process (Jetten et al., 2001),
since in this case microbial oxidation of ammonium with nitrite to nitrogen gas occurs under strict anoxic conditions,
and no organic carbon source is needed (Graaf et al., 1996;
Strous et al., 1998).Liu et al. (2010)used shortcut nitrification
combined withAnammoxfor treating diluted effluent from an
UASB reactor fed by landfill leachate and found an average total inorganic nitrogen removal efficiency of 87%.
Table 2 compares the characteristics of the photo-bio-treated leachate with the discharge limits according to the Portuguese, Chinese, Brazilian and USA Legislation. Sulfate ions concentration greatly exceeds the discharge limits imposed by Portuguese legislation. COD is also another parameter that exceeds the discharge limits imposed by Portugal and China, although accomplishes Brazilian regula-tions. However, considering the complex nature of leachates, higher discharge limits can be stipulated, as recommended by
EPA, that allows BOD5values of 220 mg O2L 1.
4.
Conclusions
Leachate from landfills usually has high content of pollutants, especially recalcitrant organic compounds, as humic and fulvic acids, xenobiotics, pesticides, and other harmful substances, that result in environment pollution problems.
The solar photo-Fenton process was found to be very effi-cient in the treatment of leachates, enhancing the biodegrad-ability of the leachate and making possible a subsequent treatment by a biological oxidation process. Biological nitrogen removal was achieved by a two-step process: aerobic nitrifi-cation of ammonia to nitrite and then to nitrate followed by anoxic denitrification of nitrate to nitrite, nitric oxide, nitrous oxide and nitrogen gas using an external carbon source.
Acknowledgments
Financial support for this work was in part provided by LSRE financing by FEDER/POCI/2010 and EFACEC Ambiente SA.
r e f e r e n c e s
1999/31/EC, 1999. Council directive 1999/31/EC of 26 April 1999 on the landfill of waste. Off. J. Eur. Communities (in European Union).
Alleman, J.E., 1984. Elevated nitrite occurrence in biological wastewater treatment systems. Water Sci. Technol. 17,
409e419.
Amat, A.M., Arques, A., Galindo, F., Miranda, M.A., Santos-Juanes, L., Vercher, R.F., Vicente, R., 2007. Acridine yellow as solar photocatalyst for enhancing biodegradability and
eliminating ferulic acid as model pollutant. Appl. Catal. B.
73 (3e4), 220e226.
Amat, A.M., Arques, A., Garcı´a-Ripoll, A., Santos-Juanes, L., Vicente, R., Oller, I., Maldonado, M.I., Malato, S., 2009. A reliable monitoring of the biocompatibility of an effluent along an oxidative pre-treatment by sequential bioassays and
chemical analyses. Water Res. 43 (3), 784e792.
Arques, A., Amat, A.M., Garcia-Ripoll, A., Vicente, R., 2007. Detoxification and/or increase of the biodegradability of aqueous solutions of dimethoate by means of solar
photocatalysis. J. Hazard. Mater. 146 (3), 447e452.
Assmuth, T., Penttila¨, S., 1995. Characteristics, determinants and interpretations of acute lethality in daphnids exposed to
complex waste leachates. Aquat. Toxicol. 31 (2), 125e141.
Baun, A., Ledin, A., Reitzel, L.A., Bjerg, P.L., Christensen, T.H., 2004. Xenobiotic organic compounds in leachates from ten
danish msw landfillsechemical analysis and toxicity tests.
Water Res. 38 (18), 3845e3858.
Bureau C. N. E. P, 2002. Discharge Standards of Municipal Wastewater Treatment Plants in China issued by Chinese national environment protection bureau, GB18918. Burton, S.Q., Watson-Craik, I.A., 1998. Ammonia and nitrogen
fluxes in landfill sites: applicability to sustainable landfilling.
Waste Manage. Res. 16, 41e53.
Calace, N., Liberatori, A., Petronio, B.M., Pietroletti, M., 2001. Characteristics of different molecular weight fractions of organic matter in landfill leachate and their role in soil
sorption of heavy metals. Environ. Pollut. 113 (3), 331e339.
Canziani, R., Emondi, V., Garavaglia, M., Malpei, F., Pasinetti, E., Buttiglieri, G., 2006. Effect of oxygen concentration on biological nitrification and microbial kinetics in a cross-flow membrane bioreactor (MBR) and moving-bed biofilm reactor (MBBR)
treating old landfill leachate. J. Memb. Sci. 286 (1e2), 202e212.
Chian, E.S.K., DeWalle, F.B., 1976. Sanitary landfill leachates and
their treatment. J. Environ. Eng. Div., 411e431.
Christensen, T.H., Kjeldsen, P., Bjerg, P.L., Jensen, D.L.,
Christensen, J.B., Baun, A., Albrechtsen, H.-J., Heron, G., 2001. Biogeochemistry of landfill leachate plumes. Appl. Geochem.
16 (7e8), 659e718.
Christensson, M., Lie, E., Welander, T., 1994. A comparison between ethanol and methanol as carbon sources for denitrification. Water Sci. Technol. 30, 83.
Clesceri, L.S., Greenberg, A.E., Eaton, A.D., 2005. Standard
Methods for Examination of Water & Wastewater, 21sted.
American Public Health Association (APHA), American Water Works Association (AWWA) & Water Environment Federation (WEF).
Deng, Y., Englehardt, J.D., 2007. Electrochemical oxidation for landfill leachate treatment. Waste Manage. (Oxford) 27 (3),
380e388.
EMPA, 1992. OCDE Guideline for Testing of Chemicals. adopted by the council on 17th july 1992, Zahn-Wellens/EMPA test. Swiss Federal Laboratories for Materials Testing and Research. EPA, 1996. U.S. Environmental Protection Agency, Prevention
Pesticides and Toxic Substances (7101). Fates; Transport and Transformation Test Guidelines Oppts 835.3200
Zahn-Wellens/EMPA Test EPA 712-C-96e084, Washington, DC.
EPA, 2000. Code of Federal Regulations (CFR): Protection of the Environment chapter I, subchapter N, effluent guidelines and standard, 445 landfill point source category.
Esplugas, S., Contreras, S., Ollis, D.F., 2004. Engineering aspects of the integration of chemical and biological oxidation: simple mechanistic models for the oxidation treatment. J. Environ.
Eng. 130 (9), 967e974.
Folin, O., Ciocalteau, V., 1927. On tyrosine and tryptophane
determinations in proteı´ns. J. Biol. Chem. 73, 627e650.
mill wastewaters and landfill leachate treatment. Chem. Eng.
J. 92 (1e3), 215e225.
Graaf, A.A.V.d., Bruijn, P.d., Robertson, L.A., Jetten, M.S.M., Kuenen, J.G., 1996. Autotrophic growth of anaerobic ammonium-oxidizing microorganisms in a fluidized bed
reactor. Microbiology 142 (8), 2187e2196.
Ilies, P., Mavinic, D.S., 2001. The effect of decreased ambient temperature on the biological nitrification and denitrification of a high ammonia landfill leachate. Water Res. 35 (8),
2065e2072.
Isaka, K., Yoshie, S., Sumino, T., Inamori, Y., Tsuneda, S., 2007. Nitrification of landfill leachate using immobilized nitrifying
bacteria at low temperatures. Biochem. Eng. J. 37 (1), 49e55.
Jetten, M.S.M., Wagner, M., Fuerst, J., van Loosdrecht, M., Kuenen, G., Strous, M., 2001. Microbiology and application of the anaerobic ammonium oxidation (‘anammox’) process.
Curr. Opin. Biotechnol. 12 (3), 283e288.
Jokela, J.P.Y., Rintala, J.A., 2003. Anaerobic solubilisation of nitrogen from municipal solid waste (MSW). Rev. Environ. Sci.
Biot. 2 (1), 67e77.
Kang, K.-H., Shin, H.S., Park, H., 2002. Characterization of humic substances present in landfill leachates with different landfill
ages and its implications. Water Res. 36 (16), 4023e4032.
Kavitha, V., Palanivelu, K., 2004. The role of ferrous ion in Fenton and photo-Fenton processes for the degradation of phenol.
Chemosphere 55 (9), 1235e1243.
Kulikowska, D., Klimiuk, E., 2004. Removal of organics and nitrogen from municipal landfill leachate in two-stage SBR
reactors. Pol. J. Environ. Stud. 13 (4), 389e396.
Kulikowska, D., Klimiuk, E., 2008. The effect of landfill age on municipal leachate composition. Bioresour. Technol. 99 (13),
5981e5985.
Kurniawan, T.A., Lo, W.-h., Chan, G.Y.S., 2006. Radicals-catalyzed oxidation reactions for degradation of recalcitrant compounds
from landfill leachate. Chem. Eng. J. 125 (1), 35e57.
Ling, J., Chen, S., 2005. Impact of organic carbon on nitrification performance of different biofilters. Aquacult. Eng. 33 (2),
150e162.
Liu, J., Zuo, J.E., Yang, Y., Zhu, S., Kuang, S., Wang, K., 2010. An autotrophic nitrogen removal process: short-cut nitrification combined with anammox for treating diluted effluent from an uasb reactor fed by landfill leachate. J. Environ. Sci. 22 (5),
777e783.
Marco, A., Esplugas, S., Saum, G., 1997. How and why combine chemical and biological processes for wastewater treatment.
Water Sci. Technol. 35 (4), 321e327.
Metcalf and Eddy, 2005. Wastewater Engineering Treatment and Reuse, fourth ed. Metcalf & Eddy.
Modin, O., Fukushi, K., Yamamoto, K., 2007. Denitrification with methane as external carbon source. Water Res. 41 (12),
2726e2738.
Mrkva, M., 1983. Evaluation of correlations between absorbance
at 254 nm and COD of rivers waters. Water Res. 17, 231e235.
Nogueira, R.F.P., Oliveira, M.C., Paterlini, W.C., 2005. Simple and
fast spectrophotometric determination of H2O2in
photo-Fenton reactions using metavanadate. Talanta 66 (1), 86e91.
Nohava, M., Vogel, W.R., Gaugitsch, H., 1995. Evaluation of the luminescent bacteria bioassay for the estimation of the toxicological potential of effluent water samples
ecomparison with data from chemical analyses. Environ. Int.
21 (1), 33e37.
Oller, I., Malato, S., Sanchez-Perez, J.A., Gernjak, W., Maldonado, M.I., Perez-Estrada, L.A., Pulgarin, C., 2007. A combined solar photocatalytic-biological field system for the mineralization of an industrial pollutant at pilot scale. Catal.
Today 122 (1e2), 150e159.
O¨man, C.B., Junestedt, C., 2008. Chemical characterization of
landfill leachatese400 parameters and compounds. Waste
Manage. (Oxford) 28 (10), 1876e1891.
Portaria 05/89, 1989, Secretaria da sau´de e do meio ambiente, crite´rios e padro˜es de efluentes lı´quidos a serem observados por todas as fontes poluidoras que lancem seus efluentes nos corpos d’a´gua interiores do estado do Rio Grande do Sul. Primo, O., Rivero, M.J., Ortiz, I., 2008. Photo-Fenton process as an
efficient alternative to the treatment of landfill leachates.
J. Hazard. Mater. 153 (1e2), 834e842.
Randall, C.W., Barnard, J.L., Stensel, H.D., 1992. Design and retrofit of wastewater treatment plants for biological nutrient removal. In: Eckenfelder, W.W., Malina, J.F., Patterson, J.W. (Eds.). Technomic Publishing AG, Lancaster, Pensylvania. Renou, S., Givaudan, J.G., Poulain, S., Dirassouyan, F., Moulin, P.,
2008. Landfill leachate treatment: review and opportunity.
J. Hazard. Mater. 150 (3), 468e493.
Rocha, E.M.R., Vilar, V.J.P., Fonseca, A., Saraiva, I., Boaventura, R. A.R., 2011. Landfill leachate treatment by solar-driven AOPs.
Sol. Energy 85 (1), 46e56.
Ruiz, G., Jeison, D., Chamy, R., 2003. Nitrification with high nitrite accumulation for the treatment of wastewater with high
ammonia concentration. Water Res. 37 (6), 1371e1377.
Sarria, V., Parra, S., Adler, N., Peringer, P., Benitez, N., Pulgarin, C., 2002. Recent developments in the coupling of photoassisted and aerobic biological processes for the treatment of
biorecalcitrant compounds. Catal. Today 76 (2e4), 301e315.
Silva, A.C., Dezotti, M., Sant’Anna, G.L., 2004. Treatment and detoxification of a sanitary landfill leachate. Chemosphere
55 (2), 207e214.
Strous, M., Heijnen, J.J., Kuenen, J.G., Jetten, M.S.M., 1998. The sequencing batch reactor as a powerful tool for the study of slowly growing anaerobic ammonium-oxidizing
microorganisms. Appl. Microbiol. Biot. 50, 589e596.
Tatsi, A.A., Zouboulis, A.I., 2002. A field investigation of the quantity and quality of leachate from a municipal solid waste landfill in a Mediterranean climate (Thessaloniki, Greece).
Adv. Environ. Res. 6 (3), 207e219.
Thalasso, F., Vallecillo, A., Garcı´a-Encina, P., Fdz-Polanco, F., 1997. The use of methane as a sole carbon source for wastewater
denitrification. Water Res. 31 (1), 55e60.
Weichgrebe, D., Vogelpohl, A., Bockelmann, D., Bahnemann, D., 1993. Treatment of Landfill Leachates by Photocatalytic
Oxidation Using TiO2: A Comparison with Alternative
Photochemical Technologies. Elsevier Science Publishers B.V.,