AN EVALUATION OF THE ACCUMULATION OF INTRACELLULAR INORGANIC
NITROGEN POOLS BY MARINE MICROALGAE IN BATCH CULTURES
Paris L. Lavín1 & Sergio O. Lourenço2
1
Universidad de Concepción
Departamento de Botánica, Facultad de Ciencias Naturales y Oceanografía (Casilla 160-C, Concepción, Chile)
2
Universidade Federal Fluminense Departamento de Biologia Marinha
(Caixa Postal 100.644, 24.001-970, Niterói, RJ, Brazil) [email protected]
A
B S T R A C TMethods of extraction, changes in concentrations with growth, and effects of culture conditions on intracellular inorganic nitrogen pools (IIN - ammonia, nitrite, and nitrate) were studied in nine species of marine microalgae in batch cultures. The microalgae were analysed to compare three methods of extraction of IIN, one of them developed in this study. The extraction of IIN occurs efficient by with all three methods for four out of the nine species tested. However, for five species significant differences were found among the methods, the best results being obtained with the new method. Microalgae accumulate inorganic forms of nitrogen in different proportions. The species show higher concentrations of either ammonia or nitrate, and always lower concentrations of nitrite. Microalgae of smaller cellular volumes tend to attain higher values of IIN per cubic micrometer (the converse in large-volume species), with some exceptions (Amphidinium carterae and Nannochloropsis oculata). The use of aeration in the cultures determines a decrease in the concentrations of IIN, favours nitrogen assimilation, and generates an increase in growth rates and C:N ratio. High concentrations of IIN are characteristic of the exponential growth phase, but in some cases their occurrence may result from carbon deficiency.
R
E S U M OMétodos de extração, mudanças na concentração durante o crescimento e efeitos de condições de cultivo sobre conteúdos de nitrogênio inorgânico intracelular (NII – amônia, nitrito e nitrato) foram estudados em nove espécies de microalgas marinhas em cultivos estanques. As microalgas foram analisadas para comparar três métodos de extração de NII, um dos quais desenvolvido neste estudo. A extração de NII ocorre de forma eficiente com os três métodos para quatro espécies. Contudo, para cinco espécies diferenças significativas foram encontradas e os melhores resultados foram obtidos com o método novo. As microalgas acumulam formas inorgânicas de nitrogênio em proporções diferentes. As espécies apresentam concentrações de amônia ou nitrato como as mais altas e sempre menores concentrações de nitrito. Microalgas de menores volumes celulares tendem a atingir valores mais altos de NII por micrômetro cúbico (contrariamente para espécies de volumes celulares maiores), com algumas exceções (Amphidinium carterae e Nannochloropsis oculata). A adição de aeração nos cultivos determina um decréscimo na concentração de NII, favorece a assimilação de nitrogênio e gera um aumento na taxa de crescimento e na razão C:N. Concentrações altas de NII são características da fase de crescimento exponencial, mas em alguns casos sua ocorrência pode resultar de deficiência por carbono.
Descriptors: Batch Culture, Carbon, Intracellular Inorganic Nitrogen, Marine Microalgae, Nitrogen, Surface : Volume Ratio.
Descritores: Carbono, Cultivo Estanque, Microalgas Marinhas, Nitrogênio, Nitrogênio Inorgânico Intracelular, Razão superfície : Volume.
INTRODUCTION
The most common forms of nitrogen in seawater nitrate, nitrite and ammonia, are inorganic,
medium into the cell. The assimilation of nitrogen consists of a sequence of enzymatic reactions that determine the incorporation of the inorganic nitrogen into organic molecules (Lobban & Harrison, 1994). Ammonia is the last inorganic intermediate product of the assimilatory process of nitrogen, and is incorporated into organic compounds by one or both of two main metabolic pathways: glutamate-deshydrogenase and glutamine-synthetase (Guerrero et al., 1981).
Intracellular nitrogen is found in a wide range of organic substances (amino acids, peptides, protein, nucleic acids, chlorophyll, phycoeritrin, vitamins) and inorganic substances, such as nitrate, nitrite and ammonia, which are un unassimilated forms of nitrogen (Lourenço et al., 1998). Phytoplankton, seaweeds and marine flowering plants may accumulate inorganic nitrogen and free amino acids as reserves of nitrogen (Dortch et al., 1984; Lee & Dunton, 1999; Naldi & Weeler, 1999). When no external supply of nitrogen is available reserves may be used to maintain the growth of natural populations for variable periods (Dortch, 1982). In long-term starvation phytoplankton may use up the inorganic nitrogen pool entirely as also a part of the organic nitrogen, with remarkable effects on chemical composition and photosynthetic yield (Turpin, 1991). Under long-term starvation of nitrogen, cells experience a selective loss of nitrogen compounds; inorganic pools (nitrate + nitrite + ammonia) tend to be consumed first, followed by free amino acids, phycobilins (in cianobacteria and some groups of eukatiotic algae), part of the protein content, RNA, and chlorophyll, in this sequence (Dortch et al., 1984). If cells are resupplied with nitrogen the assimilatory process is fast, and inorganic pools of nitrogen are rebuilt (Geider & La Roche, 2002).
The ability to accumulate inorganic nitrogen is a key factor in keeping phytoplankton alive despite the fluctuations in the nitrogen supply in natural environments (Dortch, 1982). However, marine microalgae may also accumulate large transitory pools of inorganic nitrogen when the rates of uptake are higher than the growth rates. The accumulation of pools of inorganic nitrogen, such as NO3-, may be a
consequence of differences in the rates of the previous step in the assimilatory process (Berges, 1997). In addition, the substances that accumulate nitrogen may control the rate of uptake of the element, as well as the enzymes involved, thus characterizing a feed-back mechanism.
The quantification of intracellular inorganic nitrogen pools (IIN) may be undertaken easily by the conventional methods for the analysis of dissolved nutrients in seawater (e.g. Strickland & Parsons, 1968; Aminot & Chaussepied, 1983; Grasshoff et al., 1983). A major obstacle to the performance of the analysis of intracellular inorganic nitrogen is the extraction of the
ions. The characteristics of cell wall composition play a key role in the efficiency of extraction of inorganic nitrogen from cells. Different methods have been proposed for the extraction of IIN, involving varions principles, such as osmotic shock with distilled water (Thoresen et al., 1982); osmotic shock combined with heating (Dortch, 1982); sonication (Thoresen et al., 1982); grinding of cells (Conover, 1975); the combination of osmotic shock, flux of water through samples, and heating (Lourenço et al., 1998). Most of the methods have been developed with the use of a narrow range of species. The development of new methods for the extraction of IIN should involve a large number of species, covering a range of biochemical characteristics and different taxonomic groups, in the tests.
Information on changes in the concentrations of IIN during the growth of marine microalgae in batch cultures is needed. Experimental data may contribute to the comprehension of mechanisms that determine the accumulation of IIN, thus allowing comparisons among different species. In this study a new technique for the extraction of IIN has been developed and is compared with two other methods, using samples of nine species of marine microalgae belonging to different taxonomic groups. In addition, the accumulation of IIN has been compared as among all the species used, and the influence of aeration (which promotes the addition of CO2) on the concentration of inorganic pools of
nitrogen in different growth phases of two species has been evaluated.
M
ATERIAL ANDM
ETHODSMicroalgae Tested
Culture Conditions
For the experiments to compare the methodologies for the extraction of inorganic nitrogen, starter cultures of 2 - 5 ml in the mid-exponential growth phase were inoculated into 150 ml of seawater, previously autoclaved at 121 ºC for 30 min in 300 ml-borosilicate conical flasks. The seawater was enriched with f/2 nutrient solution (Guillard & Rhyther, 1962). Flasks were exposed to 80 µmol photons m-2 s-1 (measured with a Li-Cor, model LI-185B) from beneath, provided by fluorescent lamps (Sylvania daylight tubes), in a 12:12 h light:dark cycle. The mean temperatures of the experiments were 23 ± 2ºC (in the light period) and 20 ± 1ºC (in the dark period). The salinity in the experiments was 32.0. Cultures were not aerated and the flasks were shaken manually several times a day. Growth rates were calculated daily by direct microscopic cell counts with Fuchs-Rosenthal or Neubauer chambers. Daily sampling occurred six hours after the start of the light period, the time fixed for the observations. Independent experiments were carried out for each species, establishing at least six replicates to be analysed (n = 6); however, for some species more replicates were analysed. Samples for analysis of IIN were taken in the exponential growth phase only.
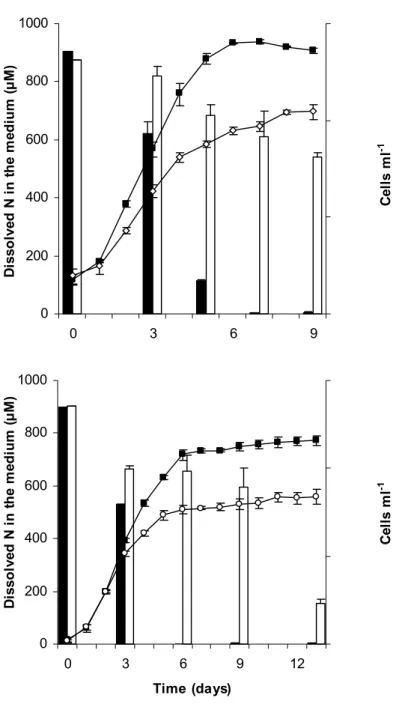
In the experiments carried out to evaluate the effects of aeration on the accumulation of IIN by S. costatum and T. gracilis, 2.0 l of culture in 3.0 l-borosilicate round flasks were used. Cultures were exposed to 187 µmol photons m-2 s-1, in a 12:12 h light:dark cycle, receiving 2.0 l min-1 of filtered air continuously. All other parameters and daily sampling were the same as those described above. The samples for the analysis of IIN were collected in different growth phases, on the same days on which the samples for dissolved nitrogen in the culture medium were analysed (see Fig. 3).
Sampling Procedure
Samples to be analysed for intracellular inorganic nitrogen were obtained by filtering (under vacuum) the cultures onto Whatman GF/F® glass microfiber filters (0.7 µm nominal pore size), previously submitted to a temperature of 400ºC for 4 h in a muffle furnace. vFilters vwere vkept at -20ºC in flasks containing silica-gel until the analysis could be performed v(no vmore vthan vtwov weeks later). Samples of 80 to 100 ml were concentrated by centrifugation at 7,000 g and 15°C for 10 min, at least once, vto obtain highly concentrated materials. The pellets were frozen at -20ºC and then freeze dried, weighed and stored in desiccators in a vacuum and protected from light until analysed for CHN elemental composition.
Cell Volume and Surface
The volumes and surfaces of the cells were measured using the equations provided by Hillebrand et al. (1999), assuming a suitable geometrical shape for each species. Mean values were based on measurements of 30 - 70 cells for each species in each culture flask, giving the four mean values used in the statistics (n = 4). We consider the mean value for each culturing flask as a replicate. Samples were fixed with lugol prior to cell measurements, and the cell volumes of all the species were corrected according to Montagnes et al. (1994), except for diatoms, whose measurements were corrected according to the procedures proposed by Smayda (1978).
Chemical Analysis
Intracellular inorganic nitrogen (IIN) was quantified for the following compounds: ammonia + ammonium, nitrate, and nitrite. Determinations of ammonia + ammonium (Aminot & Chaussepied, 1983), and nitrate and nitrite (Strickland & Parsons, 1968) were performed spectrophotometrically. Samples were kept frozen at -20 C until chemical analysis could be performed.
Total nitrogen was quantified by CHN analysis, in a CHN elemental analyser Perkin-Elmer, model 2400. Helium was used as a carrier gas. Acetanilide (C = 71.09%; N = 10.36%; H = 6.71%) and/or benzoic acid (C = 68.84%; H = 4.95%) were used for calibrating the instrument.
Results obtained for total nitrogen were used to calculate the protein content, using the nitrogen-to-protein conversion factors proposed by Lourenço et al. (2004).
Comparison of Methods for IIN Extraction
- Method A (Thoresen et al., 1982). The filters containing the samples were put in the filtration apparatus and 40 ml of hot (70 - 80°C) ultra-pure water were filtered through the sample, and then another 5 ml of ultra-pure water at room temperature were added. The volume was completed to 50 ml.
of water at room temperature was poured into the system and immediately filtered. All filtered volumes were gathered, filled to 50 ml. The water used in these assays was also analysed in order to correct possible contamination by the nitrogenous ions studied.
- Method C (this study). Filters with the samples were kept in 10 ml of ultra-pure water, in conical flasks, for 12 to 14 h at 4°C. After this period, the filters were removed from the flasks and completely ground in a Marconi, model MA099 potter’s device. The remains of the samples were recovered from the device by rinsing it with 5 ml of ultra-pure water. The ground sample was put onto a new fiberglass filter (also previously treated in a muffle furnace at 400°C for 4 hours), which was already in the vacuum filtration system, plus the 10 ml of water used in the osmotic extraction. The volume in each conical flask was filtered through the filter. Subsequently, 30 ml of hot ultra-pure water (70-80°C) was poured on the filter; this volume was filtered after 1 min. All filtered volumes were gathered, and filled to 50 ml.
For all three methods, the samples of IIN extracted from cells were kept at -20°C until the nitrate, nitrite and ammonium could be performed. The ultra-pure water used in the assays was also analysed in order to correct for possible contamination by the nitrogenous ions studied, receiving the same treatment as the samples in all the methods (heating, flux through fibreglass filters, freezing).
Comparison of Relative Accumulation of IIN by the Species
The relative concentration of IIN was calculated, in fg/µm3, from the values obtained for IIN (by method C only) and cell volume for each species.
Statistical Analysis
The results related were analysed by one-way analysis of variance (ANOVA) with a significance level
µ = 0.05 (Zar, 1996) followed, where applicable, with a Tukey’s multiple comparison test. In some cases, Student’s t-test was used instead of ANOVA when comparing the treatments for each variable.
RESULTS
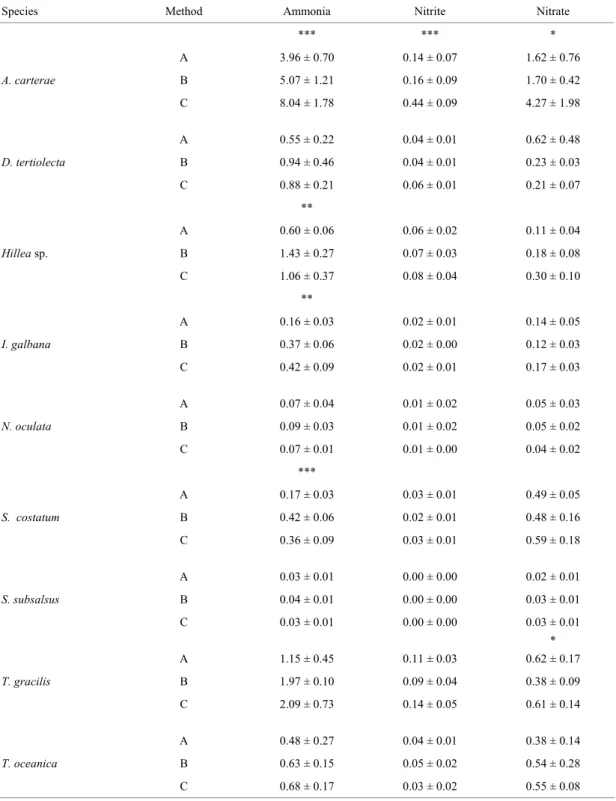
The species studied show great differences in the internal concentrations of nitrate, nitrite and ammonia. For all the species ammonia and nitrate occurred in higher concentrations, while nitrite was always present in low concentrations (Table 1). Independent by of the method used for extracting the IIN content, all the species except S. costatum showed ammonia to be the most important IIN component, followed by nitrate.
Figure 1 shows the concentrations of IIN extracted from the nine species by the three
different methods. For six of the species significant differences were found among the methods tested. A. carterae showed higher concentrations of total IIN when extracted by method C (p < 0.001). Hillea sp., I. galbana, S. costatum, S. subsalsus, and T. gracilis showed equal concentrations of total IIN by methods B and C (p ≥ 0.16), which gave higher values than method A (0.007 ≤ p < 0.05). For none of the other three species (D. tertiolecta, N. oculata and T. oceanica) was any difference found among methods, for total IIN (Fig. 1). Some differences in the individual concentrations of ammonia, nitrite and nitrate were found for most of the species (Table 1).
Cell surface and cell volumes are shown in Table 2. From these data the ratio surface : volume was calculated for each species and large differences were found among them. The largest surface : volume ratio was found in S. subsalsus (5.25) and the lowest in T. gracilis (0.85). These two species were the same as those which showed the highest (S. subsalsus, 66.6 fg / µm3) and the lowest values (T. gracilis, 3.72 fg / µm3) for relative concentrations of IIN in cells (Fig. 2).
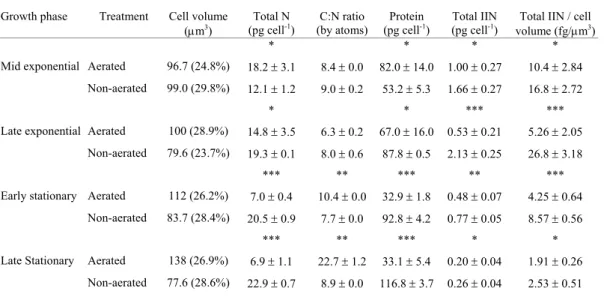
The growth of S. costatum and T. gracilis in aerated experiments gave higher final cell yield, and complete consumption of nitrogen from the medium by the end of the exponential growth phase (Figs 3A,B). In non-aerated cultures concentrations of dissolved nitrogen in the medium remained high until on throughout the experiments (Fig. 3A,B). Both species showed values for total nitrogen and protein progressively lower during growth in aerated cultures, while a contrary trend was found in non-aerated cultures (Tables 3 and 4). Small variations in C:N ratio occurred in non-aerated cultures, while values increased from the exponential to the stationary growth phase in the aerated cultures. Concentrations of total IIN and IIN / µm3 were similar in the exponential growth phase of T. gracilis in both treatments (p > 0.17), but differences were found for S. costatum (p < 0.02) in the same growth phase. In the stationary growth phase, total IIN and IIN / µm3 tended to be greater in the non-aerated cultures of both species (Tables 3 and 4).
D
ISCUSSIONBudgets of Intracellular Inorganic Nitrogen
Table 1. Concentrations of ammonia, nitrite and nitrate extracted from nine species of marine microalgae by three methods: A - Thoresen et al. (1982); B - Lourenço et al. (1998); C - present study. Values are expressed as picograms cell-1 and represent the
mean of 5 replicates ± SD (n = 5)#.
Species Method Ammonia Nitrite Nitrate
*** *** *
A 3.96 ± 0.70 0.14 ± 0.07 1.62 ± 0.76
A. carterae B 5.07 ± 1.21 0.16 ± 0.09 1.70 ± 0.42
C 8.04 ± 1.78 0.44 ± 0.09 4.27 ± 1.98
A 0.55 ± 0.22 0.04 ± 0.01 0.62 ± 0.48
D. tertiolecta B 0.94 ± 0.46 0.04 ± 0.01 0.23 ± 0.03
C 0.88 ± 0.21 0.06 ± 0.01 0.21 ± 0.07
**
A 0.60 ± 0.06 0.06 ± 0.02 0.11 ± 0.04
Hillea sp. B 1.43 ± 0.27 0.07 ± 0.03 0.18 ± 0.08
C 1.06 ± 0.37 0.08 ± 0.04 0.30 ± 0.10
**
A 0.16 ± 0.03 0.02 ± 0.01 0.14 ± 0.05
I. galbana B 0.37 ± 0.06 0.02 ± 0.00 0.12 ± 0.03
C 0.42 ± 0.09 0.02 ± 0.01 0.17 ± 0.03
A 0.07 ± 0.04 0.01 ± 0.02 0.05 ± 0.03
N. oculata B 0.09 ± 0.03 0.01 ± 0.02 0.05 ± 0.02
C 0.07 ± 0.01 0.01 ± 0.00 0.04 ± 0.02
***
A 0.17 ± 0.03 0.03 ± 0.01 0.49 ± 0.05
S. costatum B 0.42 ± 0.06 0.02 ± 0.01 0.48 ± 0.16
C 0.36 ± 0.09 0.03 ± 0.01 0.59 ± 0.18
A 0.03 ± 0.01 0.00 ± 0.00 0.02 ± 0.01
S. subsalsus B 0.04 ± 0.01 0.00 ± 0.00 0.03 ± 0.01
C 0.03 ± 0.01 0.00 ± 0.00 0.03 ± 0.01
*
A 1.15 ± 0.45 0.11 ± 0.03 0.62 ± 0.17
T. gracilis B 1.97 ± 0.10 0.09 ± 0.04 0.38 ± 0.09
C 2.09 ± 0.73 0.14 ± 0.05 0.61 ± 0.14
A 0.48 ± 0.27 0.04 ± 0.01 0.38 ± 0.14
T. oceanica B 0.63 ± 0.15 0.05 ± 0.02 0.54 ± 0.28
C 0.68 ± 0.17 0.03 ± 0.02 0.55 ± 0.08
Fig. 1. Total IIN (ammonia + nitrate + nitrite) extracted from nine species of marine microalgae by three methods: A (□), Thoresen et al. (1982); B (●), Lourenço et al. (1998); C (∆), present study. Horizontal dotted line represents the mean of 5
replicates, symbols indicate the actual values measured (replicates) and vertical line represents standard deviation. Asterisk indicates significant differences among mean values: * p < 0.05; ** p < 0.01; *** p < 0.001.
A. carterae ***
0 4 8 12 16
T
o
ta
l
II
N
(p
g
c
e
ll
-1)
D. tertiolecta
0.0 0.5 1.0 1.5 2.0
Hillea sp. **
0.0 0.5 1.0 1.5 2.0
I. galbana *
0.00 0.25 0.50 0.75 1.00
T
o
ta
l
II
N
(
p
g
c
e
ll
-1)
N. oculata
0.00 0.06 0.12 0.18
S. costatum *
0.0 0.4 0.8 1.2
S. subsalsus *
0.00 0.03 0.06 0.09
T
o
ta
l
II
N
(
p
g
c
e
ll
-1)
T. gracilis*
0 1 2 3 4 5
T. oceanica
0.0 0.6 1.2 1.8
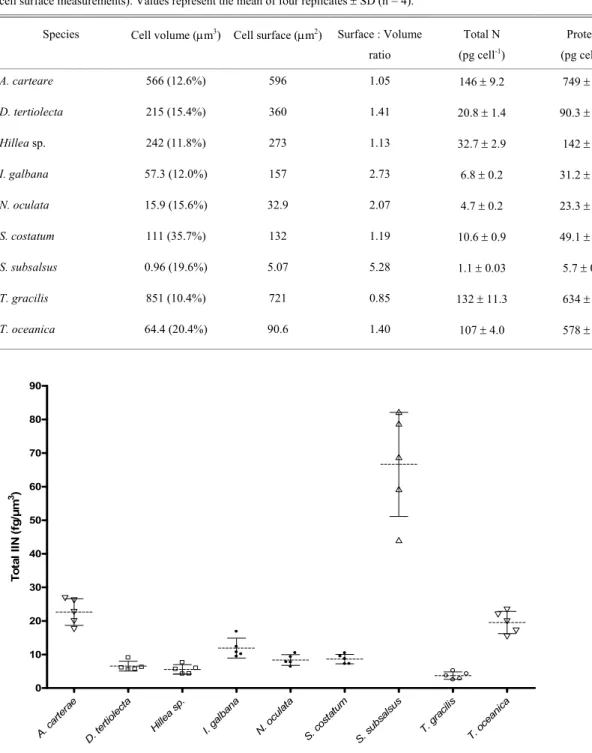
Table 2. Mean values for cell volumes, cell surfaces, and total N of nine marine microalgae in independent experiments. Values in brackets in the second column represent the coefficient of variation of measurements of the cell volumes (same values for cell surface measurements). Values represent the mean of four replicates ± SD (n = 4).
Species Cell volume (µm3) Cell surface (µm2) Surface : Volume
ratio
Total N
(pg cell-1)
Protein
(pg cell-1)
A. carteare 566 (12.6%) 596 1.05 146 ± 9.2 749 ± 47
D. tertiolecta 215 (15.4%) 360 1.41 20.8 ± 1.4 90.3 ± 6.1
Hillea sp. 242 (11.8%) 273 1.13 32.7 ± 2.9 142 ± 12
I. galbana 57.3 (12.0%) 157 2.73 6.8 ± 0.2 31.2 ± 0.9
N. oculata 15.9 (15.6%) 32.9 2.07 4.7 ± 0.2 23.3 ± 1.0
S. costatum 111 (35.7%) 132 1.19 10.6 ± 0.9 49.1 ± 4.2
S. subsalsus 0.96 (19.6%) 5.07 5.28 1.1 ± 0.03 5.7 ± 0.2
T. gracilis 851 (10.4%) 721 0.85 132 ± 11.3 634 ± 54
T. oceanica 64.4 (20.4%) 90.6 1.40 107 ± 4.0 578 ± 22
Fig. 2. Relative accumulation of IIN by nine species of marine microalgae. Each horizontal dotted line represents the mean of 5 replicates, symbols indicate the actual values measured (replicates) and vertical line represents standard deviation. The same pattern of symbol (squares, triangles, spheres) indicates species which mean values are not significantly different. All samples were collected in the exponential growth phase.
A. ca
rtera
e
D. t
ertio
lect
a
Hill
ea s
p.
I. ga
lban
a
N. o
cula
ta
S. c
osta
tum
S. s
ubsa
lsus
T. g
raci
lis
T. o
cean
ica
0 10 20 30 40 50 60 70 80 90
T
o
ta
l
II
N
(fg
/µ
m
0 200 400 600 800 1000
0 3 6 9
D
is
s
o
lv
e
d
N
i
n
t
h
e
m
e
d
iu
m
(
µ
M)
10000 100000 1000000 10000000
C
e
ll
s
m
l
-1
0 200 400 600 800 1000
0 3 6 9 12
Time (days)
D
is
s
o
lv
e
d
N
i
n
t
h
e
m
e
d
iu
m
(
µ
M
)
10000 100000 1000000 10000000
C
e
ll
s
m
l
-1
Dissolved N in cultures with aeration Dissolved N in cultures without aeration Growth curve of cultures with aeration Growth curve of cultures without aeration
Table 3. Total IIN, relative IIN, protein, total N and C:N ratio of S. costatum cultured with and without aeration in different growth phases. In the third column values in brackets represent the coefficient of variation of measurements of cell volumes (same values for cell surface measurements). Values represent the mean of four replicates ± SD (n = 4)#.
Growth phase Treatment Cell volume (µm3)
Total N
(pg cell-1) (by atoms) C:N ratio (pg cellProtein -1) (pg cellTotal IIN -1) Total IIN / cell
volume (fg/µm3)
* * * *
Mid exponential Aerated 96.7 (24.8%) 18.2 ± 3.1 8.4 ± 0.0 82.0 ± 14.0 1.00 ± 0.27 10.4 ± 2.84
Non-aerated 99.0 (29.8%) 12.1 ± 1.2 9.0 ± 0.2 53.2 ± 5.3 1.66 ± 0.27 16.8 ± 2.72
* * *** ***
Late exponential Aerated 100 (28.9%) 14.8 ± 3.5 6.3 ± 0.2 67.0 ± 16.0 0.53 ± 0.21 5.26 ± 2.05
Non-aerated 79.6 (23.7%) 19.3 ± 0.1 8.0 ± 0.6 87.8 ± 0.5 2.13 ± 0.25 26.8 ± 3.18
*** ** *** ** ***
Early stationary Aerated 112 (26.2%) 7.0 ± 0.4 10.4 ± 0.0 32.9 ± 1.8 0.48 ± 0.07 4.25 ± 0.64
Non-aerated 83.7 (28.4%) 20.5 ± 0.9 7.7 ± 0.0 92.8 ± 4.2 0.77 ± 0.05 8.57 ± 0.56
*** ** *** * *
Late Stationary Aerated 138 (26.9%) 6.9 ± 1.1 22.7 ± 1.2 33.1 ± 5.4 0.20 ± 0.04 1.91 ± 0.26
Non-aerated 77.6 (28.6%) 22.9 ± 0.7 8.9 ± 0.0 116.8 ± 3.7 0.26 ± 0.04 2.53 ± 0.51
# Asterisks indicate significant differences between mean values: * p < 0.05; ** p < 0.01; *** p < 0.001.
Table 4. Total IIN, relative IIN, protein, total N and C:N ratio of T. gracilis cultured with and without aeration in different growth phases. In the third column values in brackets represent the coefficient of variation of measurements of cell volumes (same values for cell surface measurements). Values represent the mean of four replicates ± SD (n = 4)#.
Growth phase Treatment Cell volume (µm3)
Total N (pg cell-1)
C:N ratio (by atoms)
Protein (pg cell-1)
Total IIN (pg cell-1)
Total IIN / cell volume (fg/µm3)
Mid exponential Aerated 898 (10.9%) 59.7 ± 18.1 5.7 ± 0.2 280 ± 85 6.5 ± 3.2 7.59 ± 3.84
Non-aerated 853 (10.2%) 24.8 ± 2.1 7.6 ± 0.4 108 ± 9.2 6.7 ± 0.3 7.40 ± 2.26
*
Late exponential Aerated 759 (9.83%) 40.0 ± 4.3 6.6 ± 0.0 199 ± 21 0.6 ± 0.1 0.94 ± 0.12
Non-aerated 692 (10.0%) 37.2 ± 1.3 7.8 ± 0.4 177 ± 6.1 2.1 ± 0.6 3.00 ± 0.91
** *
Early stationary Aerated 842 (12.8%) 41.1 ± 3.0 8.0 ± 0.3 206 ± 15 0.6 ± 0.1 0.74 ± 0.18
Non-aerated 674 (8.59%) 39.2 ± 3.5 7.9 ± 0.3 200 ± 18 1.8 ± 0.2 3.04 ± 0.72
** *** ** *
Late stationary Aerated 804 (14.9%) 31.8 ± 2.6 12.6 ± 0.7 165 ± 13 0.7 ± 0.2 2.15 ± 0.52
Not aerated 590 (15.0%) 40.8 ± 1.9 8.0 ± 0.0 207 ± 9.8 1.8 ± 0.2 3.30 ± 0.58
other of studies is limited. In most studies, such as those of Dortch (1982) and Lomas & Glibert (1999), the culture conditions and species tested are different, with a remarkable resulting influence on the accumulation of IIN. Lourenço et al. (1998) found that most of the species tested showed nitrate as the main IIN source, although some species (C. minutissima, P. minimum, S. costatum, S. subsalsus, and T. gracilis) showed ammonia as the main IIN component in part of the samples. Our results agree with those of Lomas & Glibert (2000), in whose study 3 out of 5 species (Chaetoceros sp., D. tertiolecta and Pavlova lutheri) showed ammonia as the main IIN source. In a study with 12 species of phytoplankton, Lourenço et al. (2004) found that 4 species (Chlorella minutissima, Phaeodactylum tricornutum, Synechococcus subsalsus, and Tetraselmis gracilis) gave ammonia as the main IIN source.
An important factor affecting the budget of ammonia, nitrate and nitrite within cells is the activity of the enzymatic apparatus for the reduction of nitrogen. As a consequence, the time of sampling may represent a significant factor for the concentrations of IIN found. The activity of nitrate reductase has been studied in several autotrophic organisms, with different circadian rhythms (Asano et al., 1995; Ramalho et al., 1995). Some chlorophyte algae and higher plants present a maximum activity of nitrate reductase to occur close to the middle of the light period, maintaining low and constant levels of activity in the dark period. More complex patterns have been described for some chromophyte algae, in which the nitrate reductase activity increases 4 hours after the beginning of the dark period (Vergara et al., 1998). According to Berges et al. (1995) the activity of nitrate reductase in Thalassiosira pseudanana shows two peaks, one of them in the middle of the light period and the second close to the end of the dark period. Vergara et al. (1998) found that the nitrate reductase of Thalassiosira weissflogii shows a pattern not controlled by circadian rhythms, without any foreseeable peaks of activity in frequency on intensity. In this context the occurrence of high concentrations of ammonia might suggest that the rates of reduction of nitrate to nitrite, and then to ammonia might be faster than the rate of absorption of ammonia by organic matter. As a consequence, ammonia might accumulate in the cells in high concentrations.
Comparison of Methods for Extracting INN
Results from the comparison of the three methods were obtained by the use of independent experiments, carried out at different times. This procedure greatly reduces the effect of any possible contamination of samples, especially in ammonia
analysis but on the other hand, it increases the dispersion of the results. The evaluation of Fig. 1 indicates that the IIN measurements resulting from the use of method A tend to be lower. No species showed higher values for IIN when analysed by method A. On the other hand the results obtained by methods B and C are closely similar (differences were found only for A. carterae). Both of these latter methods seem to yield a better extraction of IIN and should therefore be used instead of method A. Method C involves the complete destruction of the filters containing the samples. This additional step constitutes the main difference from procedure B, since both methods have many steps in common. However, the destruction of the samples with a potter device does not seem to improve the extraction of IIN, and method B is more practical.
The better extraction of IIN by both methods B and C is probably related to the combination of different principles adopted (osmotic shock, heating and flux of water through the samples). The use of hot water only (method A) seems to be inadequate to achieve complete extraction of IIN from the samples, depending on the species. For D. tertiolecta, N. oculata and T. oceanica the results obtained by the three methods were the same, and this fact may suggest that these species could be easily extracted by any method. The differences found for the other species seem to indicate the varying degrees of efficiency to be achieved by using the different procedures. Differences in cell wall composition and in the concentration of the inorganic nitrogen pools are probably the main factors affecting the efficiency of the extraction.
The new method for the extraction of inorganic nitrogen pools from marine microalgae in cultures is efficient and can be used for all species. However, it does not seem to achieve better extraction than method B, which is easier and quicker to perform. The extraction of IIN using hot distilled water alone should be avoided, since the resulting extraction of inorganic nitrogen is incomplete for some species.
Comparison of the Relative Accumulation of IIN by Microalgae
The accumulation of intracellular ammonia, nitrate and nitrite represents a characteristic of all phytoplankton species, both in the natural environment and in cultures. According to Hein et al. (1995), the high procurement of nitrogen by phytoplankton, more than in other primary producers such as seaweeds, is determined by two biochemical parameters: high Vmax
(maximum rate of uptake of the element) and low Km
high surface: volume ratio presented by phytoplankton, which varies greatly among species, but is always higher than that presented by fast-growing seaweeds (Pedersen & Borum, 1996).
The existence of an efficient biochemical apparatus to absorb nitrogen is also very important and represents a competitive advantage, especially in oligotrophic environments. As long as the assimilation of nitrogen is in complete, transient pools of inorganic nitrogen build up whithin the cells. The duration and the concentration of the intracellular inorganic pools are influenced by the external concentrations of the ions, as well as by the rate of uptake and assimilation of nitrogen (Berges, 1997).
The relative concentrations of IIN (fg / µm3) agree with the surface: volume data for most of the species studied. S. subsalsus shows extremely high concentrations of IIN per µm3 (66.7 fg), three times higher than that for the second species, the dinoflagellate A. carteare (22.1 fg). The cyanobacterium possesses the largest surface: volume ratio among the microalgae tested, and thus a relatively greater interface with the external medium. This physical characteristic may represent an important advantage over larger species in the competition for dissolved nutrients, especially in the presence of low nutrient concentrations (Hein et al., 1995; Ning et al., 2000). We also hypothesise that S. subsalsus probably has an efficient biochemical apparatus to uptake nitrate and assimilate inorganic nitrogen. However, this same interpretation does not seem to apply to N. oculata, the second smallest species in cell volume and the third largest in surface : volume ratio. Values obtained for N. oculata (8.05 ± 1.62 fg / µm3) are statistically equal to those for S. costatum (8.65 ± 1.41 fg / µm3), a species which presents a cell volume 8.7 times greater. The results obtained for S. costatum seem to suggest that some phytoplankton species with low surface : volume ratios might compensate for the relative by smaller surface of exchange with a more efficient ability to take up and assimilate inorganic nitrogen. Villareal & Lipschultz (1995) showed that large-volume microalgae (Ethmodiscus spp., Halosphaera spp., and Pyrocystis noctiluca) are able to compete efficiently for dissolved nutrients with smaller species in the oligotrophic waters of the Sargasso Sea, accumulating high concentrations of intracellular nitrate. This behaviour is a consequence of their great capability to absord take up dissolved nutrients, and the great efficiency of the enzymatic apparatus involved in the nitrogen metabolism. According to this interpretation, species of medium cell volumes such as I. galbana (57.3µm3), S. costatum (111 µm3) and T. oceanica (64.4 µm3), and large cell volumes such as A. carterae (567 µm3) might present a more efficient biochemical
apparatus for the absorption of nitrogen than N. oculata (mean cell volume = 15.9). In this context, A. carterae might be the species which presents the most efficient mechanisms for nitrogen uptake, since it is the second largest species both in cell volume and in relative accumulation of IIN.
The species tested show remarkable differences in the accumulation of IIN, and for most of them higher concentrations of IIN are directly related to high surface: volume ratio. For some species the accumulation of high concentrations of IIN is not adequately accounted for by the surface : volume ratio, and other factors not studied here (e.g. enzymatic activity) may be more influential.
Variations of Total Nitrogen and IIN in Aerated and Non-aerated Cultures
The growth responses of S. costatum and T. gracils showed large differences between the final cell yields obtained in aerated and non-aerated experiments. Both species showed higher cell densities in the stationary phase when cultured with aeration (and thus absorving none CO2). Nitrogen uptake and
assimilation is faster when carbon is not limiting, and growth is stimulated (Fábregas et al., 1995; Huertas et al., 2000). We assume that the lack of a carbon source may have limited the growth of both microalgae in a similar way in the non-aerated experiments. According to Burkhardt et al. (1999), minor variations in C:N ratio occur when growth rates are constant. Our results indicate that aerated cultures were limited by nitrogen during growth and showed wide C:N variations as between the exponential and the stationary phases. In aerated cultures a constant input of carbon was obtained by dissolving more CO2 from the air.
Considering the coupling of C and N metabolism, as demonstrated by Turpin (1991), the availability of carbon should speed up the assimilation of nitrogen, supplying carbon cells for amino acid synthesis. As a consequence, aerated cultures ran out of nitrogen in the stationary phase. The faster assimilation of nitrogen, associate with the greater availability of carbon, is probably the main factor in determining higher final cell yield in the aerated cultures (Fig. 3). On the other hand, cultures without aeration had lower growth rates and were carbon-limited in the stationary growth phase, since the diffusion of CO2 from the air
to the cultures occurs at very low rates, not fast enough to sustain rapid growth. With low growth rates, the consumption of nutrients tends to be slow, and biochemical composition and the C:N ratios of the microalgae without aeration changed but little during growth.
the progressively lower availability of N in the culture medium. On the other hand, the increase in cell volume during growth in aerated cultures probably results from the accumulation of non-nitrogenaceous substances, such as carbohydrates and lipids, since dissolved nitrogen was quickly consumed and no carbon limitation was recorded. The production of protein is favoured during periods of nitrogen sufficiency, with limited carbohydrate synthesis; conversely, during periods of reduced nitrogen availability, carbohydrate and lipids accumulate and protein production drops (Lourenço et al., 1997).
The insufficiency in carbon supply can also be evaluated by a decrease in cell volume during growth, according to Montagnes et al. (1994) and Burkhardt et al. (1999). This trend was confirmed in our non-aerated cultures of S. costatum and T. gracilis. On the other hand, the increase of total N and protein per cell in non-aerated experiments seems to result from slower growth rates and permanent sufficiency of N during growth.
During the exponential growth phase the use of aeration did not affect the accumulation of IIN by T. gracilis, since this microalga showed similar values of IIN per cell in either treatment. The accumulation of high concentrations of IIN in the exponential phase reflects the rapid nitrogen uptake in the first days of growth, when no limiting factor is affecting the cultures, whether or not aeration was used. With the increase of the cell density in the cultures, the dissolved carbon in the medium tends to become exhausted in experiments without aeration, since the diffusion of CO2 from the air is not enough to sustain
the growth of cells at high rates. As a consequence, nitrogen is not assimilated rapidly. In the experiments with aeration carbon was supplied continuously, making the nitrogen uptake and assimilation for the synthesis of amino acids and other nitrogenaceous organic substances faster (Turpin, 1991; Maurin & Le Gal, 1997). Thus, IIN pools tend to be consumed more quichly. The accumulation of IIN by S. costatum seems to be greatly affected by the kind of treatment tested, since differences in total and relative concentrations of IIN were found in all comparisons.
An imbalance was also detected in our experiments as between the up take and assimilation of nitrogen. High concentrations of nitrite may be built up and excretion of this ion may occur thus preventing any toxic effect, as demonstrated by Lourenço et al. (1997) for nitrogen-rich cultures of Tetraselmis gracilis. Lomas et al. (2000) also reported the release of ammonia and nitrite in nitrogen sufficient cultures of some diatoms and flagellates as a response to rapid increases in irradiance. For instance, concentrations of nitrite in the culture medium of our non-aerated experiments with T. gracilis increased from the exponential (7.9 µM) to the stationary growth phase
(30.8 µM). In aerated cultures dissolved concentrations of nitrite were low and decreased during growth. This behaviour results from the reduction of nitrate to nitrite by nitrate reductase activity, not followed by further reduction to ammonia by nitrite reductase (Berges, 1997).
The decrease of intracellular inorganic nitrogen concentrations during growth results from the assimilatory process. The concentration of the IIN pool dropped when N availability diminished, confirming its physiological role as a nitrogen reserve (Dortch et al., 1984). Our data shows that the relative importance of IIN in the cellular nitrogen budget declines progressively during growth. As a consequence, one would expect a decrease in the IIN: TN ratio. Thus, the availability of carbon plays a key role in the accumulation of IIN. Cultures with high availability of carbon tend to accumulate relatively lower concentrations of IIN, and the available nitrogen is assimilated more rapidly by the organic matter. In some cases large intracellular inorganic pools of nitrogen represent a response to a carbon deficiency.
A
CKNOWLEDGEMENTSWe are indebted to the Foundation for Research Support of Rio de Janeiro State (FAPERJ) for the financial support given for this study. We wish to thank Luzia E. Narimatsu B.Sc. and Adriana Nascimento B.Sc. (Universidade de São Paulo), as well as Elisabete Barbarino M.Sc. (Universidade Federal Fluminense) for their respective assistance in CHN analysis and the cultivation of microalgae. We would also thank Dr. Carlos L. de Oliveira, Dr. Emmanoel V. da Silva-Filho, Dr. Roberto Paes de Carvalho, Dr. Tereza Q. Santos, and Joel C. De-Paula M.Sc. for permitting the authors’ use of their laboratory facilities. S.O.L. also acknowledges the individual research fellowships provided for him by FAPERJ and National Council for the Development of Science and Technology (CNPq).
REFERENCES
Aminot, A. & Chaussepied, M. 1983. Manuel des analyses chimiques en milieu marin. Brest, CNEXO. 395p. Asano, C. S.; Colepicolo, P. & Aidar, E. 1995. Nitrate
reductase activity in the diatom Biddulphia longicruris: characterization and daily oscillation. Bolm Inst. oceanogr., S Paulo, 43:123-128.
Berges, J. A. 1997. Algal nitrate reductases. Eur. J. Phycol. 32(1):3-8.
Berges, J. A.; Cochlan, W. P. & Harrison, P. J. 1995. Laboratory and field responses of algal nitrate reductase to diel periodicity in irradiance, nitrate exhaustion, and the presence of ammonium. Mar. Ecol. Prog. Ser., 124:259-169.
Burkhardt, S.; Zondervan, I. & Riebesell, U. 1999. Effect of CO2 concentration on C:N:P ratio in marine
Conover, S. A. M. 1975. Partioning of nitrogen and carbon in cultures of the marine diatom Thalasiosira fluviatilis
supplied with nitrate, ammonium or urea. Mar. Biol., 32:231-246.
Dortch, Q. 1982. Effect of growth conditions on accumulation of internal nitrate, ammonium, amino acids, and protein in three marine diatoms. J. expl. mar. Biol. Ecol., 61:243-264.
Dortch, Q. & Conway, H. L. 1984. Interaction between nitrate and ammonium uptake: variation with growth rate, nitrogen source and species. Mar. Biol., 79:151-164.
Dortch, Q.; Clayton, Jr, J. R.; Thoresen, S. S. & Ahmed, S. I. 1984. Species differences in accumulation of nitrogen pools in phytoplankton. Mar. Biol., 81:237-250. Fábregas,J.;Ferrón, L.; Abalde, J.; Cabezas, B. & Otero, A.
1995. Changes in the gross chemical composition of mass cultures of the marine microalgae Dunaliella tertiolecta with different aeration rates. Biores. Technol., 53:185-188.
Geider, R. J. & La Roche, J. 2002. Redfield revisited: variability on C:N:P in marine microalgae and its biochemical basis. Eur. J. Phycol., 37(1):1-17.
Grasshoff, K.; Ehrhrdt, K. & Kremling, K. 1983. Methods of seawater analysis. 2nd ed. Weinheim, Verlag Chemie.
419p.
Guerrero, M. G.; Veja, J. S. & Losada, M. 1981. The assimilatory nitrate-reducing system and its regulation. Ann. Rev. Plant Physiol., 32:169-204.
Guillard, R. R. L. & Ryther, C. B. 1962. Studies of marine planktonic diatoms. I. Cyclotella nana Husted, and
Detonula convervacea (Cleve) Gran. Can. J. Microbiol., 8:229-239.
Hein, M.; Pedersen, M. F. & Sand-Jensen, K. 1995. Size-dependent nitrogen uptake in micro- and macroalgae. Mar. Ecol. Prog. Ser., 118:247-253.
Hillebrand, H.; Dürselen, C.; Kirshtel, D.; Pollingher, U. & Zohary, T. 1999. Biovolume calculation for pelagic and benthic microalgae. J. Phycol., 35:403-424.
Huertas, E.; Montero, O. & Lubián, L. M. 2000. Effects of dissolved inorganic carbon availability on growth, nutrient uptake and chlorophyll fluorescence of two species of marine microalgae. Aquacult. Eng., 22:181-197.
Lee, K.-S. & Dunton, K. H. 1999. Inorganic nitrogen acquisition in the seagrass Thalassia testudinum: Development of whole-plant nitrogen budget. Limnol. Oceanogr., 44:1204-1215.
Lee, R. E. 1999. Phycology. 3a ed. Cambridge, Cambridge
University Press. 614p.
Lobban, C. S. & Harrison, P. J. 1994. Seaweed ecology and physiology. New York, Cambridge University Press. 366p.
Lomas, M. W. & Glibert, P. M. 1999. Interactions between NH4+ and NO3- uptake and assimilation: comparison of
diatoms and dinoflagellates at several growth temperatures. Mar. Biol., 133:541-551.
Lomas, M. W. & Glibert, P. M. 2000. Comparisons of nitrate uptake, storage, and reduction in marine diatoms and dinoflagellates. J. Phycol., 36:903-913.
Lomas, M. W.; Rumbley, C. J. & Glibert, P. M. 2000. Ammonium release by nitrogen sufficient diatoms in response to rapid increases in irradiance. J. Plankt. Res., 22(12):2351-2366.
Lourenço, S. O.; Barbarino, E.; Lanfer Marquez, U. M. & Aidar, E. 1998. Distribution of intracellular nitrogen in marine microalgae: Basis for the calculation of specific nitrogen-to-protein conversion factors. J. Phycol., 34(5):798-811.
Lourenço, S. O.; Barbarino, E.; Lavín, P. L.; Lanfer Marquez, U. M. & Aidar, E. 2004. Distribution of intracellular nitrogen in marine microalgae. Calculation of new nitrogen-to-protein conversion factors. Eur. J. Phycol., 39(1):17-32.
Lourenço, S. O.; Lanfer Marquez, U. M.; Mancini-Filho, J.; Barbarino, E. & Aidar, E. 1998. Changes in biochemical profile of Tetraselmis gracilis I. Comparison of two culture media. Aquaculture, 148(2-3):153-168.
Maurin, C. & Le Gal, Y. 1997. Glutamine synthetase in the marine coccolithophorid Emiliania huxleyi
(Prymnesiophyceae): regulation of activity in relation to light and nitrogen availability. Plant Sci.,122:61-69. Montagnes, D. J. S.; Berges, J. A.; Harrison, P. J. & Taylor,
F. J. R. 1994. Estimating carbon, nitrogen, protein, and chlorophyll a from volume in marine phytoplankton. Limnol. Oceanogr., 39(5):1044-1060.
Naldi, M. & Weeler, P. A. 1999. Changes in nitrogen pools in
Ulva fenestrata (Chlorophyta) and Gracilaria pacifica
(Rhodophyta) under nitrate and ammonium enrichment. J. Phycol., 35(1):70-77.
Ning, X.; Cloern, J. E. & Cole, B. E. 2000. Spatial and temporal variability of picocyanobacteria Synechococcus
sp. in San Francisco Bay. Limmol. Oceanogr., 45(3):695-702.
Pedersen, M. F. & Borum, J. 1996. Nutrient control of algal growth in estuarine waters. Nutrient limitation and the importance of nitrogen requirements and nitrogen storage among phytoplankton and species of macroalgae. Mar. Ecol. Prog. Ser., 142:261-272.
Ramalho, C. B.; Hastings, J. W. & Colepicolo, P. 1995. Circadian oscillation of reductase activity in Gonyaulax polyedra is due to changes in cellular protein levels. Plant Physiol., 107:225-231.
Smayda, T. J. 1978. From phytoplankters to biomass. In: Sournia, A. ed. Phytoplankton manual. Paris, Museum National d'Histoire Naturalle. p. 273-277.
Strickland, J. D. H. & Parson, T. R. 1968. A practical handbook of seawater analysis. Bull. Fish. Res. Bd Can., 167:1-311.
Thoresen, S. S. D.; Dortch, Q. & Ahmed, S. I. 1982. Comparison of methods for extracting intracellular pools of inorganic nitrogen from marine phytoplankton. J. Plankt. Res., 4:695-704.
Turpin, D. H. 1991. Effects of inorganic N availability on algal photosynthesis and carbon metabolism. J. Phycol., 27:14-20.
Vergara, J. J.; Berges, J. A. & Falkowski, P. G. 1998. Diel periodicity of nitrate reductase activity and protein levels in the marine diatom Thalassiosira weissflogii
(Bacillariophyceae). J. Phycol., 34(6):952-961.
Villareal, T. A. & Lipschultz, F. 1995. Internal nitrate concentrations in single cells of large phytoplankton from the Sargasso Sea. J. Phycol., 31:689-696.
Zar, J. H. 1996. Biostatistical analysis. 3rd ed. Upper Saddle
River, Prentice Hall, Inc., 920p.