Buff Pm Am Heaffh Organ 18(Z), 1984.
BREAST-FEEDING,
WEIGHT
GAINS, DIARRHEA,
AND
MALNUTRITION
IN THE FIRST YEAR OF LIFE1
Ilse L6pez Bravo, 2 Carmen Cabiol,3 Sara Arcuch,3
Eliana Rivera,
and Sergio Vargasz
To examine the hypothesis that breart-feeding promotes infant growth while helping to prevent diarrhea1 disease and malnutrition, a study war conducted on 207 Chilean infants who were born at the San Francisco de Borja Hospitul in Santiago and who were periodically examined at a local health center. This ar- ticle reports the re.sulti of that study.
Introduction
Despite lack of agreement among specialists as to the ideal length of the breast-feeding pe- riod, it seems clear that most Chilean mothers have tended to keep that period very short. Various studies demonstrate ‘the point. For example, a 1968 study of 600 infants seen at both urban and rural health centers of the Northern Santiago Health Area reported that by two months of age 50% of these infants were already being fed breast-milk substitutes
(1). Another study, conducted between Sep- tember 1975 and August 1976, found that only half of a group of study subjects (1,050 infants from various social strata) were being breast-fed for three months (2).
It has been asserted that in Chile, as in other Latin American countries, one of the foremost causes of malnutrition is the brevity and insufficiency of breast-feeding (1). This assertion gives emphasis to the need for en- couragement and prolongation of breast-feed- ing-not only to avert nutritional deficiency, but also to reduce the infections that often oc- cur as a consequence of malnutrition.
IA slightly condensed version of this article was prevl- ously published in Spanish in the B&in de la Ofictna Sam- . - toria Pannmencana 95(3),271-281, 1983
2School ofPublic Health, Faculty ot Medicme, Unwer- sit
t; Department of Maternal and Child Health, School of of Chile, Santmgo, Chde. Medical Sciences, Faculty of Medicine, University of Chile, Santiago, Chile.
If we use available information to postulate that breast milk helps an infant to grow (in- crease in weight and length) and reduces mor- bidity from diarrhea and malnutrition during its first year of life, then we should expect that breast-fed infants observed from month to month would show greater average gains in weight and length, would tend to have fewer diarrhea episodes, and would experience a lower rate of malnutrition than infants fed breast-milk substitutes.
Materials and
Methods
For purposes of testing this hypothesis we selected 207 infants born within the popula- tion assigned to the Nogales Health Center for primary care serving the Central Santiago Health Area. All of these infants were born between 29 April 1975 and 8 October 1976, and all were registered at the Nogales Center within their first 20 days of life.
In order to avoid interference from vari- ables other than those being studied, certain selection criteria were adopted. These criteria were as follows:
1) For the study infants:
a) a birth-weight of at least 2,500 g; b) normal delivery;
c) an Apgar score of at least eight;
d) no serious illness in the first seven days of
life; and
e) no hospitalization after the initial dis- charge;
152 PAHO BULLETIN l vol. 18, no. 2, 1984
2) For the infants’ mothers:
a) normal pregnancy lasting at least 38 weeks; and
b) no presentation of any important disease condition such as diabetes, syphilis, jaun- dice, preeclampsia, or Rh incompatibility.
These criteria were applied to each infant that came to be registered for health ,monitor- ing purposes at the Nogales Center and that had been delivered at the San Francisco de Borja Hospital-the facility attended by 90% of the mothers receiving prenatal care at the Nogales Center. In each case, the relevant in- formation was obtained from the birth card.
Before initiation of the study, meetings were held with the maternal health personnel involved in order to ensure uniform criteria- with regard to both recording of relevant data and measurement of the infant’s weight and length. All the study infants being normal newborns, these measurements were per- formed with adequate techniques upon which the team of maternal health personnel agreed. In addition, a system for obtaining and recording data was established at the Nogales Center that ensured the reliability and accura- cy of the data. This included establishment of measurement criteria, uniform definitions, and an instrument calibration system, as well as training for the nursing team that was re- sponsible for monitoring the infants’ health and that had agreed to participate in the study.
SO far as the actual selection process was concerned, all the infants who met the afore- mentioned criteria and who were registered at the Nogales Center between 29 August 1975 and 8 October 1976 were included in the study. This resulted in selection of 85 boys and 122 girls. It should be noted, however, that sex was not one of the variables consid- ered, it being supposed that babies of both sexes would receive equal treatment as far as breast-feeding was concerned. Therefore, the observed disproportion in the number of male and female infants selected was one resulting from a natural rather than a planned selection process.
Regarding the gathering of basic data after the selected infants left the hospital, guidelines established by the Chilean Ministry of Health (3) state that infants should be brought in for a checkup once a month during the first six months of life and thereafter in the eighth, tenth, and twelfth months. At each checkup the following data were recorded: the infant’s weight and length, the type of milk being fed at the time of the checkup, feeding changes since the last checkup, and morbid conditions presented since the last checkup. Therefore, in conducting the present study, this information was obtained from the selected infants’ clinical histories and was entered on forms especially designed for the purpose. In addition, the homes of 44% of the study children were vis- ited at the end of the monitoring period in order to obtain socioeconomic information (4) about each child’s family group that would permit socioeconomic characterization of the group.
Results
Basic Characteristics of the Study Group
As already noted, the study subjects includ- ed 85 boys and 122 girls. Regarding birth- weights, 28% of those selected weighed 2,500- 2,990 g at birth, 45.4% weighed 3,000-3,490 g, and 26.6% weighed 3,500-4,190 g. Regarding birth-length data, these were obtained for only
160 of the 207 study infants, the lengths of the other 47 having either not been measured or not registered at the hospital. All the mea- surements recorded fell between 44 and 55cm, with 8.8% of the recorded lengths being in the 44-47 cm range, 74% being in the 48-51cm range, and 16.8% being in the 52-55cm range.
Ldfiez et al. l BREAST-FEEDING AND MALNUTRITION IN CHILE 153
in the highest weight group had birth-lengths between 50 and 53 cm.
Regarding the mothers of the study infants, 17.8% were less than 20 years of age, 56.7% were in the 20-29 year group, 17.8% were in the 30-39 year group, and 7.7% were over 39 years of age. Seventy-eight per cent of the mothers were legally married. Most of the mothers had little education, 15% having had less than four years of school and 65% having had no more than six.
A third of the infants in the study group were first-borns, 22% were second-borns, and 44% were born to mothers who had previous- ly delivered between two and nine children. In a similar vein, one-quarter of the children belonged to small families with fewer than four members, while 44% were living in larger families with six to 17 members.
Eighty-five per cent of the children lived in homes provided with drinking water and sewerage facilities. However, less than half of their families had an adequate number of beds, and in more than a fifth of the families the members slept three or more to a bed. Also, only a third of the families lived in houses that contained more than one room per three family members, and 15% of the homes contained five or more persons per room.
In general, it appeared that while most of the children lived in homes equipped with good drinking-water and excreta disposal fa- cilities, these advantages were offset by a high frequency of overcrowding resulting from small houses, large families, or both. By and large the study children’s families had a socio- economic status that could be characterized as low, the father usually being a casual laborer or unskilled worker.
Preliminary analysis of the collected data showed that there were no significant socio- economic differences capable of greatly in- fluencing the results (in terms of growth, diar- rhea episodes, or malnutrition), either among study infants breast-fed less than four months or among those breast-fed for longer periods. Indeed, positive and negative socioeconomic factors were found in all the families visited;
and after assigning point scores to the afore- mentioned factors relating to the child, the mother, the father, and the home, it was pos- sible to determine that 90% of the study chil- dren’s families could be uniformly categorized as having a socioeconomic status that was low.
Duration of Breast-Feeding
With regard to both the duration and na- ture of breast-feeding, the type of feeding pro- vided for each infant was determined during the month-to-month checkups at the Nogales Center. As indicated in Table 1, fully a fifth of the study infants received artificial milk sub- stitutes during their first month of life, either alone or as a supplement to their mother’s milk. By the third month this proportion had risen to 43 % , by the sixth it had risen to 64%, and by the twelfth it had reached 91% .
The median duration of breast-feeding un- supplemented by artificial milk was three months and three weeks. However, the length of nonexclusive breast-feeding (both unsup- plemented and supplemented with artificial substitutes) tended to be considerably greater, the median duration being eight months. These findings coincide with those of other studies using broader sample populations, which indicate that less than 50% of the chil- dren involved received unsupplemented breast-milk beyond four months of age (2).
Birth- Weight and Duration of Breast-Feeding
154 PAHO RULLETIN l vol. 18, no. 2, 1984
Table 1. The percentages of study infants receiving breast-milk, artificial substitutes, or both 15 days after birth and during each month of the first year of life.
% of infants being fed the indicated types of milk
Age Breast-milk
dy
Breast-milk Artificial and artificial substitutes
substitutes OdY
Total No. of study children 15 days
1 month 2 months 3 II 4 I? 5 I> 6 I> 7 13 8 I> 9 I> 10 I’ 11 ” 12 ”
91.8 6.8 1.4 207
79.2 15.0 5.8 207
71.1 18.8 10.1 207
57.0. 27.5 15.5 207
47.4 30.9 21.7 207
42.9 30.9 26.2 207
35.9 27.7 36.4 206
34.5 26.7 38.8 206
26.7 22.3 51.0 206
25.2 20.9 53.9 206
15.5 20.9 63.6 206
14.6 20.9 64.5 206
8.9 15.7 75.4 206
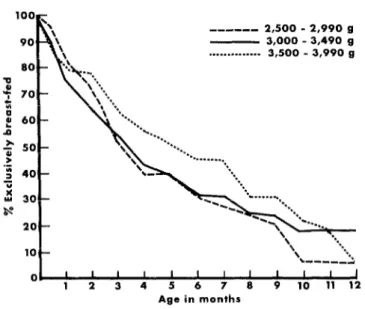
Figure 1. The percentages of infants in each of the indicated birthweight groups that were being exclusively breast-fed
during each month of their first year of life.
--m-m- 2,500 - 2,990 g - 3,000 - 3,490 g . . . ..-...- 3,500 - 3,990 g
0 I II I III1 III 1
1 2 3 4 5 6 7 8 9 10 11 12 Age in months
By and large the pattern of declining breast- ever, in the tenth month the proportion of the feeding for the two lower birthweight groups 2,500-2,990 g group being exclusively breast- was very similar up to the ninth month, when fed fell to 5%) while that of the 3,000-3,490 g about a quarter of the infants in both groups group fell only to 18%.
Lcipez et al. . BREAST-FEEDING AND MALNUTRITION IN CHILE 155
breast-fed infants in the 3,500-3,990 g birth- weight group remained consistently higher than in the other two groups, the proportion exclusively breast-fed being 45% at seven months of age and 30% at nine months of age. However, from the ninth month on the pro- portion dropped rapidly, until it became the same as that found in the lowest-weight group at the end of the first year.
Regarding the median duration of breast- feeding in each birth-weight group, the data in Table 2 show that exclusive breast-feeding had stopped for half the infants in the two lower birth-weight groups by the time they reached three and a half months of age, while half the infants in the heaviest group (3,500- 4,190 g) continued to receive breast-milk alone until they were over five months old. Breast-feeding augmented with artificial sup- plements tended to continue much longer- until around eight months of age for half the infants in all three groups.
Weight Gains
During the first year of life (after the first fortnight) the infants tended consistently to gain weight, although the gains tended to be slower at later ages. The theoretical norms were found by taking each infant group’s average birth-weight and adding weighted in- crements corresponding to Stuart’s P,, (1, 5,
Table 2. The median duration of breast-feeding and mixed feeding among the study infants,
by birthweight group.
Birthweisht group 2,500-2,990 g 3,000-3,490 g 3,500-4,190 $
Medtan duratton of Medmn duramn
of breast-feedmg or III combinatmn wtth brm-kedmg (alone (she) artificial substitutes) 3 months, 7 months, 3 weeks
1 week
3 months, 8 months
2 weeks
5 months, 8 months, 2 weeks
1 week
‘Only five of the 55 children in this group weighed be- tween 4,000 and 4,190 g.
6). Cumulatively, these theoretical increments totaled 600 g at one month, 1,500 g at two months, 2,400 g at three months, 4,200 g at six months, 5,700 g at nine months, and 6,600 g at 12 months (Table 3).
At each month of life, the study infants for whom feeding data were available were classed according to whether they had received artifi- cial milk substitutes up to that time and whether they had stopped receiving breast- milk. The difference between each infant’s weight and its birth-weight was found, the in- fants were grouped according to age (by month) and type of feeding, and average weight gains were computed for each group. In observing these data it should be noted that after the sixth month the data obtained for months 8, 10, and 12 tended to be more valid than those obtained for months 7, 9, and 11, because there were no checkups by routine ap- pointment in the latter odd-numbered months, and so attendance at the Nogales Center in those months was largely condi- tioned by factors that could be regarded as negative-primarily communicable diseases and malnutrition.
A comparison of the average weight gains in the three feeding groups clearly revealed greater weight gains among the breast-fed in- fants. In addition, and in contrast to the in- fants who were not breast-fed, the breast-fed infants exhibited weight gains up to the sev- enth month of life that were superior to the an- ticipated norms.
AS the data in Tables 3 and 4 indicate, the infants fed on breast-milk alone showed aver- age weight gains that not only equaled the desired gains but actually exceeded them sig- nificantly up to the fifth month of age. In the sixth and seventh months the average gains were not so great but remained above expecta- tions. However, from the eighth month on- ward the situation was reversed, with the breast-fed group registering smaller gains, on the average, than those desired.
156 PAHO BULLETIN l vol. 18, no. 2, 1984
Table 3. The average weight gains of infants receiving breast-milk only, a combination of breast-milk and artificial substitutes, and artificial substitutes only, by age in months, showing one
standard deviation and the number of infants in each group.
Average weight gain in grants (showing the standard deviation and the No. of infants involved) among study infants fed as indicated
Cumulative
gain Breast-fed Mixed feeding Artificial feeding Total
Age in expected No. of
months (in grams) xa SD n xa SD n 2 SD n infants
600 779.1 357.9 156 469 436.9 29 515.3 415.7 1,500 1,770.g 535.7 139 1,449.l 622.5 33 1,067.O 506.5 2,400 2,587.6 622.8 109 2,299.l 758.0 53 1,922.3 802.8 3,000 3,314.8 696.6 90 3,040.7 768.0 63 2,634.6 948.9 3,600 3,832.7 798.6 61 3,780.6 860.3 43 3,230.5 1,040.5 4,200 4,282.7 816.8 67 4,235.3 905.0 49 3,810.8 969.7 4,700 4,873.g 966.6 23 4,704.l 295.4 17 4,006.l 1,129.2 5,200 5,145.6 830.6 46 4,987.6 942.5 38 4,651.4 1,133.7 9 5,700 4,875.7 796.7 14 5,248.8 959.8 12 4,792.4 1,336.3 10 6,000 5,773.0 781.8 27 5,470.O 895.5 37 5,464.8 1,268.8 11 6,300 5,907.8 606.5 9 5,559.2 999.0 12 5,247.l 1,325.8 12 6,600 6,386.7 738.1 18 5,813.6 868.5 32 6,031.7 1,228.6
12 197 20 192 26 188 42 195 38 142 68 184 35 75 96 180 45 71 110 174 45 66 149 199 aThe average of the difference between each infant’s birth-weight and its weight at the indicated age.
Table 4. A comparison of the average weight-gains observed in the exclusively breast-fed infants and those expected (Stuart’s P50 ), by month of life.
tobserveda 6.95 5.96 3.14 4.29 2 28 0 83 0.86 -0.44 -1.51 -1.23
n 156 139 109 90 61 67 23 46 27 18
t expected (‘4) 1.66 I66 1.66 1.66 1.67 1.67 1.71 1 68 1.71 1 74 “Student’s f test is used to compare the means of samples when the population variance IS unknown
Table 5. 2 values obtained upon comparing average weight gains of infants receiving breast-milk only, breast-milk plus artificial substitutes, and artificial substitutes only. (These are normal standard values used
to compare the means of samples when the sample sizes are over 30.) Values <>i Z Ior the average weight-gam ddicrence\
hetwecn groups of infants frd wth
2 3 4 5 6 8 10 12
2.45a 4.13a -0.30
5.53a 3.00a 2.32a
4.62= 2.57a 2.04a
4.64a 2.30a 2.41a
3.24a 0.32 2.60a
3.06a 0.29 2.40a
2.64a 0.82 1.62
1.21 1.41 0.02
1 20 2.36a -0.95
L&e2 et al. l BREAST-FEEDING AND MALNUTRITION IN CHILE 157
life infants fed with breast-milk made a sign& cantly greater average weight gain than those fed with artificial substitutes. Though the find- ings from the tenth month onward do not have this level of statistical significance, they do ap- pear to have practical significance.
Breast-feeding alone versus mkedfeeding. Breast- feeding alone also appeared more beneficial, though to a lesser degree, than breast-feeding supplemented by artificial substitutes. Com- parison of infants receiving these different types of feeding (see column 3 of Table 5) revealed average weight gain differences that were statistically significant during the first four months of life. These weight gain differ- ences then became relatively minor in the fifth and sixth months before increasing and be- coming statistically significant again at the twelfth month.
M&d feeding versus bottle-feeding alone. Data for the group fed with a combination ofbreast- milk and artificial substitutes are not easy to correlate reliably with those for the exclusively breast-fed or bottle-fed groups. In this regard, some have expressed the view that introducing the bottle is injurious whether breast-feeding is continued or not. However, the weight-gain findings of this study suggest that mixed feed- ing is not as deleterious as exclusive depen- dence on bottle-feeding, because the average weight gains of children receiving mixed feed- ings were significantly greater in the second through sixth months than those fed on artifi- cial substitutes alone (see column 4 of Table 5). However, the observed weight gain differ- ence at nine months, while noteworthy, was not statistically significant at the 95% conii- dence level (7); and from the ninth to the twelfth months the bottle-fed infants made a greater average weight gain than infants re- ceiving mixed feedings.
Breast-feeding alone, mixed feeding, and bottle- feeding alone. Another view of this matter can be obtained by combining the infants receiv- ing mixed feedings with those receiving breast-milk only and comparing this com- bined group with the group being exclusively
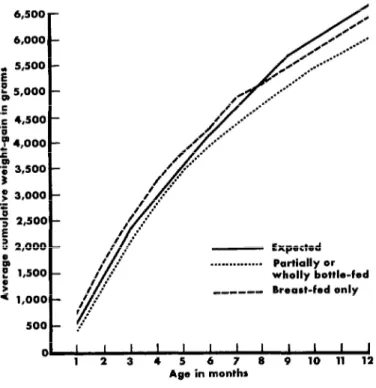
bottle-fed, as is done in Figure 2. This com- parison shows a significant difference between the average weight gain of the two groups up to the eighth month of life, with the breast-fed infants making the greater gain. From the ninth to the eleventh month the difference diminished notably, however, and by the twelfth month it had disappeared.
Similarly, the infants receiving mixed feed- ings can be combined with those being exclu- sively bottle-fed, and this combined group can be compared with the group receiving breast- milk only. This comparison (see Figure 3) shows a notably greater cumulative average weight gain by the exclusively breast-fed group that the bottle-fed group failed to over- come in the first twelve months of life.
Length Gains
Another purpose of our study was to deter- mine whether length gains during the first year of life were favored by breast-feeding. Length measurements do give a fairly accu- rate idea of infant growth. However, length tends to increase less regularly than weight, and a lack of length gain does not mean that growth has stopped.
The “desired’ ’ increase in the study in- fants’ length was 4 cm the first month, 3 cm the second, and 3 cm the third; 2 cm per month in the second quarter, and 1.5 cm per month in the second half-year (6).
158 PAHO BULLETIN . vol. 18, no. 2, 1984
Figure 2. A month-by-month comparison of cumulative average weight-gains by partially or wholly breast-fed infants versus those receiving only artificial substitutes.
The solid line shows the “expected” cumulative average weight gain.
6,500 - 6,000 - c 5,500 -
m -
f 5,000 *E 4,500 & - 2 4,000 -
01 ‘E, 3,500 -
:! .= 3,000 -
a 3
E 2,500 - 5
2,000 - i
; 1,500 - > * 1,000 -
500 -
- Expected ‘--- Partially or
wholly breast-fed . . . Bottle-fed
0
123456789 10 11 12
Age in months
Table 6. Average length-gains by study infants being breast-fed, bottle-fed, or both. Only very limited numbers of study children were measured in some months. Nevertheless, the lack of any significant differences among the three groups leads to the conclusion that the
type of milk fed did not influence length-gains among these study children. Exclusively breast-fed Breast-fed and bottle- Exclusively bottle-fed All study
children fed children children children measured Age in
months
Avg. length No Avg. length No Avg length NO. Avg. length NO. gain measured gain measured gain measured gam measured
(cm) (cm) (cm) (cm)
1 4.25 16 -a 2 -a 1 4.16 19
2 6.78 54 5.89 9 -a 3 6.70 66
3 10.08 59 9.74 19 9.38 8 9.94 86
4 11.58 40 11.50 28 11.50 12 11.54 80
5 14.71 28 14.79 19 14.88 8 14.76 55
6 15.58 38 15.60 25 15.26 31 15.39 94
a 18.32 38 18.09 32 17.89 54 18.07 124
10 20.26 19 20.15 26 21.00 25 20.64 70
12 22.79 14 21.63 24 22.83 95 22.61 133
L&z et al. l BREAST-FEEDING AND MALNUTRITION IN CHILE 159
Figure 3. A month-by-month comparison of cumulative
average weight-gains by partially or wholly bottle-fed
infants versus those receiving breast-milk only. The solid line shows the “expected” cumulative average weight gain.
6,500 - 6,000 -
E 5,500 - $5,000 - E 1; 4,500 -
F4000 - 2 , *$ 3,500 -
3 p 3,000 - ‘Z $ 2,500 -
E ? 2,000 - L e 1,500 - e * 1,000 -
500#-
- Expected . . . partially or
wholly bottle-fed ---mm- Ereart-fed only
123456789 10 11 12
Ago in months
Diarrhea Morbid@
It is generally accepted that diarrheal dis- ease is associated with maternal ignorance or neglect of the rules of hygiene, the quality of the family’s drinking-water, and a variety of environmental factors. Since mother’s milk is ingested directly by the infant, it is not ex- posed to handling that could taint it; and since it contains maternal antibodies, the infant’s ability to cope with infections tends to be enhanced. It is therefore expected that an in- fant whose sole source of nourishment is breast-milk will tend to experience fewer epi- sodes of diarrhea1 disease than will children nourished in other ways (8, 9).
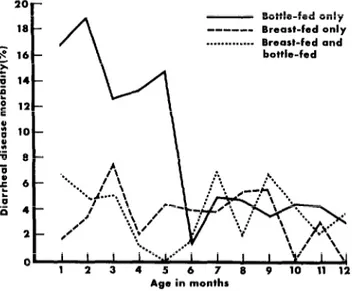
In our own study, marked differences were found between diarrheal disease morbidity in wholly or partly breast-fed children and chil-
dren who were entirely bottle-fed (see Figure 4). Specifically, the rate of diarrhea morbidity in any given month during the first year of life was generally below 8% in both the wholly breast-fed and partly breast-fed groups, while during the first five months of life it ranged from 12.5 to 19% in the solely bottle-fed group. From the sixth month on the diarrhea morbidity in all three groups was comparable, generally averaging below 5% for the three groups combined.
160 PAHO BULLETIN l vol. 18, no. 2, 1984
Figure 4. Diarrheal disease morbidity during the first 12 months of life among study infants who were breast-fed,
bottle-fed, or both.
- Bottle-fed only --- Breast-fed only . . . .._ Breast-fed and
bottle-fed
2or
Age in months
however, mother’s milk appeared to have no influence on diarrheal disease morbidity dur- ing the second half-year of life.
Malnutrition (8,lO)
By comparing the weights of study children that were obtained at checkups during the first 12 months of life with weights in the Sempe Table (3), we found that the percentage of study children classifiable as malnourished in any given month ranged from 3.1 to 10.1% among the exclusively breast-fed group, from 7 .O to 25 .O % among the breast-fed and bottle- fed group, and from 21.7 to 33.3 % among the exclusively bottle-fed group (Table 7).
When the rates obtained for breast-fed and bottle-fed infants were compared by Student’s t test (7), all of the monthly differences were found to be significant. Similarly, when the rates for infants receiving mixed feedings were compared to those for breast-fed infants, the differences observed in the second, third,
fourth, seventh, tenth, eleventh, and twelfth months were found to be significant. And comparison of monthly differences between the infants receiving mixed feedings and the exclusively bottle-fed infants showed those observed in the first and in the fourth through ninth months to be significant. On the basis of these findings it may be concluded that the type of milk fed to an infant during its first year of life is associated with the probability of malnutrition in that period.
When the bottle-fed and mixed-feed groups are combined, the observed rate of malnutri- tion begins at 14.6% in the first month and rises to 25 % in the twelfth. Comparison of the monthly rates for this group with those for the exclusively breast-fed group yields differences that are statistically significant in all months of life except the first.
Ldpez et al. 8 BREAST-FEEDING AND MALNUTRITION IN CHILE 161
Figure 5. Percentages of malnourished study infants observed among the groups receiving breast-milk only, breast-milk plus
artificial substitutes, and artificial substitutes only, by month of life.
30 -
R 25. s .- f 20. I
; 15. i
0 2 10.
Age in months
Table 7. Percentage of infants classifiable as malnourished, using the Sempi Table, among the three feeding groups studied during the first 12 months of life.
Malnutrition among study infants who were:
Malnutrition among aU the Breast-fed only Breast-fed and battle-fed Bottle-fed 04 study infants weighed No. of NO. 46 No. of NO. 96 No. of No % No. of NO. w Age in infants mal- md- infants mal- ma& infants mal- mal- infants mal- md- months weighed nourished nutrition weighed nourished nutrition weighed nourished nwntmn weighed ncunshed nutrition
1 166 12 7.2 29 2 6.9 12 4 33.3 207 18 a.7
2 147 12 8.2 39 7 17.9 21 5 23.8 207 24 11.6
3 118 10 8.5 57 14 24.6 32 li 34.4 207 35 16.9
4 98 6 6.1 64 11 17.2 45 16 35.6 207 33 15.9
5 89 9 10.1 63 10 15.9 54 16 29.6 206 35 17.0
6 74 4 5.4 57 4 7.0 75 19 25.3 206 27 13.1
7 71 3 4.2 55 7 12.7 80 20 25.0 206 30 14.6
8 55 3 5.5 46 4 8.7 105 29 27.6 206 36 17.5
9 52 3 5.8 43 5 11.6 111 33 29.7 206 41 19.9
10 32 1 3.1 42 9 21.4 129 28 21.7 203 38 18.7
11 30 2 6.7 42 9 21.4 131 34 26.0 203 45 22.2
12 18 1 5.6 32 8 25.0 149 37 24.8 199 46 23.1
162 PAHO BULLETIN l vol. 18, no. 2, 1984
ACKNOWLEDGMENTS
The authors are grateful for the cooperation of the Director and nursing staff of the Nogales Center, who made this work possible; to Drs. Ana Marfa Kaempffer, Marfa In& Romero, and Maria Eugenia Rodrigan for their guidance in conducting the study; to stat- istician Miriam Castellanos for her assistance in processing the data; and to Susana Pomar and Katya Vergara for transcribing the manu- script.
SUMMARY
To test the hypothesis that breast-feeding pro- motes infant growth while reducing rates of diar-
rheal disease and malnutrition, the authors studied a group of infants born in Santiago, Chile, at the San Francisco de Borja Hospital that were regis- tered at a local health center within 20 days of birth. The 207 infants selected for inclusion in this study, all born in 1975-1976, weighed at least 2,500 grams at birth, were delivered normally, had an Apgar score of eight or better, experienced no serious ill- ness in the lirst seven days of life, and were never hospitalized; also, all of their mothers had normal pregnancies lasting at least 38 weeks, and none of the mothers showed evidence of having any impor- tant morbid condition capable of influencing fetal health.
Birth data were obtained from the infants’ birth cards. Data regarding weight gains, feeding prac- tices, diarrheal disease episodes, and malnutrition were obtained from recorded medical information set down at the time of each infant’s checkups at the health center. Subsequently, at the end of the one- year monitoring period, visits were made to 44% of the infants’ homes in order to obtain socioeconomic information; this information showed that most (90%) of the families involved had a low socioeconomic status.
Month-by-month assessment of the study in- fants’ weights indicated that as a group those who were exclusively breast-fed made better weight
gains than those who were breast and bottle-fed, and much better gains than those who were ex- clusively bottle-fed. The average weight gains of solely breast-fed infants were distinctly better than those given a combination of breast and bottle- feeding; however, this latter mixed feeding did not appear as deleterious, on the average, as bottle- feeding alone.
Regarding diarrhea, between 12.5 and 19% of the exclusively bottle-fed infants experienced a diarrheal disease episode each month during the first five months of life. This percentage was much lower (generally below 8%) for the solely breast-fed group, and also for the group receiving a combina- tion of breast and bottle-feedings. This latter iind- ing indicates that breast-feeding, even in combina- tion with bottle-feeding, helped to reduce the fre- quency of diarrheal disease episodes among the study infants during their first five months of life.
The malnutrition picture, assessed by comparing the study children’s weights to those listed in the SempC Table, was somewhat different. Specifically, the rate of malnourishment in any given month ranged from 3 to 10% among the solely breast-fed children, from 7 to 25% among the breast and bottle-fed children, and from 22 to 33% among the solely bottle-fed children. On the basis of these find- ings it may be concluded that the type of milk fed to an infant during its first year of life was associated with the probability of malnutrition in that period.
REFERENCES
(1) Meneghello, J., 0. Undurraga, and R. (3) Chile, Ministerio de Salud. Unidad de1 nirio Ramos Gab&r, Pediatriu (vol 1). Intermedica, y de1 adolescente. Normas de pediatria, No. 1: Ac- Buenos Aires, 1972, pp. 152-153 and 311. ciones de foment0 y protection. Santiago, 1976.
L&z et al. l BREAST-FEEDING AND MALNUTRITION IN CHILE 163
nos factores condicionales. Cuademos Midico-Sociales (Chile) 15(4), 1974.
(5) Universidad de Chile, Facultad de Medicina Santiago Norte, Departamento de Nutrici6n. In- crementos pondoestaturales mensuales y acumula- dos seen tabla de Stuart. Pub. Dot. 1125/78. San- tiago, 1978.
(6) Gonztilez Soto, G. “Crecimiento y desarro- 110 de1 niiio.” Rev Universidad de Chile. 145:6, 1979.
(7) Zuwaylif, F. Estadbtica general aphcada. Fondo Educative Interamericano, Mexico City, 1977.
(8) Ariztia, A. Diarreas y desnutricidn infan- tiles. Rev Med Chil 100:1293-1297, 1972.
(9) Matin, P. Lactancia natural: Desafio en la enfermedad, desnutricihn y mortalidad infantil. Rev ChiI Pediatr 45(3):259, 1974.