ISSN 0104-6632 Printed in Brazil
www.abeq.org.br/bjche
Vol. 27, No. 03, pp. 401 - 412, July - September, 2010
Brazilian Journal
of Chemical
Engineering
SYSTEMATIC METHODOLOGY AND PROPERTY
PREDICTION OF FATTY SYSTEMS FOR
PROCESS DESIGN/ANALYSIS IN THE
OIL AND FAT INDUSTRY
C. A. Diaz-Tovar
1, R. Ceriani
2,3, R. Gani
1*and B. Sarup
41
CAPEC, Department of Chemical and Biochemical Engineering, Technical University of Denmark, Phone: + 45 4525-2882, Fax: + 45 4593-2906, Søltofts Plads, Building 229, 2800 Kgs. Lyngby, Denmark.
E-mail: rag@kt.dtu.dk
2
Department of Food Engineering, State University of Campinas, P.O. Box 6121, 13083-862, Campinas - SP, Brazil.
3
Faculty of Applied Sciences, State University of Campinas, 13484-350, Limeira - SP, Brazil.
4
Vegetable Oil Technology Business Unit, Alfa Laval Copenhagen A/S, Maskinvej 5, DK-2860 Søborg, Denmark.
(Submitted: December 9, 2009 ; Revised: June 21, 2010 ; Accepted: June 23, 2010)
Abstract - A systematic model based methodology has been developed and its application highlighted through the solvent recovery section of a soybean oil extraction process, with emphasis on the effect of design variables on the process performance. First, the most representative compounds present in the vegetable oil were defined. Basic and critical properties were then computed by means of appropriate property prediction software. Temperature dependant properties were modeled using and extending available correlations. The process model was developed through the PRO II commercial simulator and validated by matching the steady state simulation results with available plant data. The validated process model was then used to optimize the performance of the process by manipulating a selected set of design variables. The optimization results indicated that the process was already within the optimum zone; however, improvements in the amount of the hexane recovered were possible.
Keywords: Simulation; Optimization; Solvent recovery; Surface response methodology; Vegetable oil.
INTRODUCTION
Fats and oils are a source of energy and play an important role in human nutrition, via fat-soluble vitamins, and in the production of renewable sources of energy. Nowadays, the need for healthier food products, the growing interest in biofuels, along with environmental concerns, energy prices, and government incentives around the world, are increasing the demand for vegetable oils in global markets and driving the edible oil industry to develop new and/or efficient and clean technologies.
This work develops computer aided methods and tools for the systematic design and analysis of a process that employs lipid technology, in this case the solvent recovery section of the soybean oil extraction process. The aim is to analyse the process in terms of the most important design variables, in order to determine the optimum process operation conditions. However, this is not an easy task since the number of design variables involved in the process (temperature, pressure, and number of stages) is quite large, while the optimization of the process performance with a rigorous simulation model is not trivial. An alternative approach is to use factorial design techniques such as the Plackett-Burman method (Montgomery, 2005). These techniques are useful tools to identify, observe, and analyze the critical parameters of the process and their effects on the process behaviour when subjected to changes in the design variables when the objective is to obtain a reduced model. Two techniques are considered in this paper: the first applies a screening procedure to discard design variables that do not affect the overall performance of the process; the second establishes the order to perturb the remaining design variables to observe their effect on the process performance defined in terms of the identified process parameters.
The solution procedure employed in this work consists of three main steps: Process simulation, process model reduction, and process optimization. The process simulation step consists of characterization and generation of property data for the chemical species (acylglycerides, fatty acids and esters, and unsaponifiable compounds) present in the process and creating a database for their use in process simulation models; the identification and modelling of the unit operations found in the process; and the establishment of the process operation conditions. The model reduction step applies factorial design (design of experiments) techniques to identify the design variables and their interactions that significantly affect the process performance and creates a reduced “quadratic” model relating such variables to the selected response variable. The optimization step determines the design variable values corresponding to the optimal process performance.
LIPID PROCESSING TECHNOLOGY
Lipid technology refers to products and processes (modification, purification, separation, etc.) that involve fatty acids, their derivatives, and related
substances. As is known, the production of edible oils/fats involves a great variety of processing steps and unit operations, from crude oil production to the final product. Unit operations include fluid handling, heat transfer, and separation processes such as adsorption, two-phase separation (liquid-solid, liquid-liquid, and liquid-gas), crystallisation, filtering, chemical reactions (interesterification, hydrogenation), steam stripping under vacuum, etc. However, state of the art in process modeling has only penetrated this industry to a very limited extent and part of the reason is the complex nature of the lipid systems involved.
Even though computational simulation is widely used for design, analysis, and optimization in the chemical and petrochemical industry, this is not the case in the edible oil industry. Currently none of the commercial simulators contain within their database the most significant families of lipid compounds found in the edible oil industry. Therefore, these computational tools are unable to predict the necessary properties and/or perform simulations of these processes, improving the process design, increasing the understanding of the process behaviour, and reducing the time and cost for product-process development.
Soybean Oil Process Production
Systematic Methodology and Property Prediction of Fatty Systems for Process Design/Analysis in the Oil and Fat Industry 403
Therefore, the solvent recovery section of the soybean oil production process is a crucial unit operation, which is studied in this work with industrial process data made available by Alfa Laval.
The hexane recovery section (see Figure 1) includes four parts: An oil recovery, a condensation system, a mineral oil system and a water-solvent separation. After the preparation of the oil seeds, the flakes are “washed” and both the miscella (mixture of oil and solvent) and the white flakes (extracted flakes wet with solvent) are heated separately to remove the solvent. The flakes go to a desolventiser–toaster–drier– cooler (DTDC) unit and the miscella enters the first part of the solvent recovery section, the oil recovery system, where the oil is concentrated. In the oil recovery part, the oil is concentrated by removing the solvent from the oil, which is subsequently concentrated to nearly 100% (crude oil). All the recovered solvent vapors mixed with steam, including those coming from the DTDC facility, are retrieved by means of three sub-systems that are part of the solvent recovery system: the condensation, the MOS (mineral oil system), and the water–solvent separation. Therefore, vapors are condensed and the residual vapors are captured in the mineral oil system. The condensates from the condensation system enter a water–solvent separation section, where the solvent is
recovered and, after mixing with a make-up stream, is redirected to the extractor.
METHODS AND TOOLS USED
Methodology
The development of the solvent recovery section model and its optimization involved the following sequence of steps (see Figure 2):
Process analysis: Determination of the
representative chemical compounds involved, unit operations, and process conditions.
Creation of a database that includes the most
representative compounds of oils and fats (acylglycerides, fatty acids and esters, and minor compounds).
Models to predict the physical properties
(energies of formation, basic, critical, and temperature dependent properties) that are sufficient to perform the model simulation in any commercial simulator.
Simulation model development and validation of it with plant data.
Optimization problem definition in terms of the most important design variables and results analysis.
Figure 2: Proposed methodology for the design/analysis of edible oil processes.
Property Prediction of Lipid Compounds
Oils and fats are complex mixtures of chemical compounds, which determine not only the physical properties (melting point, density, viscosity, etc.), but also provide specific characteristics to the product (color, odor, taste, etc.). Based on the quantity and significance in the final product, the compounds that constitute the oils or fats can be divided into two different groups. The first group includes the major compounds such as acylglycerides and fatty acids. Meanwhile, the second group includes the minor compounds such as fatty esters, phospholipids, sterols, sterol esters, terpenes, tocopherols, and tocotrienols. In this work, three main sources of fats and oils have been identified: oil seeds, tree fruits and kernels, and animals. From these main sources, thirteen different types of the most widely used vegetable oils (soybean, sunflower, olive, palm, etc.), as well as two different kinds of fats (lard and tallow), were reviewed in the literature in order to define their typical chemical composition.
The database created from this literature review includes a total of 28 fatty acids (from C6 to C24), 63 triacylglycerides (from C28 to C58), 44 diacylglycerides (from C14 to C40), 15 monoacylglycerides (from C8 to C22), 58 fatty esters (methyl and ethyl from C6 to C24), and 21 minor compounds (phospholipids, sterols, terpenes, and tocopherols). The database also includes predicted properties for the lipid compounds such as melting point (a new model has been developed), vapor
pressure (Ceriani and Meirelles, 2004), and densities (Halvorsen et al., 1993), as well as critical properties and energies of formation that were calculated using a group contribution approach by means of the software ICAS™ ProPred (Marrero and Gani, 2001).
Process Simulation Model
The solvent recovery section consists of several unit operations: flash, heat exchange, mixing, splitting, stripping, and absorption. In principle, any commercial software or computational program capable of simulating these unit operations can be employed. In this work, the process section was simulated using the PRO II commercial simulator for two main reasons: because it has built-in models for the unit operations present in the process and because it is possible to retrieve the necessary property data of the lipid chemical compounds from an external user-added database.
Solvent Recovery Model
Systematic Methodology and Property Prediction of Fatty Systems for Process Design/Analysis in the Oil and Fat Industry 405
Figure 3: Solvent recovery process flow sheet (Martinho et al., 2008), as represented by PRO II.
Table 1: Soybean oil crude composition (wt %)
COMPONENT LITERATURE (Shahidi, 2005) THIS WORK*
Triacylglycerols 94.4 95.8 Free Fatty Acids 0.3-0.7 1.3
Phospholipids 3.7 - Plant Sterols 0.236 1.5**
Tocopherols 0.123 1.4***
Hydrocarbons 0.38 -
Trace metals ppm ppm
Iron 1-3 -
Copper 0.03-0.05 -
*
Based on available data **
Expressed as cholesterol ***
Expressed as α-tocopherol
Oilseed Preparation
In a first stage, the soybean seeds (FEED_SEEDS) are cracked and dehulled to concentrate the available oil and protein in the oil seeds and to increase the capacity of the plant (AOCS, 2003). A second stage comprises the conditioning and flaking of the cracked and dehulled seeds (meats). The conditioning process cooks the meats in the presence of elevated moisture. The heat of this process softens the meats, reduces the viscosity of the oil, and coagulates the proteins. The flaking is the final process in the preparation of the seeds for the extraction and its purpose is to reduce the granular meats into thin flakes, increasing with this the surface area per unit of mass.
Crude Oil Extraction
In a third stage, the flakes (EXTCT_FEED) are introduced into completely closed vessels (extractors) designed to convey flakes through a wash of solvent
until the majority of the oil has been extracted. Finally, the miscella (MISCELLA) enters the final stage of the soybean oil production process, the solvent recovery section. On the other hand, wet flakes (MEAL) enter a desolventiser–toaster–drier–cooler (DTDC) unit to remove the residual hexane present in them and to enhance the digestibility of the proteins in animal feeds. The gases produced in the DTDC process (HEX_REC_MEAL) are condensed and directed to the solvent –water separator.
Oil Recovery
simulator as flash vessels. Concentrated miscella is fed on the top of a stripping column (STP1), which has been modelled as a distillation column without re-boiler and condenser, to remove the final traces of hexane from the oil. The crude oil leaves the bottom of the stripping column as a stream named CRUDE_OIL and is directed to the subsequent refining processes (not disclosed in this work).
Condensation System
This section consists of a sequence of chilled water condensers, where almost all the hexane vapor mixed with the steam is condensed. In this model, the vapor streams rich in hexane from the two evaporators (HEX_REC and HEX_REC_2) are mixed (M1) and sent to two condensers in series, which are represented by two heat exchangers (E3 and E4 ) followed by two flash separators (COND1 and COND2). The water-hexane vapor stream of the stripping column (HEX_REC_3) is partially condensed by means of a heat exchanger (E2) followed by a flash separator (COND3).
The condensed streams of the flash separators are mixed (HEX_REC_MIX2) and sent to the solvent-water separator. On the other hand, non-condensed vapors of the condensed section are also mixed (HEX_REC_MIX3) and sent to the mineral scrubbing oil system.
Mineral Oil System
This system consists of an adsorption column (ABSPC) followed by a stripping column (STP2) with a network of heat exchangers (E7, E8, E9, and E10) between them that controls the temperature of the mineral oil. Both columns have been modelled as a distillation column without re-boiler and condenser and the mineral oil has been modelled as an alkane with a linear chain of 15 carbon atoms (NC15).
The absorption column (ABSPC) receives at the bottom the non-condensed vapors of the condensation section (HEX_REC_MIX3), which include the air leaking from the vacuum system and, at the top, the mineral oil. Two streams leave the absorption column: at the top, the non-absorbed compounds (AIR_OUT) and, at the bottom, the mineral oil containing hexane (T1_REC_OUT).
The mineral oil is then heated by means of the heat exchanger network and the feed to the stripping column (STP2). Steam (T2_STEAM_FEE) is used to strip out the hexane from the mineral oil. Steam rich in hexane leaves the column at the top (HEX_REC_DEST) and is sent to the water-solvent
separation section; hexane-free mineral oil leaves the column at the bottom (T2_REC_OUT ) and enters the heat exchangers, where it is cooled down and sent back to the absorption column.
Water-Solvent Separation
The condensate hexane-water from the MOS System (HEX_REC_DEST) and the mixed hexane condensed streams from the previous processes (COND_HEX) are mixed and the resulting stream (WET_HEX_REC) is sent to a decanter tank (DECANT). As a result of the immiscibility and density difference of the two-liquid phases, hexane separation from the aqueous solution is achieved. Two liquid streams leave the decanter tank: the water waste (WS_WATER) and the recovered hexane (DRY_HEX_REC).
MODEL VALIDATION
Database Compounds Physical Properties
As mentioned above, the database includes models to predict all the necessary physical properties of the compounds involved in the edible oil industry. A special model has been developed in this work for the prediction of melting points of fats and oils. Physical properties such as vapor pressure, densities, critical properties, and energies of formation can be predicted and retrieved from the user defined external database implemented in the PRO II commercial simulator. The models implemented for the property prediction have already been validated by their respective authors (Ceriani and Meirelles, 2004; Halvorsen et al., 1993; Marrero and Gani, 2001).
Process Simulation
The accuracy of the soybean oil extraction process simulation has been determined by comparing the simulated results with data from a full-scale industrial plant under the same operational conditions. Is to be highlighted that the industrial data is assumed to be correct and that it has already been reconciled. The average relative deviation (ARD) between the industrial data and the simulated data for the crude oil and the overall loss of hexane was analysed according to:
exp mod el N
i i
exp i 1
i
(x x )
x
ARD(%) 100
N
= −
Systematic Methodology and Property Prediction of Fatty Systems for Process Design/Analysis in the Oil and Fat Industry 407
where exp i
x are the plant data for vegetable oil and hexane mass compositions in stream i and model
i
x are
the calculated data for the same variables for N different experimental (plant) runs.
The ARD for the oil composition in the crude-oil stream is 0.31%, while the ARD for the loss of hexane in the process is 4.71%. This comparison confirmed that the proposed simulation model for hexane and oil gives an acceptable match of the observed data in the industrial process. It should be noted that the simulated hexane concentration in the crude oil stream was indeed the main loss of hexane.
OPTIMIZATION OF THE SOLVENT RECOVERY SECTION
The validated solvent recovery section simulation model was used to optimize the performance of the solvent recovery section in terms of vegetable oil and hexane loss, by manipulating the selected design variables. The goal of this optimization problem is to
minimize the loss of hexane solvent and vegetable oil (product) during the process.
The Optimization Problem
The optimization problem is defined by determining, according to the flow diagram, the streams where both the hexane solvent and vegetable oil can be lost (see Table 2). From the available plant data it was possible to set the process parameters and the design variables that were manipulated during the performance analysis of the process.
The selected design variables were perturbed in the range of 5-30% with respect to their nominal value, since this is an acceptable range within the usual industrial practice (Martinho et al., 2008). Table 3 shows the design variables (DV) and the process parameters (PP) with their nominal values and the perturbation applied during the performance analysis.
Equation (2) is the objective function that is to be minimized; while equations (3)-(11) are the constraints that the objective function is subject to.
Table 2: Process streams from which hexane or vegetable oil can be lost
PROCESS SECTION DESCRIPTION CODE NAME
DTDC Solid (flakes) output stream Solid_Out Oil Recovery Crude oil output stream Crude_Oil MOS System Absorption column vapor output stream Vap_Out
N/A Purge Purge
Water-Hexane Separation Water output stream WS_Water Water-Hexane Separation Vapor phase output stream WS_Vap
Table 3: Selected design variables (DV) and process parameters (PP) for the performance analysis
PROCESS SECTION DESCRIPTION CODE NAME TYPE NOMINAL
VALUE VARIATION
Objective Function
oil(Hex) out(Hex)
out(Hex) mos(Hex)
water(Hex) vap(oil) water(oil)
OF Crude Vap
Solid Purge(Hex) Vap
Mos WS WS
= + +
+ + +
+ +
(2)
Constraints
26.46 TCOND2 ( C)≤ ° ≤35.80 (3)
25.51 TDECANT( C)≤ ° ≤28.19 (4)
53.34 TEVAP1( C)≤ ° ≤72.16 (5)
88.00 TEVAP2( C)≤ ° ≤132.00 (6)
104.50 TSP1( C)≤ ° ≤115.50 (7)
0.26 PCOND1(bar)≤ ≤0.36 (8)
0.18 PDECANT (bar)≤ ≤0.42 (9)
0.39≤PEVAP1(bar)≤0.73 (10)
Number of Stages 1≥ (11)
Analysis of the Objective Function
The validated simulation model from PRO II was used to determine which terms of the objective function (see Equation (2)) can be disregarded from further analysis. By means of the steady state simulation results, it was possible to establish the following observations:
Presence of hexane in the stream Solid_Out can be neglected because, according to the plant data, the DTDC process is capable of removing all hexane and water from the white flakes.
The major loss of vegetable oil in the process is located in the solvent extraction process, where some oil may remain in the waste solid. Since a predictive model to calculate this variable was not available, the stream Solid_Out was not considered in the model reduction step. Since the emphasis in this study is on the recovery of the extracted oil, this loss of unextracted oil can be neglected.
The amount of oil in the streams Purge and
WS_Water can be neglected as these values were found to be on the order of 10-7 kgmol/hr.
Two liquid phases (water and hexane) are present in the vessel equipment named DECANTER. Therefore, the stream tagged as WS_Vap, which is in
the gaseous state in the flow diagram, was neglected in the further solution steps.
Based on the above observations, the corresponding terms correlating the above streams (where hexane and / or oil could be lost) to the response variables have no influence on the performance of the process. As a consequence, by setting these terms to zero, Equation (2) is reduced to:
Oil(Hex) Out(Hex)
OF Crude= +Vap +Purge(Hex) (12)
Equation (12) actually corresponds to the amount of hexane recovered in the process, which will now be maximized.
Objective Function=Re cov ery of Hexane (13)
Model Reduction
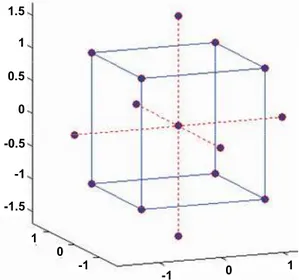
The observed changes in a response variable may be correlated with, but not caused by, observed changes in individual process variables. Simultaneous changes in multiple factors may produce interactions that are difficult to separate into individual effects. A response surface model is a multivariate polynomial model that arises from a factorial designed experiment, in which the data-producing process is manipulated to improve the quality of information. Central composite design (Ceriani et al., 2008) is widely used for estimating second order response parameters to produce response surfaces with a maximum or a minimum. The factorial design can be seen as the union of (see Figure 4): (a) eight corners of a cube, which form a two level full factorial design (-1 and +1), (b) six points in the centers of each face, known as star points (-α and + α), and (c) the center point (0).
1 0 -1 -1.5 -1 0 0.5 1 1.5 -0.5 1 0 -1 1 0 -1 1 0 -1 -1.5 -1 0 0.5 1 1.5 -0.5 -1.5 -1 0 0.5 1 1.5 -0.5 1 0 -1 1 0 -1
Systematic Methodology and Property Prediction of Fatty Systems for Process Design/Analysis in the Oil and Fat Industry 409
However, regardless of the fact that two-level designs are sufficient for evaluating many production processes, experiments with many factors can lead to large amounts of data. Fractional factorial designs have been proposed as an alternative to analyse the effects because they only use a fraction of the runs required by full factorial designs to determine the model parameters. The use of methods for screening design alternatives is interesting in the early stages of an experiment or simulation based design studies because they allow one to identify the most sensitive set of independent variables for the process responses of interest. One of the most common fractional factorial designs is the Plackett-Burman (PB) method, which is a technique where only the main effects are considered to be significant, thereby achieving a reduction in the number of design variables. The advantage of this technique is that it only requires a number of experimental runs that are a multiple of 4 instead of a power of 2 (Montgomery, 2005). For this study, a complete factorial design would correspond to 520 simulation runs. While the individual simulation runs do not take too much time, the off-simulation time related to simulation problem set-up, data analysis and data-flow can be quite substantial. The objective here is to highlight the potential gains that
the use of PB design provides and not the specific gains in terms of the computational times for the simulations. Previous work (Ceriani et al., 2008) combined central composite design with simulation applied to lipid processing industry
Plackett-Burman Design (PB)
In order to give more flexibility to the experimental design and, therefore, not utilize all the degrees of freedom to estimate the main effects, a PB design with 16 runs was employed (see Table 4). In each one of the runs, the selected design variables have to adopt one of the ±1 levels (perturbed values) so that the statistical analysis of the simulation results can identify the main effects.
According to the range of values that can be found within the usual industrial practice, ±1 levels for each one of the design variables used in the 16 simulations are listed in Table 5.
Statistical analyses of the 16 simulation results are shown in Table 6. According to the Plackett-Burman design technique, only five of the original nine design variables were found to affect significantly the performance of the solvent recovery section of the soybean oil extraction process.
Table 4: Plackett-Burman design for 9 design variables and 16 simulations
VARIABLE RUN
1 2 3 4 5 6 7 8 9 Hexane Recovery (%)
1 1 -1 -1 -1 1 -1 -1 1 1 99.921
2 1 1 -1 -1 -1 1 -1 -1 1 99.886
3 1 1 1 -1 -1 -1 1 -1 -1 99.626
4 1 1 1 1 -1 -1 -1 1 -1 99.879
5 -1 1 1 1 1 -1 -1 -1 1 99.842
6 1 -1 1 1 1 1 -1 -1 -1 99.826
7 -1 1 -1 1 1 1 1 -1 -1 99.824
8 1 -1 1 -1 1 1 1 1 -1 99.888
9 1 1 -1 1 -1 1 1 1 1 99.845
10 -1 1 1 -1 1 -1 1 1 1 99.661
11 -1 -1 1 1 -1 1 -1 1 1 99.896
12 1 -1 -1 1 1 -1 1 -1 1 99.567
13 -1 1 -1 -1 1 1 -1 1 -1 99.896
14 -1 -1 1 -1 -1 1 1 -1 1 99.825
15 -1 -1 -1 1 -1 -1 1 1 -1 99.661
16 -1 -1 -1 -1 -1 -1 -1 -1 -1 99.842
Table 5: Perturbed values of the design variables for the Plackett-Burman design
LEVELS
DESIGN VARIABLE
-1 +1
TCOND2(°C) 26.46 35.8
PCOND1(bar) 0.26 0.36
TDECANT(°C) 25.51 28.19
PDECANT(bar) 0.18 0.42
TEVAP1(°C) 53.34 72.16 TEVAP2(°C) 88.00 132.00 TSTP1(bar) 104.50 115.50
NSTP1 4.00 6.00
Table 6: Plackett-Burman design results
PROCESS STREAMS SIGNIFICANT DESIGN VARIABLES
Vap_Out TCOND2, PCOND1, TEVAP1 Crude_Oil TCOND2, TEVAP2, TEVAP1
Purge TCOND2, TSTP1
Full Factorial Design
Based on the results of the PB design, a second
set of 43 simulations, 25 trials plus a star
configuration (2*5) and one central point, was performed using the central composite design. Table 7 shows the values for each one of the levels (-1, +1, -α, + α, and c) of the five design variables employed in the performance analysis of the solvent recovery section.
From a statistical analysis of the results, a quadratic model for the Hexane Recovery response was obtained (see Equation (14)). The model correlating the hexane recovery with the design
variables is given in terms of 3 design variables (TCOND2, TEVAP2, and TSP1) since these variables are the only ones that affect the hexane content in the output stream Crude_Oil (see Table 6). The ARD value for the reduced model is 0.008%. The response surface indicates the performance of the process in terms of the design variables with respect to the response variables. In this work the surface response for the reduced model was generated (see Figure 5) by setting the value of the variable TCOND2 (see Table 7) to its nominal value (0) and by modifying the value of the variables TEVAP2 and TSP1 within their respective range of values (see Table 7) in Equation (14).
Table 7: Perturbed values of the design variables for the Central Composite design
LEVELS DESIGN
VARIABLES -α -1 0 1 + α
TCOND2 26.46 29.17 31.13 33.09 35.80
PEVAP1 0.3900 0.4989 0.5600 0.6315 0.7300
TEVAP1 53.34 58.79 62.75 66.71 72.16
TEVAP2 88.00 100.75 110.00 119.25 132.00
TSP1 104.50 107.69 110.00 112.31 115.50
Systematic Methodology and Property Prediction of Fatty Systems for Process Design/Analysis in the Oil and Fat Industry 411
(
)( )
( )(
)
2
EVAP2 EVAP2
EVAP2 SP1 SP1
SP1 COND2
Hexane Recov ery 0.0057 0.0137
0.0054 T T 0.01787
0.0047 T T 99.963
= − + +
− −
+
(14)
The objective of obtaining a reduced second order model is to observe where the process is currently operating and if further improvements in the process performance can be achieved.
Optimization
The reduced model that correlated the response variable to the selected design variables is represented by Equations (15)-(18). The model was solved as a NLP problem by means of the software ICASTM MoT and optimum operational points where Equation (15) is maximized were found (see Table 8).
Table 8: Optimal values for the design and response variables
VARIABLE VALUE
Design
TCOND2 35.80°C TEVAP2 110.14°C TSTP1 104.50°C
Response
Objective Function
(Hexane Recovery) 99.98%
Max Objective Function=Re cov ery Hexane (15)
s.t.
26.46≤TCOND2( C)° ≤35.80 (16)
88.00≤TEVAP2( C)° ≤132.00 (17)
104.50≤TSP1( C)° ≤115.50 (18)
According to the results obtained from the optimization of the reduced model, the temperatures of operation in the second condenser and in the second evaporator have to be modified to operate at the lower boundary (–α) and at the higher boundary
(α), respectively (See Table 7). However, the
nominal temperature in the feed of the stripping column (see Table 3) should be kept at the current operation value to achieve the best performance of the solvent recovery section.
CONCLUSIONS
The model that describes the soybean oil extraction process, with special emphasis on the solvent recovery section, has been studied in this work. A database that includes the most representative chemical species present in the edible oil industry has been created and used to find the optimal process performance.
The good comparison between the available data plant and the results obtained from the model simulation validated the proposed unit operations used to describe the process, as well as the model proposed to predict the physical properties of the chemical species involved in the soybean oil extraction process.
The accuracy of the proposed models provided the basis for further analysis of the solvent recovery section performance in terms of the selected design variables. The original nine operational variables considered in the formulation of optimization problem could potentially require more than 500 simulations if the full factorial technique were used without any pre-analysis. Therefore, the Plackett-Burman method was employed to reduce significantly the total number of simulations that needed to be performed. With the reduced set of design variables, the full factorial technique was applied following the central composite design and a reduced model correlating the selected design variables and response variable was obtained. The response surface generated through the reduced model showed that the process is within the optimal zone, although improvements are possible. Therefore, optimal values of design variables where hexane recovery is maximum were found. The results confirm that, through a combination of a validated property database and process modelling techniques, the operation and design of industrial lipid technologies can be optimized and further design/analysis of these and other lipid based processes found in the edible oil industry could be performed.
REFERENCES
American Oil Chemists’ Society, Introduction to the Processing of Fats and Oils, AOCS, Champaign, USA (2003).
Ceriani R., Meirelles J. A. and Gani R., Simulation of thin-film deodorizers in palm oil refining. J. Food Process Eng., 33, 1, 208 (2008).
Halvorsen J. D., Mammel Jr. W.C. and Clements L.D., Density estimation for fatty acids and vegetable oils based on their fatty acid composition. Journal of the American Oil Chemists' Society, 70, 9, 875 (1993).
Marrero, J. and Gani R., Group-contribution based estimation of pure component properties. Fluid Phase Equilibria, 183-184, 183 (2001).
Martinho A., Matos H. A., Gani R., Sarup B. and Yougreen W., Modeling and simulation of vegetable oil processes. Food and Bioproducts Processing, 86, 87 (2008).
Montgomery, D. C., Design and Analysis of Experiments. John Wiley & Sons, New Jersey (2005).
Shahidi, F., Bailey’s Industrial Oil and Fat Products. John Wiley & Sons, New Jersey (2005).