Photocatalytic Activity and RNO Dye Degradation of Nitrogen-doped TiO
2Prepared by
Ionothermal Synthesis
Angelo Pipi a,b, Gabriela Byzynski c, Luis Ruotolo a,*
Received: November 09, 2016; Revised: February 13, 2017; Accepted: February 13, 2017
This work concerns the preparation a nitrogen-doped TiO2 by ionothermal synthesis methods and the photocatalytic studies. In this procedure, alkoxide was used as a titanium source, and a deep eutectic mixture of choline chloride and urea (molar ratio 1:2) served as a solvent and source of nitrogen. Diferent samples were synthesized varying the percentages of the eutectic mixture, titanium butoxide, and water, as well as temperature and reaction time. The catalysts were characterized by X-ray difraction, Raman spectrometry, scanning electron microscopy, and difuse relectance spectroscopy. N-doping was conirmed by X-ray photoelectron spectroscopy. The photocatalytic activity of the N-TiO2 nanoparticles was evaluated in the oxidation of N,N-dimethyl-4-nitrosoaniline (RNO) dye. The best photocatalytic activity under illumination by UV and visible light was found for the catalysts prepared under relux in the presence of water, and for the catalysts prepared hydrothermally using intermediate percentages of the nitrogen source (the eutectic mixture).
Keywords: N-TiO2; ionothermal synthesis; photocatalytic activity
* e-mail: [email protected]
1. Introduction
Human activities now generate a broad range of non-biodegradable organic pollutants that requires physical-chemical treatments due to their signiicant environmental and human health impacts, as well as economic implications.1,2
The techniques used for the treatment of eluents containing recalcitrant organic pollutants include advanced oxidation processes (AOPs) involving the generation of hydroxyl radicals (•OH).3 Among the AOPs, photocatalytic degradation using stable photocatalysts (dispersed or immobilized) has been widely investigated for the oxidation of recalcitrant organics. Among the photocatalysts, TiO2 is one of the most widely used due to its thermal stability, low cost, chemical inertness, and non-toxicity.4-6
Despite the advantages mentioned above, TiO2 is active only when irradiated with similar or higher energy than its band gap (~3.0 eV for rutile, ~3.4 eV for anatase and ~3.3 eV for brookite), which corresponds to wavelengths in the ultraviolet light (UV), therefore limiting its use in many photocatalytic applications. Therefore, one of the greatest challenges in the ield of photocatalytic processes concerns the need to increase the spectral sensitivity of this photocatalyst to visible light, which is obtained doping semiconductor with non-metal and metal elements.7 After the irst literature reported for TiO2 doping with N in 2001 by Asahi et al.,8 resulting in photocatalytic activity at wavelengths up to 540 nm, the N-doped TiO2 material was used in visible processes
for degradation of phenol,9 methyl orange,7 and rhodamine B.11 Given the current state-of-art, 5,12-14 it is highly desirable to identify new synthesis routes for TiO2 doping in order to obtain visible light-active photocatalysts.
TiO2, doped or not, has been synthesized using techniques such as sputtering,15,16 chemical vapor deposition,17,18 sol-gel process,19,20 hydrothermal process,7 electrochemical methods,21,22 and, more recently, ionothermal synthesis.23,24 Ionothermal synthesis was referred for the irst time in 2004 by Cooper
et al.25 to distinguish the synthesis carried out using solvents composed predominantly by ionic liquids (IL) or deep eutectic mixtures (EU) from hydrothermal preparations, which take place in a predominantly molecular solvent. To the best of our knowledge, there have been no reports in the literature concerning the use of ionothermal synthesis to dope TiO2.
The advantage of using ionothermal synthesis over other methods rely on the fact that it satisies the requirements of “green chemistry”, since IL and EU have important physical and chemical properties such as low vapor pressure, high thermal stability, non-volatility, non-combustibility, non-toxicity, and low melting point. These new classes of solvents are now used in the synthesis of nanocrystals of various metal oxides.26 In our research group, an EU has been used simultaneously as solvent and template to synthesize aluminophosphates that have superior adsorption capacity.27,28
The aim of this work was to demonstrate that the ionothermal synthesis using a low cost eutectic mixture can be used to prepare nitrogen-doped TiO2 with photocatalytic
a Departamento de Engenharia Química, Universidade Federal de São Carlos, Rod. Washington Luiz,
km 235 - SP 310, s/n, 13565-905, São Carlos, SP, Brazil
b Pró-Reitoria de Pesquisa e Pós-Graduação (PRPPG) – Universidade do Sagrado Coração – USC.
Rua Irmã Arminda, 10-50 CEP 17011-160 – Bauru, São Paulo, Brasil.
c Departamento de Química, Universidade Estadual Paulista " Júlio de Mesquita Filho", UNESP, Prof.
activity in the visible light. In this approach, the EU enabled simultaneous nanostructuring and doping of the TiO2. An alkoxide was used as the titanium source, while the deep eutectic mixture of choline chloride and urea (molar ratio 1:2) served as a solvent and source of nitrogen. The main advantage of the TiO2 preparation using choline chloride/urea EU relies on the fact that it can change the oxide properties by introducing more nitrogen atoms (substitutional N) in the TiO2 structure, thus improving its photocatalytic activity in the visible light.
2. Experimental
2.1 Materials
The EU of choline chloride (Sigma-Aldrich) and urea (Synth), in a 1:2 molar ratio, was prepared by mixing the reagents in a beaker and stirring at room temperature until formation of a viscous and colorless liquid. Titanium butoxide (Sigma-Aldrich) was used as the source of Ti. Deionized water was used as a mineralizing agent in some of the syntheses. N-N-dimethyl-4-nitrosoaniline (RNO) (Sigma-Aldrich) was employed in the experiments to evaluate the photocatalytic activity of the TiO2 synthesized in this work, and P25 from Evonik29 was also used for RNO oxidation. All reagents were analytical grade, and deionized water was used to prepare the solutions.
2.2 Preparation of N-TiO
2at room and controlled
temperatures
Prior to starting the synthesis of N-doped TiO2, a sample of pure TiO2 (TO) was prepared by adding Ti butoxide and water, in the absence of EU. This sample was used for comparative evaluation of the efect of EU on the photocatalytic activity of TiO2. Subsequently, six diferent N-TiO2 samples (RTO-1 to RTO-6) were synthesized under diferent experimental conditions, summarized in Table 1. Most of the syntheses were carried out at high temperature, as preconized by the ionothermal method, but some synthesis were performed at room temperature in order to investigate the inluence of temperature on the preparation method.
The syntheses were carried out in a round bottom lask illed with all the reagents. A condenser was used to relux the volatile compounds. The reagents were heated and magnetically stirred. After reaction, the precipitate was separated by vacuum iltration and annealed in an oven at 500 °C (except for RTO-6), using a heating rate of 10 °C/min.
2.3 Preparation of N-TiO
2in autoclave
In order to explore new possibilities for the synthesis and improvement of the TiO2 doped with nitrogen, a set of syntheses were performed using an autoclave (samples
ATO-1, ATO-2, and ATO-3). In all these experiments, the amount of titanium butoxide used was 10 mL. The reaction time and temperature were 24 h and 120 °C, respectively, and the heating rate was 10 °C/min. After reaction, the autoclave was washed abundantly with deionized water and the contents were transferred to a beaker for sonication for 5-10 min. Afterwards, the solution was vacuum iltered and the precipitate was heated in an oven at 500 °C for 1 h, using a heating rate of 10 °C/min.
2.4 Photocatalytic activity
The photocatalysts were evaluated in terms of their photocatalytic activity by means of the bleaching of a solution of RNO at an initial concentration of 2.0 x 10⁻⁵ mol L-1. RNO was chosen because it is a trap for hydroxyl radicals (•OH) and shows a high reaction rate, according to reaction (1).30 This compound is known to be a scavenger of •OH.
The absorbance of RNO at a wavelength of 440 nm was measured using an UV-Vis spectrophotometer (2100Pro, Amersham Pharmacia). The bleaching experiments were carried out in a jacketed batch reactor, using 500 mL of RNO solution and 250 mg of catalyst. Radiation was provided by a black lamp (Philips, 25 W) with maximum emission wavelength in 365 nm and a visible light lamp (Philips, 25W) with maximum emission wavelength in 545, 610, and 435 nm, respectively. The lamp was inserted in the center of the batch reactor, immersed in the RNO solution. The temperature was maintained at 26-28 °C using a thermostatic bath (Solab, SL 152).
2.5 Characterization measurements
The phase composition was determined using X-ray powder difraction (XRD) patterns obtained with a Siemens D5005 difractometer and Ni-iltered Cu Kα radiation (λ = 1.5418 Å), scanning from 2θ of 20° to 80°, at 10° min-1. Search Match software was used to indexed the crystallographic phase.
Powder morphology was characterized by scanning electron microscopy (SEM), using a Philips XL30 FEG microscope. Difuse relectance spectroscopy (DRS) spectra were recorded in the 200-800 nm spectral range, using a Shimadzu UV 3600 spectrophotometer. The power for DRS analyses were pressed to form a thin ilm.
Table 1. Synthesis conditions
Sample Volume of EU (mL)
Volume of Ti butoxide (mL)
Volume of water (mL)
Reaction
temperature (oC) Reaction time (h)
Annealing temperature (oC)
TO 0 20 30 25 24 500
RTO-1 10 10 0 25 24 500
RTO-2 20 20 0 80 24 500
RTO-3 20 20 2 80 8,5 500
RTO-4 20 20 0 120 24 500
RTO-5 20 20 30 25 24 500
RTO-6 20 20 30 25 24 400
ATO-1 10 10 0 120 24 500
ATO-2 5 10 0 120 24 500
ATO-3 1 10 0 120 24 500
1253.6 eV), under vacuum (5 x 10⁻⁷ Pa). The detector energy used was 10 eV.
Particle size distributions (PSD) and mean diameters were determined using a Mastersizer MAF 5001 (Malvern Instruments).
3. Results and Discussion
3.1 Characterization
3.1.1 Particle size distribution (PSD) and mean
diameter
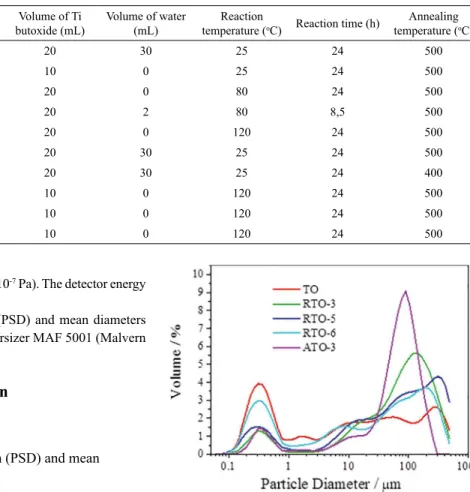
The PSD results (Figure 1) represent the volume, in terms of percentage, of the sample corresponding to a speciic particle diameter. It can be seen that the particles synthesized using the eutectic mixture presented much greater diameters than P25, which according to literature, has an average diameter of 50 nm.31 The synthesized samples could be broadly divided into two large groups, one with diameters of 0.2-0.8 μm and the other with larger diameters of between 20 and 120 μm. In general, the TiO2 prepared ionothermally showed coarser particles than P25 and TO, so the surface area exposed to light irradiation would be expected to be smaller.
3.1.2 Scanning electron microscopy
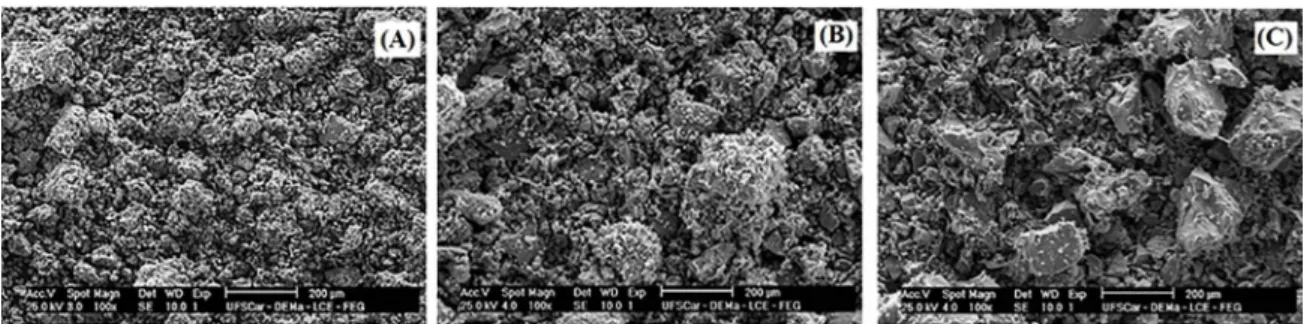
The micrographs obtained for samples RTO-1, RTO-2, and RTO-3 are shown in Figure 2. Contrary to P25, whose particles are smaller and more homogeneous in size,31 the images of the synthesized samples showed that the particles had no deined geometry and that the material formed was composed of particles with diferent granulometries (corroborating the PSD results), together with agglomerates of particles. Increase of the synthesis temperature from 25 ºC to 80 ºC (RTO-1 and RTO-2) did not afect the particle morphology, but the presence of water in the reaction medium (RTO-3) resulted in the formation of larger particles (Figure
Figure 1. Particle size distributions of the diferent photocatalysts.
1). The particles obtained under the other synthesis conditions presented morphology similar to that shown in Figure 2, consistent with the literature32,33 and showing that doping with nitrogen did not alter the morphology of the TiO2.
3.1.3 X-ray difraction
RTO-1, RTO-2, RTO-3 and RTO-4 samples presented only TiO2 anatase phase, discarding the method inluence in brookite formation.
TiO2 polymorphs depend on diverse factors such as crystallite size, size distribution and contact area of the powder crystallites. The transformation of brookite to rutile occurs by calcination at elevated temperatures, directly or via anatase.34 Watson et al. (2014), 35 airm that the formation of phase mixture between anatase and brookite is related to how the octahedral structure condensation in solution occurs. If three octahedral structures are bonded, a linear arrangement occurs and there is a tendency of rutile formation. If the octahedrons bond together at right angles, anatase formations occurs and when octahedron edge share a bond, anatase and brookite phase mixture occurs.35 Two main factors in the ionothermal synthesis could inluence in bond octahedral structures: reaction temperature and water presence. The syntheses of TO, RTO-1, RTO-4 and RTO-5 samples occurred in ambient temperature, inducing phase mixture formation. However, XRD pattern of RTO-1 did not show the presence of any brookite crystallographic peak. In this way, the formation of phase mixture was mainly inluenced by water presence, since the syntheses of TO, RTO-4, and RTO-5 were carried out in presence of high percentages of water compared to others samples. Hence,
it could be concluded that doping the TiO2 structure with nitrogen did not afect its crystalline structure.7,11
The XRD patterns were used to determine the crystallite sizes of the TiO2 anatase phase and N-TiO2, applying the Scherrer equation:
Figure 2. SEM images of diferent TiO2 samples at 100X magniication: (a) RTO-1, (b) RTO-2, (c) RTO-3.
Figure 3. XRD patterns of diferent TiO2 samples. (A) Relux syntheses: (a) TO, (b) ATO-1, and (c) ATO-2; (B) autoclave syntheses: (a) TO, (d) RTO-2, (e) RTO-4, (f) RTO-5, and (g) RTO-6.
( )
cos
D
K
2
b
i
m
=
where D is the size of the crystal grain, K is a dimensional constant (0.9), 2θ is the difraction angle employed, λ is the wavelength of the X-ray radiation (0.15418 nm), and is the width at half height of the difraction peak (FWHM). The values of and θ were determined by means of the crystalline plane (101) of the anatase phase, corresponding to the most intense peak. The crystallite sizes of the standard TiO2 and the N-TiO2 samples are presented in Table 2.
Table 2. Crystallite sizes and band gaps of diferent photocatalysts.
Photocatalyst Crystallite size (nm) Band gap (eV)
TO 9.5 3.38
RTO-1 10.6 3.28
RTO-2 9.8 3.32
RTO-3 14.8 3.22
RTO-4 10.9 3.28
RTO-5 8.7 3.35
RTO-6 6.4
ATO-1 15.2 3.15
ATO-2 13.5 3.19
ATO-3 15.2 3.16
were slightly larger than obtained using relux, with a value of 15.2 nm being very close to the value of 15.4 nm found by Peng et al. (2008),7 where doping of TiO
2 was performed in an autoclave at 140 °C for 24 h.
3.1.4 Raman spectroscopy
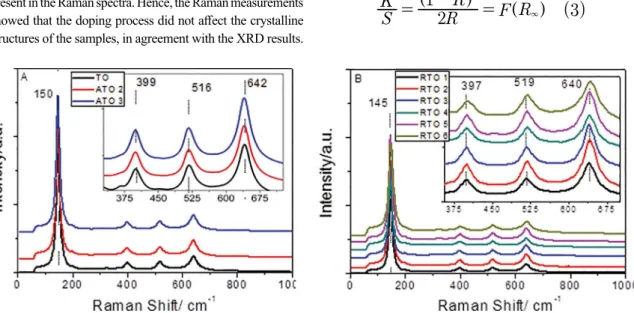
The Raman spectra of the samples are shown in Figures. 4(a) and 4(b). The spectra obtained for samples TO, ATO-2, and ATO-3 conirmed the XRD results, with anatase as the predominant phase, as shown by bands located at 150, 399, 516, and 642 cm-1. Samples RTO-1 to RTO-6 also presented anatase as the predominant phase, with bands located at 145, 397, 519, and 640 cm-1.6,37 Despite the displacements of the bands, compared to the other samples, the Raman results supported the XRD measurements. The observed diferences could have been due to the sensitivity of the Raman technique to diferences in sample color. No diferences were found between the doped and undoped samples, and no rutile or brookite phase bands were present in the Raman spectra. Hence, the Raman measurements showed that the doping process did not afect the crystalline structures of the samples, in agreement with the XRD results.
Figure 4. (A) Raman spectra between 0 and 1000 cm-1. Insert: Raman spectra between 300 and 700 cm−1 of samples TO, ATO-2, and ATO-3. (B) Raman spectra between 0 and 1000 cm-1. Insert: Raman spectra between 300 and 700 cm−1 of samples 1, 2,
RTO-3, RTO-4, RTO-5, and RTO-6.
3.1.5 UV-vis difusive relectance spectroscopy
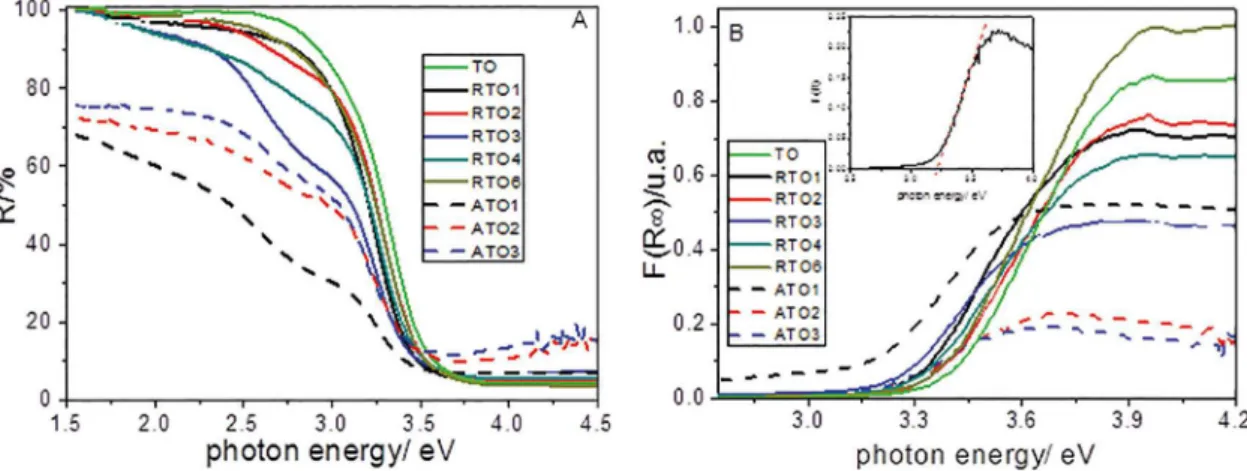
As shown in Figure 5(a), the DRS behavior of the samples could be directly related to the absorbance, with all the samples absorbing in the ultraviolet region at 200-400 nm (6.2 to 3.1 eV). The samples synthesized by the autoclave method (ATO-1, ATO-2, and ATO-3) showed greater absorption in this region. The RTO-3 sample showed an inlection region additional to the inlection related to the charge transfer energy barrier, in the region from 496 to 413 nm (2.5 to 3.0 eV), which could have been due to an energy level intermediate between the conduction band (CB) and the valence band (VB) of the semiconductor, caused by the doping process. This behavior was also observed for the samples synthesized in autoclave. The creation of an intermediate energy level could favor the photocatalysis process, due to the decreased band gap, although it could also hinder the same process, due to recombination of charges between the CB and the VB. In the visible region of the spectrum, from 400 to 700 nm (3.1 to 1.8 eV), the greatest absorption was shown by samples ATO-2 and ATO-3, indicating that there was an energy change after the doping process. The absorbance by the N-TiO2 samples in the visible light region is of considerable practical importance, because these materials could become photoactive when irradiated with sunlight.7 The values of band gap energy were determined from Figure 5(a) applying the Kubelka Munk function (Eq. (3)). UV-vis spectra in the difusive relectance mode (Figure 5(A)) were transformed to a magnitude proportional to the extinction coeicient (F) through Kubelka Munk function, which relates the scaterring (S) and the extinction coeicient with the relectance (R), according to Eq. (3).
( )
S
K
R
R
F R
2
1
3
2
=
-
=
3Q
Q
V
Figure 5. UV-vis difusive relectance spectra (A) and Kubelka Munk function (B) for the diferent samples.
Finally, in order to compare the diferent samples, all spectra were normalized. Figure 5(B) shows the Kubelka Munk function results for the diferent samples. The values obtained (Table 1) were similar to those reported in the literature (3.2 eV).7 The TO sample showed the greatest band gap, as expected because it was not doped. The RTO-6 sample exhibited a band gap higher than other samples due the presence of brookite phase (phase mixture anatase/ brookite). The samples synthesized by the autoclave method (ATO-1, ATO-2, and ATO-3) showed the smallest values. This narrowing of the band energy could be attributed to the efective incorporation of N in the TiO2 structure, since there was clear evidence of the diferent behaviors of these materials in terms of the absorption of visible light radiation. The results were therefore indicative of enhanced performance in photocatalytic processes.33
3.1.6 X-ray photoelectron spectroscopy (XPS)
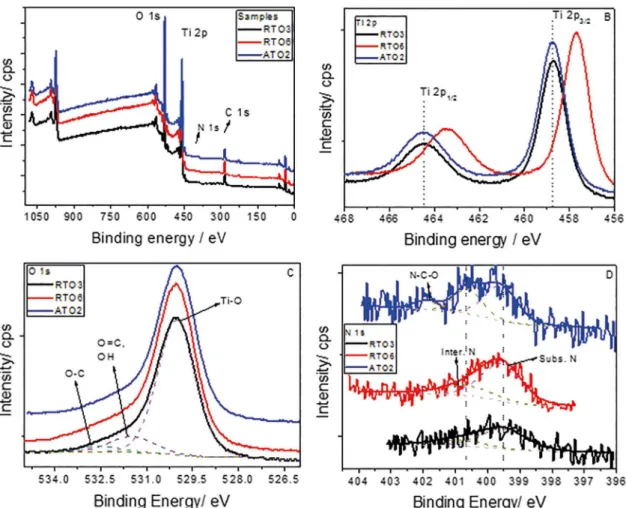
The inluence of the synthesis method on the chemical composition of the doped samples was investigated using XPS survey spectra and high resolution Ti 2p, O 1s and N 1s spectra (Figure 6). Only samples RTO-3, RTO-6, and ATO-2 were used in this analysis to conirm the incorporation of N and identify diferences between the two synthesis methods. For all the samples, the survey spectra showed the presence of the elements Ti, O, and C, although the corresponding peaks were not pronounced, due to lower quantities of N. The Ti 2p spectra (Figure 6(a)) showed that all the doped samples presented two main peaks, attributed to the Ti (2p1/2) and Ti (2p3/2) transitions, with binding energies shifted towards 464.47-463.43 eV and 458.69-457.68 eV, respectively.37 The Ti signal for the RTO-6 sample was shifted towards lower energies, compared to the other samples, indicating a modiication in the chemical environmental, such as the presence of Ti-O-N bonds.6 The Ti signals were similar for the RTO-3
and ATO-2 samples, indicative of diferences between the RTO-3 and RTO-6 synthesis conditions. However, when RTO-3 was compared with ATO-2, the bulk structure and the Ti bonds were maintained, despite the very diferent synthesis conditions, and the doping process did not lead to diferences in the chemical environments of the two samples. Comparison of the O 1s spectra for the doped samples revealed no notable diferences. The spectra were itted using a Gaussian model and presented three main peaks for all the samples. The peak with lower binding energy (around 530 eV) was associated with Ti–O bonds. The intermediate binding energy peak (around 531 eV) was attributed to O=C bonds or O–H adsorbed at the sample surface, and the highest binding energy peak was assigned to O–C bonds. The presence of C bonds in the samples was due to the methods used to synthesize the samples and prepare them for the XPS analysis. However, there were no signiicant shifts of any of the O 1s peaks, conirming that the diferent synthesis and doping methods did not modify the O chemical environment in the doped samples.
Figure 6. (a) XPS spectra of the RTO-3, RTO-6 and ATO-2 samples; (b) high-resolution Ti 2p XPS spectra; (c) high-resolution O 1s XPS spectra; (d) high-resolution N 1s XPS spectra.
of substitutional and interstitial N could lead to improved photocatalytic performance.
3.2 Photocatalytic activity
Prior investigating the photocatalytic activity, the RNO was tested towards photolysis, in absence of the photocatalyst, and the photocatalysts were tested towards adsorption, in absence of light. It was veriied that neither RNO photolysis nor adsorption had inluence on the photocatalytic process, even after four hours experiment. In order to compare the photocatalytic activity with TO or P25, only the photocatalysts showing the best bleaching kinetics under UV and visible were chosen (Figs. 7 and 8).
3.2.1 Relux syntheses
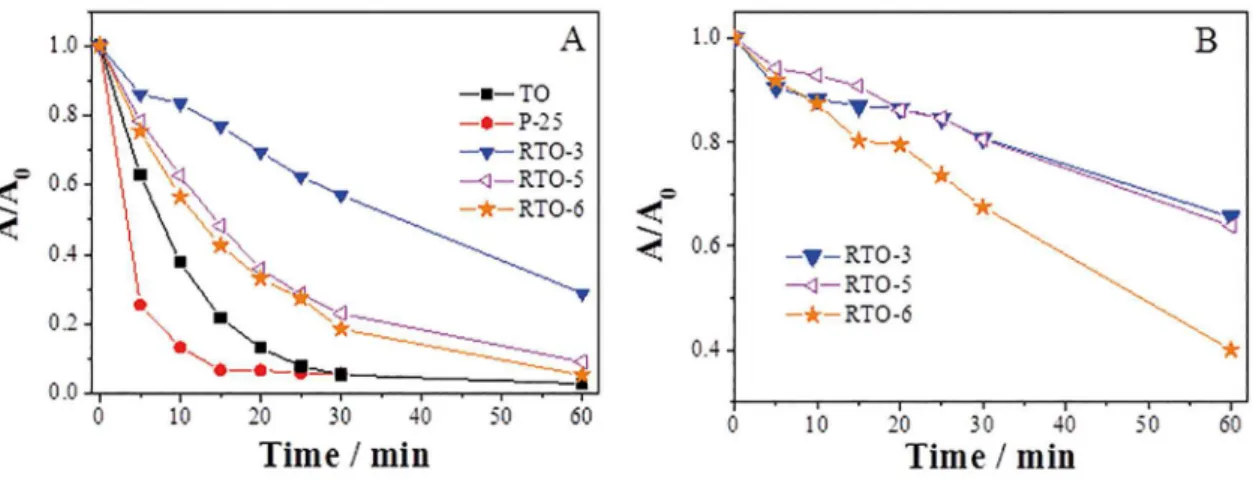
Figure 7 shows the photodegradation of RNO under illumination with (a) UV and (b) visible light. Under UV irradiation, the photocatalytic activities of the 1, RTO-2, and RTO-4 samples were much lower, compared to the other samples (not shown).
Experiments performed with the P25 under UV (Figure 7a) revealed far greater decoloration (k = 0.23937 min-1, R2 = 0.9992) than achieved with the materials produced in the present work, which could be explained by the smaller size of the P25 particles, and consequently the greater illuminated area. Furthermore, the smaller particle size facilitated dispersion in the solution, which also contributed to an increased illuminated area. The average diameter of the P25 particles is 50 nm,31 while the photocatalysts synthesized using EU contained a high number of particles with diameters in the region of 100 μm (Figure 1). The indings demonstrated the importance of taking into consideration the particle size, and consequently the area illuminated, in analysis of the photocatalytic activities of diferent materials. In light of this, TiO2 was therefore synthesized without doping, in an aqueous medium (TO), in order to obtain a reference material whose average particle diameter was close to that of the doped materials, hence enabling better comparison between the doped and undoped titanium dioxide.
Figure 7. Photocatalytic behavior of RNO oxidation with diferent photocatalysts prepared by relux syntheses using (A) UV and (B) visible radiation (250 mg of catalyst; initial concentration of RNO = 2.0 x 10⁻⁵ mol L-1).
Figure 8. Photocatalytic behavior of RNO oxidation with diferent photocatalysts prepared by autoclave syntheses using (A) UV and (B) visible radiation (250 mg of catalyst; initial concentration of RNO = 2.0 x 10⁻⁵ mol L-1).
decoloration was observed for the TO photocatalyst, Figure 7(a) (k = 0.09852 min-1, R2 = 0.9892). As in the case of P25, this result could be explained by the smaller average particle diameter (50 nm) of the material, as previously discussed. Hence, an efective comparison could only be made between the photocatalysts synthesized by the ionothermal route, which showed similar PSD values. An important conclusion is that ionothermal synthesis produced photocatalysts with larger particles than obtained in an aqueous medium.
It can be seen from Figure 7A that only samples produced by ionothermal synthesis in presence of water and lower temperatures exhibit photocatalytic activity under UV illumination. Hence, it can be concluded that the samples presenting the phase mixture of anatase/brookite were more efective than anatase single phase for RNO degradation. The photocatalysis under visible illumination showed also the inluence of phase mixture, with only phase mixture presenting photocatalytic activity. Pan and Jiang (2016)38 showed that nitrogen doped brookite nanorods with active
the interstitial N. It is important to consider that interstitial N was not related to decrease of the band gap.
The better result obtained using RTO-6 under visible light was clearly associated with the incorporation (by doping) of substitutional N in the TiO2 structure, as shown from comparison of the XPS spectra for RTO-3 and RTO-6 (Figure 6(d)). The band gap was greater for RTO-6, compared to RTO-3, although difuse relectance analysis of RTO-3 (Figure 5(a)) showed the possible existence of intermediate energy levels between VB and CB. This could assist the process of recombination between photogenerated electrons and holes, hence decreasing the photocatalytic eiciency.
3.2.2 Autoclave syntheses
Figure 8 shows the results for decoloration of RNO performed with the photocatalysts prepared using an autoclave. In contrast to the syntheses under relux, in this case it was not necessary to add water to the reaction medium in order to obtain photoactive catalysts and, consequently, only TiO2 anatase single phase were promoted. ATO-2 and ATO-3 showed similar photocatalytic responses under UV and visible light, with slightly higher activity for ATO-2. The ATO-1 showed very low photocatalytic activity under UV, and no activity in the visible region. Once again, the photocatalytic activity of ATO-2 in the visible region could be attributed to the N incorporated into the crystalline network of the TiO2, as shown in Figure 6(d). The XPS results for ATO-2 conirmed that both the substitutional N and the ratio between substitutional and interstitial N were of great importance for the eiciency of the photocatalytic process, since the same sample showed similar amounts of the two types of N. The difuse relectance results for the samples synthesized by the autoclave method showed evidence of additional energy levels between CB and VB, indicative of the possible existence of electron/hole pair recombination centers in these samples under UV illumination. Hence, the lower band gap value obtained for the ATO-1 was not necessarily indicative of greater eiciency in the photocatalysis under UV light.
The ATO-2 showed better eiciency under visible light, which could have been due to the smaller band gap value, compared to the ATO-3, indicating that the energy levels generated by the doping could contribute to enhanced photocatalysis under irradiation at greater wavelengths. However, compared to the samples synthesized by reluxing, the excessive increase of the eutectic mixture in the reaction medium led to a decrease in photocatalytic activity. Besides the efect of N doping on visible activity, these results also revealed the crystallographic inluence on the photocatalytic activity. Autoclave samples did not present the phase mixture of anatase/brookite and, consequently, the photodegradation under visible light was lower than for relux samples.
3.2.3 Kinetic analysis
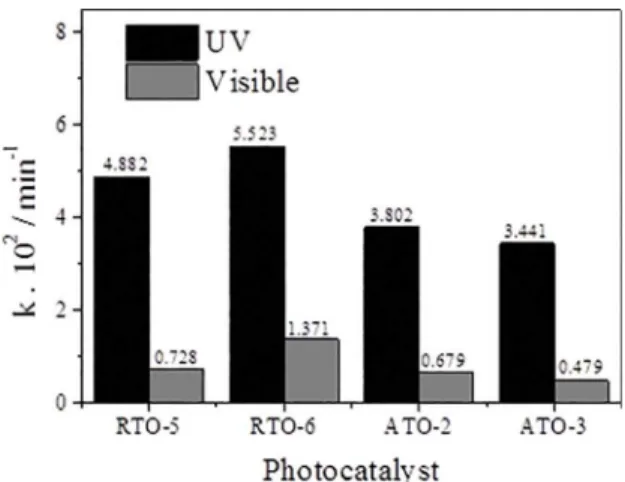
The plots of RNO decoloration against time for the samples that showed the best photocatalytic activities (shown in Figures. 7 and 8) were itted using a pseudo-irst order kinetic model. Exponential regression using the Marquardt-Levenberg method was used to determine the irst order kinetic constants (k), shown in Figure 9. In all cases, the R2 values exceeded 0.992.
Figure 9. Pseudo-irst order rate constants for the photocatalysts
showing the best RNO decoloration performance (250 mg of catalyst;
initial concentration of RNO = 2.0 x 10⁻⁵ mol L-1).
In the case of relux samples presenting the phase mixture, the N doping in brookite enhanced the photocatalytic activity in UV and visible light when compared to samples containing only the anatase phase. Moreover, it was recently reported that brookite doped with N exhibited remarkably enhanced visible-light photoactivity.38
4. Conclusion
Nitrogen-doped TiO2 was obtained by ionothermal synthesis performed using relux and autoclave methods. Characterization using XPS and other techniques conirmed that doping of these new materials was achieved. Moreover, the photocatalysts synthetized by the relux ionothermal method lead to higher photocatalytic activity due to doping in the phase mixture anatase/brookite.
Positive results were obtained in the removal of RNO under irradiation with both UV and visible light, although the eiciencies achieved were limited by the large sizes of the synthesized particles, compared to the standard materials used.
The indings should lead to new possibilities for the synthesis of TiO2 doped with nitrogen using techniques that are inexpensive, easy to perform, and employ reagents that are less harmful to the environment.
5. Acknowledgement
The authors are grateful to CNPq for inancial support. A. R. F. Pipi and G. Byzynski acknowledges CNPq (Grant 151166/2014-5) and FAPESP (Grant 2015/04511-5), respectively, for their post-doctorate awards.
6. References
1. World Health Organization. Health risks of persistent organic pollutants from long-range transboundary air pollution.
Copenhagen: World Health Organization; 2003. 224 p. 2. Appenzeller BMR, Tsatsakis AM. Hair analysis for biomonitoring
of environmental and occupational exposure to organic pollutants: State of the art, critical review and future needs.
Toxicology Letters. 2012;210(2):119-140. DOI: 10.1016/j. toxlet.2011.10.021.
3. Maldonado MI, Passarinho PC, Oller I, Gernjak W, Fernández P, Blanco J, et al. Photocatalytic degradation of EU priority
substances: A comparison between TiO2 and Fenton plus photo-Fenton in a solar pilot plant. Journal of Photochemistry and Photobiology A: Chemistry. 2007;185(2-3):354-363. DOI: 10.1016/j.jphotochem.2006.06.036.
4. Fujishima A, Rao TN, Tryk DA. Titanium dioxide photocatalysis. Journal of Photochemistry and Photobiology C: Photochemistry Reviews. 2000;1(1):1-21. DOI: 10.1016/ S1389-5567(00)00002-2.
5. Sun H, Wang S, Ang HM, Tadé MO, Li Q. Halogen element modiied titanium dioxide for visible light photocatalysis.
Chemical Engineering Journal. 2010;162(2):437-447. DOI: 10.1016/j.cej.2010.05.069.
6. Dawson M, Soares GB, Ribeiro C. Inluence of calcination parameters
on the synthesis of N-doped TiO2 by the polymeric precursors method. Journal of Solid State Chemistry. 2014;215:211-218. DOI: 10.1016/j.jssc.2014.03.044.
7. Peng F, Cai L, Huang L, Yu H, Wang H. Preparation of
nitrogen-doped titanium dioxide with visible-light photocatalytic activity using a facile hydrothermal method. Journal of Physics and Chemistry of Solids. 2008;69(7):1657-1664. DOI: 10.1016/j. jpcs.2007.12.003.
8. Asahi R, Morikawa T, Ohwaki T, Aoki K, Taga Y. Visible-Light
Photocatalysis in Nitrogen-Doped Titanium Oxides. Science. 2001;293(5528):269-271. DOI: 10.1126/science.1061051.
9. Emeline AV, Zhang X, Jin M, Murakami T, Fujishima A. Application of a “Black Body” Like Reactor for Measurements of Quantum
Yields of Photochemical Reactions in Heterogeneous Systems.
Journal of Physical Chemistry B. 2006;110(14):7409-7413. DOI: 10.1021/jp057115f.
10. Fujishima A, Zhang X, Tryk DA. Heterogeneous photocatalysis:
From water photolysis to applications in environmental cleanup.
International Journal of Hydrogen Energy. 2007;32(14):2664-2672. DOI: 10.1016/j.ijhydene.2006.09.009.
11. Peng F, Cai L, Yu H, Wang H, Yang J. Synthesis and characterization
of substitutional and interstitial nitrogen-doped titanium dioxides with visible light photocatalytic activity. Journal of Solid State Chemistry. 2008;181(1):130-136. DOI: 10.1016/j. jssc.2007.11.012.
12. Senthilnathan J, Philip L. Photocatalytic degradation of lindane
under UV and visible light using N-doped TiO2. Chemical Engineering Journal. 2010;161(1-2):83-92. DOI: 10.1016/j. cej.2010.04.034.
13. Kim W, Tachikawa T, Kim H, Lakshminarasimhan N, Murugan
P, Park H, et al. Visible light photocatalytic activities of nitrogen and platinum-doped TiO2: Synergistic efects of co-dopants.
Applied Catalysis B: Environmental. 2014;147:642-650. DOI: 10.1016/j.apcatb.2013.09.034.
14. Lim J, Murugan P, Lakshminarasimhan N, Kim JY, Lee JS, Lee SH, et al. Synergic photocatalytic efects of nitrogen and
niobium co-doping in TiO2 for the redox conversion of aquatic pollutants under visible light. Journal of Catalysis. 2014;310:91-99. DOI: 10.1016/j.jcat.2013.05.014.
15. Premkumar J. Development of Super-Hydrophilicity on
Nitrogen-Doped TiO2 Thin Film Surface by Photoelectrochemical Method under Visible Light. Chemistry of Materials. 2004;16(21):3980-3981. DOI: 10.1021/cm049055g.
16. Kitano M, Funatsu K, Matsuoka M, Ueshima M, Anpo M. Preparation
of Nitrogen-Substituted TiO2 Thin Film Photocatalysts by the
Radio Frequency Magnetron Sputtering Deposition Method and
Their Photocatalytic Reactivity under Visible Light Irradiation.
17. Tachikawa T, Takai Y, Tojo S, Fujitsuka M, Irie H, Hashimoto K,
et al. Visible Light-Induced Degradation of Ethylene Glycol on Nitrogen-Doped TiO2 Powders. Journal of Physical Chemistry B. 2006;110(26):13158-13165. DOI: 10.1021/jp0620217.
18. Guo Y, Zhang XW, Weng WH, Han GR. Structure and properties of nitrogen-doped titanium dioxide thin ilms grown by
atmospheric pressure chemical vapor deposition. Thin Solid Films. 2007;515(18):7117-7121. DOI: 10.1016/j.tsf.2007.03.012.
19. Imao T, Horiuchi T, Noma N, Ito S. Preparation of new photosensitive TiO2 gel ilms using chemical additives including nitrogen and their patterning. Journal of Sol-Gel Science and Technology. 2006;39(2):119-122. DOI: 10.1007/s10971-006-7286-1.
20. Venkatachalam N, Vinu A, Anandan S, Arabindoo B, Murugesan V.
Visible Light Active Photocatalytic Degradation of Bisphenol-A Using Nitrogen Doped TiO2. Journal of Nanoscience and Nanotechnology. 2006;6(8):2499-2507. DOI: 10.1166/jnn.2006.531.
21. Brugnera MF, Rajeshwar K, Cardoso JC, Zanoni MVB. Bisphenol A removal from wastewater using self-organized TIO2 nanotubular array electrodes. Chemosphere. 2010;78(5):569-575. DOI: 10.1016/j.chemosphere.2009.10.058.
22. Feil AF, Migowski P, Schefer FR, Pierozan MD, Corsetti RR, Rodrigues M, et al. Growth of TiO2 nanotube arrays with simultaneous Au nanoparticles impregnation: photocatalysts for hydrogen production. Journal of the Brazilian Chemical Society. 2010;21(7):1359-1365. DOI: 10.1590/S0103-50532010000700023.
23. Ayi AA, Khare V, Strauch P, Girard J, Fromm K, Taubert A.
On the chemical synthesis of titanium nanoparticles from ionic liquids. Monatshefte für Chemie - Chemical Monthly. 2010;141(12):1273-1278. DOI: 10.1007/s00706-010-0403-4.
24. Nagaraju G, Ravishankar TN, Manjunatha K, Sarkar S,
Nagabhushana H, Goncalves R, et al. Ionothermal synthesis of TiO2 nanoparticles: Photocatalytic hydrogen generation. Materials Letters. 2013;109:27-30. DOI: 10.1016/j.matlet.2013.07.031.
25. Cooper ER, Andrews CD, Wheatley PS, Webb PB, Wormald P, Morris RE. Ionic liquids and eutectic mixtures as solvent and template in synthesis of zeolite analogues. Nature. 2004;430:1012-1016. DOI: 10.1038/nature02860.
26. Zhai Y, Gao Y, Liu F, Zhang Q, Gao G. Synthesis of nanostructured
TiO2 particles in room temperature ionic liquid and its photocatalytic performance. Materials Letters. 2007;61(28):5056-5058. DOI: 10.1016/j.matlet.2007.04.002.
27. Martins AC, Fernandez-Felisbino R, Ruotolo LAM. Ionothermal
synthesis of aluminophosphates used for ion exchange:
Inluence of choline chloride/urea ratio. Microporous and Mesoporous Materials. 2012;149(1):55-59. DOI: 10.1016/j. micromeso.2011.08.033.
28. Carvalho MM, Ruotolo LAM, Fernandez-Felisbino R. Synthesis
of aluminophosphate by the ionothermal method using factorial design. Microporous and Mesoporous Materials. 2013;165:163-167. DOI: 10.1016/j.micromeso.2012.08.020.
29. Ohtani B, Prieto-Mahaney OO, Li D, Abe R. What is Degussa (Evonik) P25? Crystalline composition analysis, reconstruction
from isolated pure particles and photocatalytic activity test.
Journal of Photochemistry and Photobiology A: Chemistry. 2010;216(2-3):179-182. DOI: 10.1016/j.jphotochem.2010.07.024.
30. Hatada M, Kraljic I, El Samahy A, Trumbore CN. Radiolysis and
photolysis of the hydrogen peroxide-p-nitrosodimethylaniline-oxygen system. Journal of Physical Chemistry. 1974;78(9):888-891. DOI: 10.1021/j100602a008.
31. Nawi MA, Zain SM. Enhancing the surface properties of the immobilized Degussa P-25 TiO2 for the eicient photocatalytic removal of methylene blue from aqueous solution. Applied Surface Science. 2012;258(16):6148-6157. DOI: 10.1016/j. apsusc.2012.03.024.
32. Ananpattarachai J, Kajitvichyanukul P, Seraphin S. Visible
light absorption ability and photocatalytic oxidation activity of various interstitial N-doped TiO2 prepared from diferent nitrogen dopants. Journal of Hazardous Materials. 2009;168(1):253-261.
DOI: 10.1016/j.jhazmat.2009.02.036.
33. Reddy PAK, Reddy PVL, Sharma VM, Srinivas B, Kumari VD, Subrahmanyam M. Photocatalytic Degradation of Isoproturon Pesticide on C, N and S Doped TiO2. Journal of Water Resource
and Protection. 2010;2(3):10. DOI: 10.4236/jwarp.2010.23027.
34. Di Paola A, Bellardita M, Palmisano L. Brookite, the Least Known TiO2 Photocatalyst. Catalysts. 2013;3(1):36-73. DOI: 10.3390/catal3010036.
35. Watson S, Beydoun D, Scott J, Amal R. Preparation of nanosized
crystalline TiO2 particles at low temperature for photocatalysis.
Journal of Nanoparticle Research. 2004;6(2):193-207. DOI: 10.1023/B:NANO.0000034623.33083.71.
36. Sathish M, Viswanathan B, Viswanath RP, Gopinath CS. Synthesis, Characterization, Electronic Structure, and Photocatalytic
Activity of Nitrogen-Doped TiO2 Nanocatalyst. Chemistry of Materials. 2005;17(25):6349-6353. DOI: 10.1021/cm052047v.
37. Soares GB, Bravin B, Vaz CMP, Ribeiro C. Facile synthesis of
N-doped TiO2 nanoparticles by a modiied polymeric precursor method and its photocatalytic properties. Applied Catalysis B: Environmental. 2011;106(3-4):287-294. DOI: 10.1016/j. apcatb.2011.05.018.
38. Pan J, Jiang SP. Synthesis of nitrogen doped faceted titanium