ISSN 0104-6632 Printed in Brazil
www.abeq.org.br/bjche
Vol. 33, No. 03, pp. 503 - 513, July - September, 2016 dx.doi.org/10.1590/0104-6632.20160333s20150123
Brazilian Journal
of Chemical
Engineering
SYNTHESIS OF PROPYLENE FROM ETHANOL
USING PHOSPHORUS-MODIFIED HZSM-5
R. S. Costa and M. A. P. da Silva
*Escola de Química, Universidade Federal do Rio de Janeiro, Av. Athos da Silveira Ramos 149, Bloco E, Ilha do Fundão, CEP: 21941-909, Rio de Janeiro - RJ, Brazil.
Phone: (55) (21) 3938-7606, Fax: (55) (21) 3938-7567 E-mail: [email protected]
(Submitted: February 26, 2015 ; Revised: June 11, 2015 ; Accepted: June 18, 2015)
Abstract - Effects of phosphorus addition to HZSM-5 on ethanol conversion to propylene were evaluated. Catalysts were characterized by XRF, XRD, nitrogen adsorption, 27Al and 31P MAS NMR, n-propylamine and
ammonia TPD. Increasing P content decreased the strength and density of acid total sites. Ethanol dehydration was carried out in a fixed bed reactor operating at atmospheric pressure. Conversion was around 100% for all catalysts. 1.2 wt% of P catalyst showed the highest propylene yield, and was used to evaluate temperature and ethanol partial pressure effects on the product distribution. The highest propylene accumulated productivity was obtained for an ethanol partial pressure of 0.4 atm. Propylene formation was favored in the temperature range 475-500 °C. Significant changes in the product distribution as a function of time on stream were observed at higher temperatures, suggesting stronger catalyst deactivation. The ethylene yield decreased up to 500 °C, rising significantly at 550 °C, possibly due to heavier product cracking reactions.
Keywords: Ethanol; HZSM-5; Phosphorous.
INTRODUCTION
The growing demand for clean and sustainable technologies has led to the development of a new concept known as bioeconomy. In this context bio-refining is defined as the sustainable processing of biomass into a spectrum of marketable products and energy (Morais and Bogel-Lukasik, 2013).
The current availability of bioethanol at low cost and the increasing price of olefins have changed the petrochemical ethylene world scenario. In markets with abundant agricultural resources such as China, Pakistan, India and Brazil, where the petrochemical industry is less developed, ethanol can be used to pro-duce ethylene, propylene, butadiene, and other prod-ucts (Centi and Santen, 2007). For instance, in Brazil, several industrial plants (Braskem, Dow Brasil and Solvay Indupa Brasil) are producing ethylene via catalytic dehydration of ethanol from fermentation of
sugarcane molasses (Lanzefame et al., 2014). Light olefins are produced primarily from steam cracking of naphtha and occupy a prominent place in the block of basic or first generation petrochemicals. Their importance is related to their gaseous nature, contributing to integration with other industrial seg-ments, in which second generation petrochemical products (plastics, fibers and intermediates for deter-gents) are in demand (Tsunoji et al., 2014). Pyrolysis of naphtha is the most widely used process for ob-taining a ratio of propylene/ethylene of about 0.5. Therefore, a propylene deficit over time is inevitable. The U.S. Chemical Market Association (CMAI) esti-mated the annual growth of propylene consumption around 5%. This increase is due to growing demand of polypropylene, acrylonitrile, propylene oxide and other petrochemical products (Nawaz et al., 2009).
chemi-Brazilian Journal of Chemical Engineering cal industry that uses ethanol as a raw material for
manufacturing various chemicals (Takahashi et al., 2012).
Development of catalysts and processes to increase the propylene/ethylene ratio is essential to meet the propylene demand. Therefore, the produc-tion of propylene from ethanol has attracted con-siderable attention. The use of zeolites in catalytic conversion of ethanol has been reported by several authors, in particular the use of HZSM-5 for this kind of reaction (Takahashi et al., 2012; Inaba et al., 2006; Lu and Liu, 2011; Barros et al., 2007; Duan et al., 2012; Vu et al., 2010; Song et al.,2010; Ramesh
et al., 2009).
The acidity of HZSM-5 leads to a variety of prod-ucts via oligomerization reactions, particularly aro-matic compounds, causing coke deposition and catalyst deactivation (Takahashi et al., 2012; Inaba et al., 2006; Lu and Liu, 2011; Barros et al., 2007; Song
et al., 2010; Ramesh et al., 2009). To reduce the
den-sity and strength of acid sites of HZSM-5, an increase in SiO2/Al2O3 (Inaba et al., 2006; Song et al., 2010;
Blasco et al.,2006), phosphorus addition (Takahashi
et al., 2012; Lu and Liu, 2011; Ramesh et al., 2009;
Song et al., 2010; Barros et al., 2007; Vu et al., 2010; Zhao et al., 2007) and metals impregnation (Inaba et al., 2006; Blasco et al.,2006) are current alternatives.
The benefits of phosphorus incorporation into HZSM-5 regarding higher selectivity to olefins, and the improving of hydrothermal stability are well established (Takahashi et al., 2012; Lu and Liu, 2011; Ramesh et al., 2009; Song et al., 2010).
The aim of this study was to evaluate the effects of phosphorus incorporation into HZSM-5 on ethanol conversion to light olefins, especially to propylene.
EXPERIMENTAL
A commercial HZSM-5 (SiO2/Al2O3 molar ratio =
24) was impregnated with a phosphoric acid aqueous solution (SIGMA-ALDRICH). This procedure was based on Zhao et al. (2007). Water was slowly evapo-rated from the suspension in a rotary evaporator at 70 °C under vacuum. Then, catalysts were dried at 100 °C for 24 h and calcined at 500 °C (1°C/min) for 1 h. The amount of phosphorus, expressed as weight percent of P, ranged from 0.8 to 3.2. Samples were designated as xPHZSM-5, where x is the phosphorus content (wt %).
The chemical composition of catalysts was evalu-ated by X-ray fluorescence (XRF) using a Rigaku RIX 3100 spectrometer. Catalyst textural properties were quantified by physical adsorption of N2 at -196 °C
on a Micromeritics TriStar 3000 equipment. Samples
were pretreated at 300 °C under vacuum for 18 h. X-ray diffraction (XRD) patterns were obtained with a diffractometer (Rigaku Miniflex) using CuK radia-tion (λ = 1.5417 Å, 30 kV, 15 mA, 0.05 °/s).
Temperature programmed desorption of n-prop-ylamine (n-propn-prop-ylamine-TPD) was carried out in a TPD/TPR 2900 (Micromeritics) equipment, coupled to a mass spectrometer model OMNISTARTM 422 (Pfeiffer). The catalysts were pretreated in situ at 500 °C (10 °C/min) for 1 h with He. The sample was then exposed to pulses of n-propylamine in He at room temperature. After saturation, samples were submitted to helium flow (20 mL/min) for 30 min at room temperature and then heated up to 200 °C at a heating rate of 5 °C/min under the same flow rate of helium in order to remove physisorbed n-propylamine. Finally, the n-propylamine-TPD experiment was car-ried out in the range 200-500 °C (5 °C/min) and kept at this temperature for 2 h using He (20 mL/min). The mass fragment m/e = 41 (propylene) was analyzed.
Analysis of the temperature programmed desorp-tion of ammonia (NH3-TPD) was carried out in a
multipurpose unit. The sample was pretreated in flowing He (30mL/min) at 500 °C (10 °C/min) for 1 hour. Then temperature was lowered to 100 °C and treated with a 4% mixture of NH3/He (30 mL/min)
during 30 min. After NH3 adsorption, the sample was
flushed with He (30 mL/min) for 30 min at 100 °C. Finally, the NH3-TPD experiment was carried out
in the range of 100- 800 °C (5 °C/min) using He (30 mL/min). The mass fragment m/e = 15 was ana-lyzed by a mass spectrometer.
Solid-state magic angle spinning nuclear mag-netic resonance (MAS NMR) experiments were performed on a Bruker Avance 400 spectrometer, at room temperature and 9.4 Tesla. 27Al MAS NMR
and 31P MAS NMR spectra were obtained at 15 and 14 kHz, respectively. Each 27Al spectrum resulted
from 2048 scans, at intervals of 0.5 s; each 31P spec-trum resulted from 128 scans, at intervals of 60 s. The
27
Al chemical shifts were referenced to Al(H2O)63+
while the 31P were referenced to an aqueous solution
of H3PO4 (85%).
pro-pylene yield as suggested by Schulz and Bander-mann (1994), Inaba et al. (2006), Song et al. (2010) and Duan et al. (2012).
Samples of reactor effluent were taken after the first 15 min of reaction and, afterwards, in intervals of 71 min. The reactor effluent was analyzed online by an Agilent 6890 gas chromatograph equipped with flame ionization and thermal conductivity detectors, using a HP-PLOT/Q column (30 m, 0.53 mm).
The yield (Yi) of products and the instantaneous
productivity of propylene (IPP) were calculated by the following equations:
i
mass of ethanol consumed toform the product Y
mass of fed ethanol i
(1)
p WHSV P E
IPP Y E f M / M (2)
where EWHSV represents the space velocity of ethanol
and was defined as the ratio of the mass flow rate of ethanol to catalyst mass, Yp is the propylene yield, f
is the stoichiometric molar ratio of propylene to ethanol (2/3), Mp is the molar mass of propylene, and
Me is the molar mass of ethanol.
RESULTS AND DISCUSSION
Catalyst Characterization
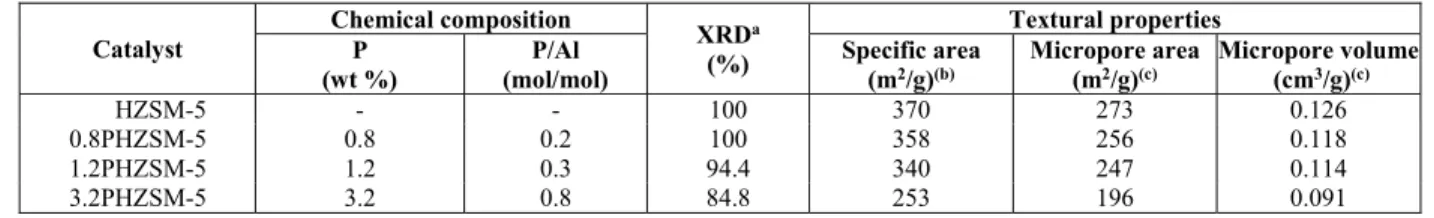
The chemical composition, the relative crystal-linity and the textural properties of the calcined catalysts are listed in Table 1.
As shown, the P content of HZSM-5 is approxi-mately the aimed value. XRD profiles (Figure 1), suggest that parent HZSM-5 sample was a typical material corresponding to the MFI structure and no additional phases were found for all catalysts. Addi-tion of phosphorus caused a slight reducAddi-tion on rela-tive crystallinity. This decreased XRD crystallinity could be due to framework defects caused by dealu-mination as reported in literature (Tavan et al., 2014; Lu and Liu, 2011; Zhao et al., 2007).
Textural properties of catalysts showed that spe-cific surface area, micropore area and micropore volume decreased with the increase in phosphorus content. This effect could be associated to formation of species containing phosphorus which would block or destroy the porous structure of zeolite. Our results confirm the findings of Gou et al. (2014), Tavan et al. (2014), Hodala et al. (2014), Ramesh et al. (2009), Blasco et al. (2006), Barros et al. (2007) and Zhao et al. (2007).
Table 1: Chemical composition, relative crystallinity and textural properties of catalysts.
Catalyst
Chemical composition
XRDa
(%)
Textural properties P
(wt %)
P/Al (mol/mol)
Specific area (m2/g)(b)
Micropore area (m2/g)(c)
Micropore volume (cm3/g)(c)
HZSM-5 - - 100 370 273 0.126
0.8PHZSM-5 0.8 0.2 100 358 256 0.118
1.2PHZSM-5 1.2 0.3 94.4 340 247 0.114
3.2PHZSM-5 3.2 0.8 84.8 253 196 0.091
a relative crystallinity;b BET method; c t-plot method
10 20 30 40 50 60
HZSM-5 0.8PHZSM-5 1.2PHZSM-5
Int
ens
it
y (
a.u.)
2
3.2PHZSM-5
Brazilian Journal of Chemical Engineering NH3-TPD profiles of the parent HZSM-5 and
P-modified HZSM-5 samples are shown in Figure 2. All samples showed three desorption peaks: the first one at temperatures lower than 310 °C (weak acid sites), the second at temperatures between 310 and 590 °C (moderate strength acid sites) and the third peak at temperatures higher than 590 °C (strong acid sites).
Furthermore, Figure 2 shows that the desorption peaks shifted slightly to lower temperatures as the phosphorus content increased, suggesting that the strength and total acid site density decreased, espe-cially the strong ones. Similar results were reported in the literature (Hodala et al., 2014; Takahashi et al., 2012; Lu and Liu, 2011; Song et al., 2010; Vu et al., 2010; Li et al., 2010; Ramesh et al., 2009; Zhao et al., 2007; Lercher and Rumplmayr, 1986). The addi-tion of P up to 1.2 wt. % decreased the strength of weak and strong acid sites, while the addition of 3.2 wt. % decreased markedly the strength of strong acid sites. The total density of acid sites slowly decreased up to 0.8 wt.% of P, but this reduction was more pronounced for higher phosphorous content. The
addition of 1.2 wt. % of P reduced the total acid site density by approximately 64 %, while for 3.2PHZSM-5 the reduction was around 80% as compared to HZSM-5 (see Table 2). These results are similar to those of Caeiro et al. (2006) and Lu and Liu (2011). Hodala et al. (2014) verified by TPD-NH3 that stronger
acid sites were replaced with weaker ones after phos-phate modification.
Figure 3 shows n-propylamine-TPD profiles of the calcined catalysts. This technique is used for measuring the Brönsted acid density and is based on formation of alkylammonium ions (from adsorbed alkyl amines that are protonated by Brönsted sites) which decompose to ammonia and olefins in a well-defined temperature range via a reaction similar to the Hofmann-elimination (Kresnawahjuesa et al., 2002). According to Figure 3, Brönsted acidity decreases with the addition of phosphorus. Ramesh et al. (2009) reported that impregnation of H3PO4 on HZSM-5
promotes modification of surface acidity, decreasing density and strength of acid sites. This modification of surface acidity can be attributed to a partial dealumination and/or formation of species P-O-Al.
200 400 600 800 1000 1200
800oC
541oC
N
H3
de
sorp
ti
o
n
(a
.u
.)
Isothermal
Temperature (oC)
309oC (a)
200 400 600 800 1000 1200
(b)
800oC
486oC
N
H 3
de
sorpt
ion
(a
.u.)
Temperature (oC)
288oC
Isothermal
200 400 600 800 1000 1200
(c)
Isothermal
N
H3
de
sorpt
ion (a
.u.)
Temperature (oC)
476oC
270oC
773oC
200 400 600 800 1000 120
(d)
Isothermal 603oC
469oC
287oC
N
H3
d
es
orp
ti
on (a
.u.)
Temperature (oC)
Figure 2: NH3-TPD profiles of HZSM-5 (a), 0.8PHZSM-5 (b), 1.2PHZSM-5 (c) and
250 300 350 400 450 500 3.2PHZSM-5
1.2PHZSM-5
0.8PHZSM-5
HZSM-5
P
rop
yl
en
e de
so
rpt
ion
(a
.u.
)
Temperature (ºC)
Figure 3: Calcined catalysts n-propylamine-TPD profiles.
The catalysts’ acid properties measured by NH3
-TPD and n-propylamine--TPD are listed in Table 2. Phosphorus addition to HZSM-5 caused a decrease in the total acid site density. It also appears that the decrease in strong acid sites density was greater than that observed for weak acid sites, as reported previ-ously (Takahashi et al., 2012; Lu and Liu, 2011; Ramesh et al., 2009; Song et al., 2010; Vu et al., 2010; Li et al., 2010; Zhao et al., 2007; Lercher and Rumplmayr, 1986).
Phosphorous loading of HZSM-5 decreased the total density of acid sites as well as their acid strength (Takahashi et al., 2012; Lu and Liu, 2011; Ramesh et al., 2009; Song et al., 2010; Barros et al., 2007; Lecher and Rumplayr, 1986). Note that the total den-sity of acid sites measured by NH3-TPD decreased
significantly with P addition. However, the addition of phosphorus resulted in a minor modification in the density of Brönsted acid sites.
Lercher and Rumplmayr (1986) showed that adding H3PO4 to HZSM-5 might convert strong
Brönsted acid sites to weak ones, without altering the acid-base properties in general. However,
Lisch-ke et al. (1991) reported a decrease in the density of
Brönsted acid sites as a result of interaction of H3PO4 with the framework hydroxyl groups of
HZSM-5.
Figure 4 shows 27Al MAS NMR spectra of
HZSM-5 and phosphorus modified HZSM-HZSM-5 (xPHZSM-HZSM-5). The spectrum of the calcined parent zeolite presents two peaks. The intense peak at 60 ppm is ascribed to tetrahedral Al species (Altet) inside the zeolite
framework, and another one at 3.4 ppm is typical of extra-framework octahedral Al species (Aloct), as
re-ported by Zhao et al. (2007) and Blasco et al. (2006). Similar spectra are obtained for the xPHZSM-5 cata-lysts, but the peak of Aloct appears now in the region
of -3 and -7 ppm. A broad peak becomes evident at 36-40 ppm, related to distorted tetrahedral aluminum species (Aldist-tet) and/or penta-coordinated
alumi-num. Gou et al. (2014), Zhao et al. (2007) and Blasco et al. (2006) also observed these peaks.
Table 2: Acid properties of calcined catalysts.
Catalyst Total acid (µmol/m2)
Total acid (µmol/g)
Acid strength distribution (µmol/g [%])
Brönsted acid (µmol/m2)
Brönsted acid (µmol/g) Weak
T ≤ 310 °C
Moderate 310-590 °C
Strong T 590 °C
HZSM-5 5.33 1971 507 [26] 1132 [57] 331 [17] 0.98 364.5
0.8PHZSM-5 4.56 1631 463 [28] 670 [41] 499 [31] 0.95 339.5
1.2PHZSM-5 1.94 661 361 [55] 269 [41] 31 [5] 0.93 315.9
Brazilian Journal of Chemical Engineering
100 80 60 40 20 0 -20 -40 -60 -80
(a)
3,4 60
Int
ens
it
y (a
.u
)
ppm
100 80 60 40 20 0 -20 -40 -60 -80 (b)
-3 36 54
In
te
ns
it
y
(a
.u.)
ppm
100 80 60 40 20 0 -20 -40 -60 -80
(c)
-6 36
59
In
te
n
si
ty
(a
.u
.)
ppm
100 80 60 40 20 0 -20 -40 -60 -80
(d)
In
te
n
si
ty
(
a.u.)
ppm -7
40 60
Figure 4:27Al MAS NMR spectra of HZSM-5 (a), 0.8PHZSM-5 (b), 1.2PHZSM-5 (c)
and 3.2PHZSM-5(d).
Table 3 shows relative percentage of peaks pre-sent in the 27Al MAS NMR indicating that the rela-tive intensities of Aloct increased as the concentration
of phosphorus added to HZSM-5 increased; this behavior was also observed by Zhao et al. (2007). However, for Aldist-tet, the intensity increased up to
the catalyst with 1.2% P and then decreased. It can be seen that the framework SAR (SARf) increases
with increasing phosphorus concentration added to the HZSM-5. Partial dealumination of the HZSM-5 framework is due to phosphorus modification. How-ever, according to Gou et al. (2014) the extra-frame-work aluminum species can be transformed in alumi-num phosphates by interacting with phosphorus.
Table 3: Relative percentage of peaks present in
the 27Al MAS NMR.
Catalyst Altet
(%)
Aldist-tet
(%)
Aloct
(%)
SARf
HZSM-5 89 - 11 27
0.8PHZSM-5 52 28 20 45 1.2PHZSM-5 46 31 23 52 3.2PHZSM-5 31 16 53 77 According to the results, a linear relationship be-tween Altet and acidity measured by
n-propylamine-TPD (Figure 5) was obtained, agreeing with Caeiro
et al. (2006) and Menezes et al. (2006).
0 200 400 600 800 1000 1200 1400
0 50 100 150 200 250 300 350 400
P
ropy
le
n
e
(
m
ol
/gca
t
)
HZSM-5 0.8PHZSM-5 1.2PHZSM-5 3.2PHZSM-5
Altet (mol/gcat)
Figure 5: Relationship between Brönsted acidity
expressed as mol of propylene/gcat and Altet
concen-tration.
zeolite. However, phosphorus addition to zeolite in-creases the concentration of Aldist-tet, which can also
contribute to the zeolite acidity.
31P MAS NMR spectra of calcined catalysts are
illustrated in Figure 6.
50 0 -50 -100 -150
3.2PHZSM-5
1.2PHZSM-5
Int
en
si
ty
(a
.u.
)
ppm
0.8PHZSM-5
Figure 6:31P MAS NMR spectra of calcined catalysts.
Intense peaks are observed between 0 and -13 ppm. These can be attributed to P in pyrophosphoric acid, pyrophosphate or short chain polyphosphates. How-ever, Blasco et al. (2006) attributed the -13 ppm signal to intermediate groups in short chain polyphosphates or polyphosphates attached to Al (Ramesh et al., 2009; Caeiro et al., 2006). According to Ramesh et al. (2009), such polyphosphates could be responsible for blocking the pores of ZSM-5. This would explain the decrease of specific surface area with phosphorus addition to HZSM-5 (Table 1).
Peaks observed between -25 and -35 ppm were assigned to amorphous aluminum phosphate or mono-meric phosphate. The signal at -30 ppm was attributed to AlPO4 or (SiO)xAl(OP)4-x species and the increase
in phosphorus content raised the peak intensity of pyrophosphoric acid, as reported by Blasco et al. (2006) and Zhao et al. (2007).
Catalytic Tests
In most cases, conversion of ethanol was around 100% for all catalysts, but the product distribution depended on the content of phosphorus (Takahashi et al., 2012; Lu and Liu, 2011; Song et al., 2010). Etha-nol was converted to ethylene, propylene, C1-C3
paraffins, hydrocarbons with 4 carbons, hydrocar-bons with 5 carhydrocar-bons and hydrocarhydrocar-bons with more than 6 carbons.
Figure 7 presents the instantaneous productivity of propylene (IPP) as a function of time on stream (TOS) at 500 °C with an ethanol partial pressure of 0.4 atm for calcined catalysts.
0 1 2 3 4
0 2 4 6 8 10
HZSM-5 0.8PHZSM-5 1.2PHZSM-5 3.2PHZSM-5
IP
P
(gC
3
H6
/h.g
ca
t)
TOS (h)
Figure 7: Instantaneous productivity of propylene
(500 °C; pEtOH = 0.4 atm; gcat = 0.025 g; total flow rate
= 40 mL/min).
As shown, the instantaneous productivity of pro-pylene increased with higher P contents, reaching a maximum value at 1.2 wt %, and then decreasing sharply. Besides that, catalysts 1.2PHZSM-5 and HZSM-5 presented, respectively, the lower and higher sensitivity over time. 3.2 wt % of P practically sup-pressed the formation of propylene. These results suggest that acidity plays an important role in the formation of propylene and that moderate surface acidity is fundamental to increase its productivity (Barros et al., 2007, Song et al., 2010).
According to Inaba et al. (2006), ethylene and C4
olefins formed by ethanol dehydration at elevated temperatures can favor other reactions such as oligomerization, aromatization, hydrogen transfer or cracking reactions to form propylene, butenes and higher paraffins. Song et al. (2010) concluded that these reactions are promoted by strong acid sites and that a decrease of acidity by added phosphorus di-rectly affects the density of sites, increasing the yield of lights olefins.
Takahashi et al. (2012) evaluated the effects of phosphorus incorporation to HZSM-5 (SiO2/Al2O3=
80) on ethanol conversion at 550 °C. They found that a catalyst with P/Al = 0.5 presented the highest yield in propylene. For higher values of P/Al, the pro-pylene yield decreased gradually. Lu and Liu (2011) also investigated the effects of phosphorus on HZSM-5 (SiO2/Al2O3= 20). They obtained the highest yield
of propylene for P/Al = 0.95. For higher values of P/Al, propylene and ethylene yield decreased and increased, respectively, at 450 °C.
Brazilian Journal of Chemical Engineering al. (2012), Lu and Liu (2011), Song et al. (2010) and
Ramesh et al. (2009).
It is worth mentioning that the best P/Al ratio for the formation of propylene differs from one work to another since it depends on experimental conditions such as temperature, ethanol partial pressure, space velocity and type of phosphorus precursor used in the impregnation. Lu and Lui (2011) and Takahashi
et al. (2012) used, respectively, (NH4)3PO4, and
(NH4)2HPO4 as phosphorous precursors, while in this
work H3PO4 was used as a precursor. Blasco et al.
(2006) reported that the decrease in acidity of ZSM-5 was stronger for the samples modified with H3PO4 as
compared to samples modified by NH4H2PO4 for the
same ratio P/Al.
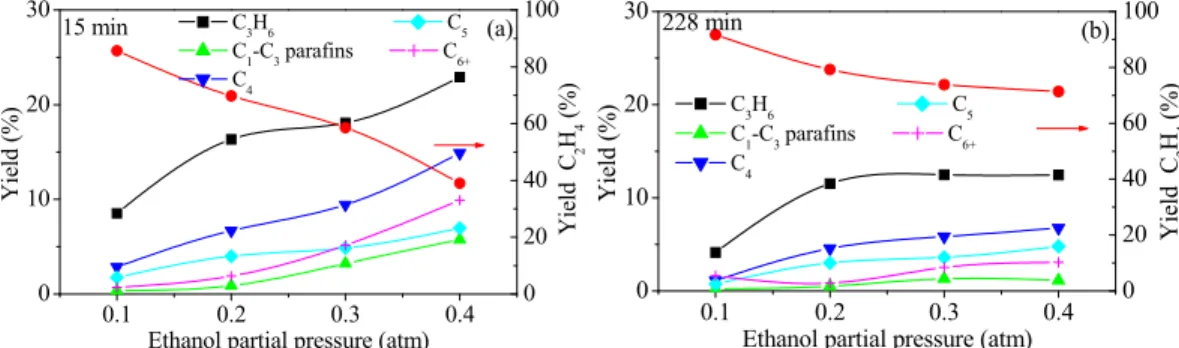
Another concern of this work regarded the effects of ethanol partial pressure on ethanol conversion and the product distribution over 1.2PHZSM-5. Figure 8 illustrates this fact as a function of ethanol partial pressure for 1.2PHZSM-5 after 15 and 228 minutes of reaction, respectively. For the first 15 minutes, an increase in ethanol partial pressure favored the for-mation of propylene and other products from hydro-gen transfer and oligomerization reactions. After 228 minutes, for ethanol partial pressure values above 0.2 atm, the propylene yield stabilized around 12%.
Schulz and Bandermann (1994) studied the effects of ethanol partial pressure on the product distribution over HZSM-5 and found that an increase in ethanol partial pressure decreased the yield of olefins while increasing that of aromatic compounds. Similar re-sults can be observed in Figure 8(b).
Figure 9 illustrates the product distribution as a function of temperature after 15 and 228 minutes, re-spectively. Figure 9(a) shows that, for 15 minutes, the propylene yield increased slightly with increas-ing temperature up to 500 °C, decreasincreas-ing at higher temperatures. However, the ethylene yield
de-creased with increasing temperature up to 500 °C, then increased for higher temperatures. As shown in Figure 9(b), at 550 °C the main product was eth-ylene, while other products decreased over time. The most significant change in the product distribution versus time was observed at 550 °C, suggesting that at this temperature more intense catalyst deactiva-tion occurred.
According to Song et al. (2010), ethanol conver-sion to propylene is promoted by oligomerization, hydrogen transfer, isomerization and aromatization reactions. However, a temperature increase favors the formation of long chain products from propylene, decreasing its concentration. Ethylene is clearly the only product observed at 400 °C because, at this tem-perature, ethylene is formed by ethanol intramolecu-lar dehydration (Inaba et al., 2006). However, the in-crease in ethylene yield at 550 °C is due to the secondary cracking reactions, which are favored at higher temperatures, where the long chain compounds are able to form lighter ones. This behavior was also observed by Duan et al. (2012).
Figure 10 shows the profiles of the cumulative amount of propylene (CAP) formed as a function of cumulative amount of fed ethanol (CAFE) for 1.2PHZSM-5 with different ethanol partial pressures in the range of 450 to 550 °C. The dashed lines in Figure 10 correspond to extrapolations based on ex-ponential functions fitted to the data. This strategy enabled the comparison of the cumulative amount of propylene formed and fed ethanol, for each diagram shown.
According to these results, an ethanol partial pres-sure of 0.4 atm shows the highest CAP for all tempera-tures, except for 450 °C, at which CAP was favored by an ethanol partial pressure of 0.1 atm. The CAP values at 475 and 500 °C at a partial pressure of 0.4 atm were very near, but the greatest value occurred at 500 °C.
0.1 0.2 0.3 0.4
0 10 20 30
C3H6 C5 C1-C3 parafins C6+ C
4
Y
ie
ld
(
%
)
Ethanol partial pressure (atm)
0 20 40 60 80 100 (a) 15 min
Y
ie
ld
C
2
H4
(%)
0.1 0.2 0.3 0.4
0 10 20 30
C
3H6 C5 C
1-C3 parafins C6+ C4
Y
ie
ld
(
%
)
Ethanol partial pressure (atm)
0 20 40 60 80 100 (b) 228 min
Y
ie
ld
C
2
H4
(%
)
Figure 8: Distribution of products as function of the ethanol partial pressure, 1.2PHZSM -5: (a)
450 475 500 525 550 0
20 40 60 80 100
(a)
15 min C2H4 C4
C3H6 C5 C1-C3 parafins C6+
Y
ie
ld
(
%
)
Temperature (oC)
450 475 500 525 550
0 20 40 60 80 100
(b) 228 min
C2H4 C4 C3H6 C5 C1-C3 parafins C6+
Y
ie
ld (%
)
Temperature (oC)
Figure 9: Distribution of products as a function of temperature, 1.2PHZSM-5: (a) after 15 min,
(b) after 228 min (pEtOH = 0.4 atm; gcat = 0.025g; total flow rate = 40mL/min).
0 50 100 150 200 250 300
0 5 10 15 20 25 30 35
CAFE (gEtOH/gcat)
CA
P
(
g C
3
H6
/g ca
t
)
0.1 atm 0.2 atm 0.3 atm 0.4 atm
(a)
0 50 100 150 200 250 300
0 5 10 15 20 25 30 35
CAFE (g
EtOH/gcat)
CA
P
(g
C3 H6
/g ca
t
)
0.1 atm 0.2 atm 0.3 atm 0.4 atm
(b)
0 50 100 150 200 250 300
0 5 10 15 20 25 30 35
CAFE (gEtOH/gcat)
CA
P
(
g C
3
H6
/g ca
t
)
(c) 0.1 atm
0.2 atm 0.3 atm 0.4 atm
0 50 100 150 200 250 300
0 5 10 15 20 25 30 35
CA
P
(g
C3 H6
/g ca
t
)
CAFE (gEtOH/gcat)
0.1 atm 0.2 atm 0.3 atm 0.4 atm
(d)
Figure 10: Cumulative amount of propylene formed versus cumulative amount of fed ethanol
for 1.2PHZSM-5: (a) 450 °C, (b) 475 °C, (c) 500 °C (d) 550 °C, (gcat = 0.025 g; total flow rate =
40 mL/min)
CONCLUSIONS
In evaluating the effect of adding phosphorus to HZSM-5, one observes the reduction of specific area and of density of total acid sites and Brönsted sites. The increase in concentration of Aloct and Aldist-tet as a
function of phosphorus addition to HZSM-5 was
established. The 31P MAS NMR analysis showed that
the concentration of pyrophosphate increased with increasing phosphorus content, while the concentra-tion of polyphosphates decreased. A linear relaconcentra-tion- relation-ship between Brönsted acidity expressed as mol propylene/gcat and the amount of Altet, which depends
Brazilian Journal of Chemical Engineering content of phosphorus incorporated into HZSM-5
affected the productivity of propylene and the best performance was achieved for the 1.2PHZSM-5. The catalyst 3.2PHZSM-5 presented the lowest produc-tivity in propylene due to its reduced acidity, favor-ing only ethanol dehydration. The increase of ethanol partial pressure favored the formation of propylene under the tested conditions. Regarding the effect of temperature on ethanol conversion over 1.2PHZSM-5, it was concluded that, for temperatures close to 400 °C the intramolecular dehydration of ethanol is favored, giving predominantly ethylene. Propylene yield reached its maximum in the range of 475-500 °C and at 550 °C the formation of ethylene was prioritized due to secondary cracking reactions at high tem-peratures. On the basis of the results achieved in this work, and restricted to the operational conditions used therein, the following strategy would maximize the propylene production: ethanol space velocity, 76 gEtOH /(gcat h), 500 °C and P/Al (0.3) molar ratio.
ACKNOWLEDGEMENTS
The authors acknowledge, NUCAT/PEQ/COPPE/ UFRJ, Laboratório Multiusuário RMN de sólidos/ IQ/UFRJ and GreenTec/EQ/UFRJ for characteriza-tion analyses of the catalysts.
REFERENCES
Barros, Z. S., Zotin, F. M. Z. and Henriques, C. A., Conversion of natural gas to higher valued products: Light olefins production from methanol over ZSM-5 zeolites. Stud. Surf. Sci. Catal., 67, 255 (2007).
Blasco, T., Corma, A. and Martinez-Triguero, J., Hydrothermal stabilization of ZSM-5 catalytic-cracking additives by phosphorus addition. J. Catal., 237, 267 (2006).
Caeiro, G., Maagnoux, P., Lopes, J. M., Ramôa Ri-beiro, F., Menezes, S. M. C., Costa, A. F. and Cer-queira, H. S., Stabilization effect of phosphorus on steamed H-MFI zeolites. Appl. Catal., A, 314, 160 (2006).
Centi, G. and Santen R. A., Catalysis for Renewa-bles. S. Pariente, N. Tanchoux, F. Fajula, G. Centi, S. Perathoner, Ed., Wiley-VCH Verlag GmbH and Co. KGaA, Weinheim, 9, p. 183-205 (2007). Duan, C., Zhang, X., Zhou, R., Hua, Y., Zhang, L.
and Chen, J., Comparative studies of ethanol to propylene over HZSM-5/SAPO-34 catalysts pre-pared by hydrothermal synthesis and physical
mixture. Fuel Process. Technol., 108, 31 (2012). Gou, M-L., Wang, R., Qiao, Q. and Yang, X., Effect
of phosphorus on acidity and performance of HZSM-5 for the isomerization of styrene oxide to phenylacetaldehyde. Appl. Catal., A, 482, 1 (2014). Hodala, J. H., Halgeri, A. B. and Shanbhag, G. V.,
Phosphate modified ZSM-5 for the shape selec-tive synthesis of para-diethylbenzene: Role of crys-tal size and acidity. Appl. Cacrys-tal., A, 484, 8 (2014). Inaba, M., Murata, K., Saito, M. and Takahara, I.,
Ethanol conversion to aromatic hydrocarbons over several zeolite catalysts. React. Kinet. Catal. Lett., 88(1), 135 (2006).
Kresnawahjuesa, O., Gorte, R. J., Oliveira, D. and Lau, L. Y., A simple, inespensive, and reliable method for measuring Brönsted-acid site densities in solid acids. Catal. Lett., 82, 155 (2002). Lanzafame, P., Centi, G., Siglinda, P., Evolving
sce-narios for biorefineries and the impact on cataly-sis. Catal. Today, 234, 2 (2014).
Lercher, J. A. and Rumplmayr, G., Controlled de-crease of acid strength by orthophosphoric acid on ZSM5. Appl. Catal., A, 25, 215 (1986).
Li, P., Zhang, W., Han, X. and Bao, Xi., Conversion of methanol to hydrocarbons over phosphorus-modified ZSM-5/ZSM-11 intergrowth zeolites. Catal. Lett., 134, 124 (2010).
Lischke, G., Eckelt, R., Jerschkewitz, H.-G., Parlitz, B., Schreier, E., Storek, W., Zibrowius, B. and Ohlmann, G., Spectroscopic and physicochemical characterization of P-modified H-ZSM-5. J. Catal., 132, 229 (1991).
Lu, J. and Liu, Y. J., Effects of P content in a P/HZSM-5 catalyst on the conversion of ethanol to hydrocarbons. J. Natural Gas Chem., 20, 162 (2011).
Menezes, S. M. C., Lam, Y. L., Damodaram, K. and Ppruski, M., Modification of H-ZSM-5 zeolites with phosphorous. 1. Identification of aluminum species by 27Al solid-state NMR and characteriza-tion of their catalytic properties. Microporous Mesoporous Mater., 95, 286 (2006).
Morais, A. R. C., Bogel-Lukasik, R., Green chemis-try and the biorefinery concept. Sustain. Chem. Process, 1(18), 1 (2013).
Nawaz, Z., Tang, X. and Wei, F., Hexene catalytic cracking over 30% SAPO-34 catalyst for propyl-ene maximization: Influence of reaction condi-tions and reaction pathway exploration. Braz. J. Chem. Eng., 26, 705 (2009).
Schulz, J. and Bandermann, F., Conversion of ethanol over zeolite H-ZSM-5. Chem. Eng. Technol., 17, 179 (1994).
Song, Z., Takahashi, A., Nakamura, I. and Fujitani, T., Phosphorus-modified ZSM-5 for conversion of eth-anol to propylene. Appl. Catal., A, 384, 201 (2010). Takahashi, A., Xia, W., Nakamura, I., Shimada, H.
and Fujitani, T., Effects of added phosphorus on conversion of ethanol to propylene over ZSM-5 catalysts. Appl. Catal., A, 423-424, 162 (2012). Tavan, Y., Nikou, M. R. K. and Shariati, A., Effect of
the P/Al ratio on the performance of modified HZSM-5 for methanol dehydration reaction. J. Ind. Eng. Chem., 20, 668 (2014).
Tsunoji, N., Sonoda, T., Furumoto, Y., Sadakene, M. and Sano, T., Reacreation of Brönsted acid sites in phosphorus-modified HZSM-5(Ga) by modifi-cation with various metal modifi-cations. Appl. Catal., A, 481, 161 (2014).
Vu, D. V., Hirota, Y., Nishiyama, N., Egashira, Y. and Ueyama, K. J., High propylene selectivity in methanol-to-olefin reaction over H-ZSM-5 catalyst treated with phosphoric acid. J. Jpn. Petrol. Inst., 53, 232 (2010).