The determinants of length of stay of
tourists in the Azores
ANTÓNIO GOMES DE MENEZES, ANA MONIZ AND JOSÉ CABRAL VIEIRA University of Azores and CEEAplA, Rua da Mãe de Deus, 9501-801 Ponta Delgada,
Portugal. E-mail: [email protected]; [email protected]; [email protected].
This paper examines the determinants of the length of stay of tourists in the Azores. It is found that socio-demographic profiles, such as nationality and Azorean ascendancy, and trip attributes, such as repeat visitation rates and type of flight, are important determinants. In addition, destination image and attitudes regarding environmental initiatives, constructed from a factor analysis exercise, also influence the length of stay. In particular, the results suggest that marketing strategies which promote the Azores for its nature, landscape, remoteness and weather may increase length of stay, whereas cultural heritage has the opposite effect.
Keywords: length of stay; tourism demand modelling; destination
image; environmental initiatives; factor analysis; Azores
JEL classification: C14, D12, L83
The overall impact of tourists in a given economy hinges on length of stay. Length of stay is an important determinant of, for instance, tourists’ overall expenditure and consumption of local resources as the number of possible experiences that can be undertaken by tourists depends on their length of stay (Davies and Mangan, 1992; Legoherel, 1998; Saarinen, 2006; Gokovali et al, 2007). Uncovering the determinants of length of stay is critical to the design of marketing policies that promote longer stays, associated with higher occupancy rates and revenue streams: an enterprise ever more valuable given the increasingly pervasive pattern of shorter lengths of stay (Alegre and Pou, 2006). However, there are relatively few studies that estimate the determinants of length of stay resorting to microeconometric techniques (Gokovali et al, 2007). This paper helps fill this gap. In particular, it uncovers how different individual socio-demographic profiles, actual trip experiences, attitudes toward sustainability practices (or environmental initiatives) and destination image influence length of stay. Length of stay is one of the questions resolved by tourists when planning, or while taking their trips (Decrop and Snelders, 2004). Hence, length of stay is best recorded when tourists depart and, quite likely, is influenced by tourists’ socio-demographic profiles, on the one hand, and their
T E
experiences while visiting their destination, as well as by their expectations and concomitant reported destination image, on the other (Decrop and Snelders, 2004; Bargeman and Poel, 2006). This paper accounts for such insights by employing microdata, rich on individual socio-demographic characteristics, actual trip experiences and reported destination image, built from individual surveys answered by a representative sample of tourists departing from the Autonomous Region of the Azores: the Portuguese tourist region with the highest growth rate in the last decade.
Destination image has aroused much interest in recent years. In fact, several authors have investigated the relationship between destination image and tourists’ behaviour (see, among others, Pike, 2002; Hui and Wan, 2003; Beerli and Martín, 2005; Castro et al, 2007; Chen and Tsai, 2007). In the present case, it is interesting to note that the Azorean government has been actively promoting brand awareness in the sense that the Azores are an infant holiday destination. Hence, it has been investing in promoting the Azores as a house-hold name on the economic rationale that promotion is akin to a public good. It is, therefore, most pertinent to assess how various marketing strategies that convey different images of the Azores as a holiday destination influence an important dimension of tourists’ behaviour, that is, length of stay. Thus, this paper contributes to the literature on the relationship between destination image and tourists’ behaviour, focusing on the influence of destination image on length of stay, hence complementing the aforementioned studies that focus, in turn, on the influence of destination image on overall satisfaction, repeat behaviour and recommendation intentions.
The small island nature of the Azores warrants deserved attention to environmental initiatives that seek to promote the sustainability of the Azores as a tourist destination. The Azorean government, like many other regional governments, has put in place a mix of ‘carrot and stick’ policies with respect to the adoption of sustainability practices by tourist facilities. Yet, little is known about the economic impacts of such recent policies, despite the vigour of the associated policy debate. This paper sheds light on this issue by uncovering the influence of a large number of sustainability practices on length of stay.
To uncover causal relationships between tourists’ socio-demographic characteristics, actual trip experiences, reported destination image, attitudes towards sustainability practices and length of stay, the empirical work must employ some sort of formal statistical model. However, the most popular statistical tools, such as the linear regression model, are not appropriate to model length of stay, since they do not take into account that length of stay is a non-negative variable and, hence, lead to biased estimation (Greene, 2000). To overcome such a problem, this paper employs survival analysis since length of stay is usually recorded as the number of nights spent at a given destination: a positive number. We capitalize on Gokovali et al (2007) with respect to the econometric approach and innovate by focusing on individual behaviour and by considering important, novel issues such as destination image and attitudes towards environmental initiatives.1
The empirical work carried out in this paper produced statistically significant and economically important results. Several socio-demographic individual characteristics and trip attributes turn out to be statistically important
determinants of length of stay, and thus carry important policy implications. More to the point, the results found in this paper may be used to aid the design of marketing policies that may promote longer stays. In addition, there are results that shed light on enduring research topics, such as repeat visitor behaviour. In fact, it should be noted that repeat visitors display higher probabilities of experiencing longer stays, a fact in line with the findings in Lehto et al (2004). By the same token, it is interesting to note that different dimensions and attributes of destination image influence length of stay differently. Therefore, the results found suggest that marketing policies may have different effects on length of stay, depending on the conveyed destination image.
This paper is organized as follows. Next is a review of the literature. The subsequent section describes the contextual setting and the data used in the econometric work. Then, the econometric model approach is discussed, followed by comments on the results. The final section concludes.
Literature review
Tourism demand is a broadly defined subject that considers a variety of objects: tourist arrivals, tourist expenditure, travel exports and length of stay, just to name some of the most important (for extensive reviews of research on tourism demand see, among others, Crouch, 1994; Witt and Witt, 1995; Lim, 1997; Crouch and Louviére, 2000; Song and Witt, 2000). Length of stay is an interesting research topic for, at least, two reasons. First, length of stay conditions the overall socio-economic impact of tourism in a given economy. In fact, and as Davies and Mangan (1992) argue, an increased length of stay may allow tourists to undertake a larger number of activities, which may affect their overall spending, sense of affiliation and satisfaction. Therefore, several authors consider length of stay an important market segmentation variable in estimating the determinants of tourist spending (Davies and Mangan, 1992; Legoherel, 1998; Mok and Iverson, 2000). Second, models of length of stay are important to the research on sustainable tourism since they are useful in forecasting tourists’ on-site time and, concomitantly, the stress on local resources caused by tourism activity: an important issue in the context of carrying capacity analysis (Saarinen, 2006).
Alegre and Pou (2006) claim that most studies on tourism demand fail to pay attention to length of stay, at least at a microeconometric level, where one is able to control for individual heterogeneous behaviour. Moreover, the few studies available in the literature on length of stay are mainly descriptive (Oppermannn, 1995, 1997; Seaton and Palmer, 1997; Sung et al, 2001). These studies show how length of stay varies with nationality, age, occupation status, repeat visit behaviour, stage in the family life cycle and physical distance between place of origin and destination, among other variables. While these studies do find interesting results, their descriptive nature hinders formal inference tests on the causal relationships between individual socio-demographic profiles and actual trip experiences and length of stay. Recently, however, some authors have employed microeconometric models to estimate the determinants of length of stay. Fleischer and Pizam (2002) employ a Tobit model to estimate
T E
the determinants of the vacation-taking decision process for a group of Israeli senior citizens. The Tobit model in Fleischer and Pizam overcomes the fact that several individuals in the study group do not take vacations at all and, thus, the model allows a corner solution case, with many individuals experiencing zero days of vacation. Fleischer and Pizam conclude that age, health status and income have a positive effect on the length of stay. In the present case, only departing tourists were surveyed and, hence, all tourists experienced a strictly positive length of stay. Therefore, the Tobit model, employed in Fleischer and Pizam, is not applicable. Alegre and Pou (2006) analyse length of stay for a pooled cross-section of tourists visiting the Balearic Islands. They employ a logit model, where the explanatory variable is binary (0 if length of stay is shorter than one week and 1 otherwise). By doing so, the ensuing policy implications are less far-reaching in the sense that all lengths of stay shorter than, say, one week are treated alike, be they one-day stays or six-day stays. This loss of information may be particularly worrisome when lengths of stay are not obviously dichotomized or clustered and are, instead, roughly evenly distributed over several days, leaving the researcher with no obvious cut-off to partition lengths of stay arbitrarily. In any event, Alegre and Pou find, among other results, that labour status, nationality and repeat visitation rate are statistically significant determinants of length of stay. Alternatively, several authors employ count data models successfully to study tourism demand. Smith (1988) employs count data models to estimate per trip consumer surplus for a sample of households in Pennsylvania. Hellerstein (1991) also employs count data models to estimate a county-level travel cost model, based on aggregate data from the state of Minnesota. More recently, Hellström (2006) estimates a bivariate count data model for household tourism demand with Swedish data to study house-holds’ joint choice of the number of leisure trips and the number of total nights spent on these trips. Palmer-Tous et al (2007) employ count models to estimate the demand for hire cars on the Spanish island of Mallorca. These authors assume that length of stay is a discrete variable. Alternatively, and as in this paper, Gokovali et al (2007) treat length of stay as a continuous variable and estimate, in a novel way, survival analysis models for a cross-section of tourists departing from the Turkish region of Bodrum and find that tourist experience, past visits to the destination, overall attractiveness and positive image of the destination country all increase the probability of staying longer. We capitalize on the innovative and informative work by Gokovali et al and, in turn, we ourselves innovate by considering a factor analysis exercise that reduces a wealth of information on destination image and satisfaction factors into an operational set of covariates.
Contextual setting and data
The Azores, with their strikingly beautiful nature and sea, are a Portuguese region where tourism has grown rapidly in the last decade. Tourist nights spent in tourist accommodations increased from 407,000 in 1995 to over 1,200,000 in 2006. Despite the obvious tourist growth potential, the Azorean regional government did not promote tourism until the early 1990s, and the Azores was trapped in an inferior Nash equilibrium with virtually no hotels and no air
connections. In the mid 1990s, a change in the Azorean regional government led to a change in tourism policy, with the adoption of tourism growth-enhancing policies, such as the provision of air connections and the promotion of brand awareness, which led to a boom in hotel construction, with the total number of hotel beds growing from 3,000 in 1995 to 10,000 in 2005 (data source: SREA statistical office, http://srea.ine.pt).
Traditionally, length of stay has been relatively short, explained mostly by the fact that the predominant tourists were from mainland Portugal, who routinely took regular flights, mostly over the weekend or around holidays, for short stays. Recently, length of stay has increased and is bound to increase even further in the near future as the tourist landscape changes. Nowadays, there are several charter carriers offering direct connections and tour packages to, among others, the Nordic countries (Sweden, Norway, Finland and Denmark), Germany, the UK, Spain and the Netherlands, where people keenly appreciate the Azorean pristine natural surroundings and year-round mild weather. Despite the recent successes, several challenges remain. Ranking high among the most pressing issues lays a desire by public officials and hotel operators to increase average length of stay, which is perceived as crucial to increase occupancy rates and make operations run smoother. Hence, learning the determinants of length of stay is critical to improve the effectiveness of regional tourism policy. In order to do so, it is important to uncover variables that not only explain length of stay, but also may be used in the design of marketing policies that effectively influence length of stay.
The questionnaire used to construct the data set employed in the empirical part of the paper was carried out in the summer of 2003 and was built as a representative sample of the tourists who visited the Azores, by nationality, routes and gateways used in 2002. The total number of questionnaires answered – 400 – was determined according to the methods discussed in Hill and Hill (2002). In the summer of 2003, there were three gateways – Ponta Delgada, Lajes, Horta – on the three main islands of São Miguel, Terceira and Faial, respectively. The questionnaires were carried out at these airports, near the boarding gates, through personal interviews in three languages: Portuguese, English and Swedish. Each questionnaire covered individual socio-demographic profiles – by including variables such as gender, age, education, occupation sector, type of profession and marital status, among others – and actual trip experiences – by including variables such as travel party composition, travel motive, repeat visitation rate, tourist experience, overall satisfaction and revisit intention, among others.
The questionnaire contained a detailed section that asked the tourist to rank the importance of a given sustainability practice or environmental initiative in the tourism industry as an integral part of a high-quality holiday experience. In particular, the interviewee was asked to rank each of a total of 24 factors or environmental initiatives on a Likert scale from 1 (not very important) to 5 (highly important), according to its importance for a quality holiday experience. Appendix 1 contains the list of the environmental initiatives considered in the questionnaire. The set of environmental initiatives included may be perceived as exhaustive, given Azorean natural idiosyncrasies, on the one hand, and relevant policies in place, on the other, and was defined along the lines found in Agenda 21: A Guide to the United Nations Conference on
T E
Environment and Development (UNCED, 1992), a manifesto that has shaped policy and research forcefully around the globe in recent years. As is usual in the literature, given the large number of dimensions and attributes included in the questionnaire pertaining to the importance of environmental initiatives and the quality of holiday experiences, a standard factor analysis exercise was carried out to collapse such wealth of information into a smaller, operational number of factors to be employed as right-hand-side covariates and, thus, save on degrees of freedom.2 The factor analysis exercise produced satisfactory results and
suggested the inclusion of the following three factor-based regressors regarding environmental initiatives: waste management; quality of environmental management; and water savings and tourists’ awareness (towards water savings). Finally, and in an analogous manner to environmental initiatives, the questionnaire also contained a detailed section on motives for destination choice and concomitant destination image. In particular, the interviewee was asked to rank each of a total of 25 potential reasons for choosing the Azores as his or her trip destination on a Likert scale from 1 (not very important) to 5 (highly important). The set of potential reasons for choosing the Azores as a trip destination can be thought of as extensive and is found in Appendix 2 (for a rich discussion on dimensions and attributes determining the perceived tourist destination image, see Beerli and Martín, 2005). Once more, a standard factor analysis exercise was carried out to collapse such wealth of information into a smaller, operational number of covariates to be employed in the regression and, hence, further save on degrees of freedom. The factor analysis exercise led to the inclusion of the following six factor-based regressors in our econometric model: cultural heritage; nature and landscape; availability of packages and flights; safety and hospitality; quality and price; and weather and ultra-periphery (remoteness). It should be noted that the Azores are an infant tourist destination and, not surprisingly, the Azorean government has been investing intensively in brand awareness, on the economic rationale of destination promotion being akin to a public good, with suboptimal private provision in a decentralized equilibrium. Therefore, and if one is interested in the socio-economic returns of such brand awareness investment in making the Azores a household name, it is important to assess how different marketing strategies (for example, one that highlights the uniqueness and remoteness of the Azores) influence length of stay.
Table 1 lists the highest frequencies of length of stay. As expected, the highest frequency is 7-day stays, typically associated with tourists visiting on tour operator packages, with an in-sample frequency of 28%. The combined frequency of 14- to 15-day stays is also quite high: about 20%. About half of the stays last no longer than 8 days.
Table 2 contains descriptive statistics of respondents’ socio-demographic profiles and trip attributes.
Overall, mean stay is about 11 days, median stay is just 10 days, while the standard deviation of stays is about 11 days, due to some quite long stays. The largest group of tourists in the sample are from mainland Portugal, who experience stays similar to those of the overall sample and are the youngest group. Tourists from the Nordic countries are the second largest group in the sample and exhibit a mean stay of 9 days, a median stay of 7 days and a relatively low standard deviation of 3 days, as most of these tourists visit with
Table 1. Distribution of length of stay.
Length of stay Observations Frequency Accum frequency
(days) (total = 400) (%) (%) 1 1 0.25 0.25 2 6 1.50 1.75 3 12 3.00 4.75 4 11 2.75 7.50 5 14 3.50 11.00 6 16 4.00 15.00 7 114 28.50 43.50 8 21 5.25 48.75 9 7 1.75 50.50 10 38 9.50 60.00 11 7 1.75 61.75 12 15 3.75 65.50 13 4 1.00 66.50 14 65 16.25 82.75 15 19 4.75 87.50 ≥16 50 12.50 100.00
Table 2. Selected descriptive statistics.
Variables Observations Frequency Average Median Sd Average
(%) stay stay stay age
(days) (days) (days) (years) (1) Socio-demographic profiles
Portugal (mainland) 150 37.50 11 10 11 34
Sweden 95 23.75 9 7 3 57
Other Nordic countries 49 12.25 9 7 3 47
Germany 21 5.25 14 8 24 41
Other countries 85 21.25 17 14 14 44
Male 203 50.75 11 8 11 44
Marital status (married) 264 66.00 11.8 9.5 12 49 Azorean ascendancy 70 17.50 18.7 15 13.2 43 Education1. Secondary 127 31.75 10.9 10 6.8 40 Education2. Tertiary 183 45.75 10.6 7 10.3 45 Education3. Technical 8 2.00 8.6 7 3 48 Education4. Lesser 82 20.5 16.8 13 17 47 High-level profession 127 31.75 10.2 8 6.5 48 (2) Trip attributes Leisure 294 73.50 10.6 8 8.6 45 Visit friends/relatives 57 14.25 17.4 15 14 44 Business 35 8.75 15.6 10 22 36 Other motive 14 3.50 8.5 6 6.2 37 Repeat visitor 141 35.25 16.5 14 16.7 41 Charter flight 150 37.50 11.2 7 6.9 52 Total 400 100.00 11 9 11 43
T E
either one- or two-week tour packages. German tourists typically experience longer stays than tourists from the Nordic countries. In sum, there are interesting differences in lengths of stay across nationalities. There is roughly the same number of male tourists in the sample as there is female tourists. More than half of the tourists in the sample are married (66%). A significant number of the tourists interviewed claimed to have some sort of Azorean ascendancy: 70 tourists, or 17.50% of the total. Most tourists in the sample have high levels of education. In fact, more than 45% of the tourists in the sample have tertiary education, which is perhaps not surprising given that these tourists tend to come from the Nordic countries, where tertiary education has relatively high incidence rates. This sample composition – with a high proportion of tourists exhibiting high education levels – suggests that compliance to environmental initiatives may, indeed, condition overall holiday experiences, as more educated tourists tend to be more sensitive towards such issues, especially in small, arguably fragile islands such as the Azores. High-level profession flags occupations associated with high income and status. Almost a third of the tourists in the sample have such high-level professions and tend to experience stays similar to the overall pattern, but with smaller variance. With respect to trip attributes, it should be noted that most tourists in the sample visited the Azores for leisure: 73.50%. Repeat visitors accounted for 35.25% of the tourists in the sample and reported a relatively high average stay of 16.5 days. Finally, tourists who took charter flights accounted for only 37.50% and experienced, on average, 11-day stays.
Econometric approach
As Hellerstein (1991) argues, estimators of recreational demand models frequently use continuous functional forms, such as ordinary least squares. However, the nature of trip demand introduces complicating factors. In particular, stays occur in non-negative quantities (usually, nights). Failure to control for this censoring will lead to biased estimation (Greene, 2000). In order to control for censoring and the positive nature of length of stay, the use of survival analysis is attractive (Gokovali et al, 2007).
Survival analysis is just another name for time-to-event analysis. The engineering sciences have contributed to the development of survival analysis, which is called ‘reliability analysis’ or ‘failure time analysis’ in this field, since the main focus is in modelling the time it takes for machines or electronic components to break down. Likewise, survival analysis has long been a corner-stone of biomedical research. The analysis of duration data comes fairly recently to the economics literature. Recently, economists have applied the same body of techniques to strike duration, length of unemployment spells, time until business failure and so on (for applications of survival analysis in economics, see, among others, Lancaster, 1990; Kiefer, 1998; Hosmer and Lemeshow, 1999; Greene, 2000).
There are certain aspects of survival analysis data, such as censoring and non-normality, which generate great difficulty when trying to analyse data using traditional statistical models such as multiple linear regressions. The variable of interest in the analysis of duration is the length of time that elapses between
the beginning of some event until either its end or until the measurement is taken, which may precede termination. Hence, it is sometimes the case that durations – so-called spells – are censored, in the sense that the researcher does not observe the termination of the event.
This framework of analysis naturally lends itself to the study of length of stay, as one is interested in the determinants of the length of time that elapses between a tourist’s arrival at a given tourist destination and his or her departure. The data set employed in the present article was collected at airports from tourists who were departing from their trips. Hence, there is no censoring in the data since all interviewees reported their length of stay. Therefore, the discussion that follows assumes away censoring.
Spell length is, by construction, a non-negative variable. Let spell length be represented by a random variable T, with continuous probability distribution f(t), where t is a realization of T. The cumulative probability function F(t) reads:
F(t) = ∫0tf(s)ds = Pr(T ≤ t). (1)
It is usually the case that one is interested in the probability that the spell is of a length of at least t, which is given by the survival function S(t):
S(t) = 1 – F(t) = Pr(T ≥ t). (2)
The hazard rate h(t), in turn, answers the following question: ‘Given that the spell has lasted until time t, what is the probability that it will end in the next short interval of time Δ?’ More formally:
h(t) = limΔ→0Pr(t ≤ T ≤ t + Δ|T ≥ t)/Δ (3)
= f(t)/S(t),
with f(t) being the probability density function. Intuitively, the hazard rate is the rate at which spells are completed after duration t, given that they last at least until t. Armed with the hazard rate, one computes the survival function through backward integration. Hence, and as a matter of convenience, one usually focuses on estimating the hazard function directly.
A popular model in survival analysis is the Cox proportional hazards (PH) model, where the covariates have a multiplicative effect on the hazard function, thus satisfying a separability assumption:
h(t,x) = h0 (t)exp(β1x1 + . . . + βkxk), (4) where h0(t) is the baseline hazard function. Intuitively, the baseline hazard
function h0(t) summarizes the pattern of duration dependence and is common
to all persons, while exp(x′β) is a non-negative function of the vector of covariates x, which scales the baseline hazard function common to all persons, hence controlling the effect of individual heterogeneity.
The PH property suggests that absolute differences in x imply proportionate differences in the hazard rate at each t. For some t = t, and for two persons i and j identical in all matters except with respect to the kth covariate, then a unit increase in the kth covariate induces the following proportionate change in the hazard rates:
T E
The above expression lends a natural interpretation to βk; namely, the log hazard ratio:
βk = ∂log h(t,x)/∂log xk, (6)
which is easily recognized as either a semi-elasticity or elasticity.
The baseline function h0(t) may be left unspecified, yielding the Cox’s PH model, or it may take a specific parametric distributional form, which, assuming that the correct distributional form is chosen, leads to more efficient estimates.
In the Cox model, the shape of the baseline is not specified, but rather the estimation procedure allows the data to determine the shape of the hazard function. Since duration dependence can be very sensitive to the specified form, the Cox model is preferred when there is any doubt about the shape of the function. Hence, and since there is virtually no empirical evidence on tourists’ length of stay (with Gokovali et al, 2007, being the notable exception), we take an agnostic approach and impose minimal parametric structure and estimate the Cox semi-parametric PH model.
Results
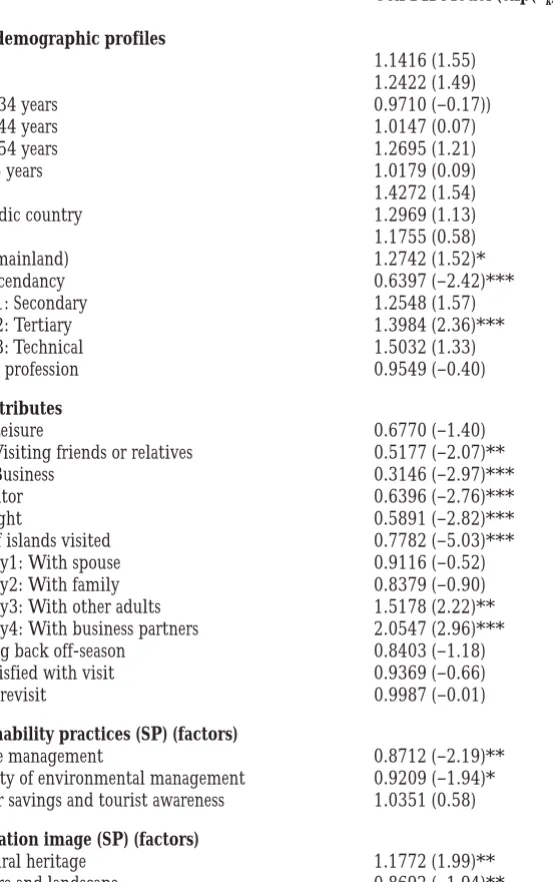
Model estimation is done via maximum likelihood, due to the semi-parametric nature of the Cox PH model. Stata v 9.0 was used in all calculations discussed below. Table 3 reports the results obtained from the Cox PH model. This model produces statistically significant results, as the χ² test of the null hypothesis of all coefficients being statistically equal to zero is firmly rejected. We note that Table 3 reports the hazard ratios and not the regression coefficients. In fact, the results are presented in PH form and the coefficients displayed may be interpreted as a hazard ratio. Intuitively, and focusing on binary variables, the coefficients presented are of the form eβk and represent the ratio between the hazard rate when the variable takes the value of 1 and the hazard rate when the variable takes the value of 0. Hence, a coefficient higher than one means that an increase in the associated covariate leads to an increase in the hazard rate and, thus, to a lower expected duration. We present robust standard errors, as discussed in Lin and Wei (1997).
There are four groups of regressors, for the sake of clarity of discussion. The first group pertains to the tourists’ socio-demographic profiles. The second group characterizes actual trip experiences. The third group relates to tourists’ reported importance of environmental initiatives to the overall quality of their holiday experience. Finally, the fourth group relates to tourists’ reported underlying motives for destination choice and concomitant to perceived destination image.
Socio-demographic profiles
Male tourists tend to experience shorter stays. Married tourists also tend to experience shorter stays. The age coefficients are not individually statistically significant. As Alegre and Pou (2006) suggest, this may be due to the inclusion of other covariates closely related with age.3 The excluded class is less than 25
Table 3. Regression results.
Variables Cox PH Model (exp(βββββk); t-stat)
(1) Socio-demographic profiles Male 1.1416 (1.55) Married 1.2422 (1.49) Age1: 25–34 years 0.9710 (–0.17)) Age2: 35–44 years 1.0147 (0.07) Age3: 45–54 years 1.2695 (1.21) Age4:≥ 55 years 1.0179 (0.09) Sweden 1.4272 (1.54)
Other Nordic country 1.2969 (1.13)
Germany 1.1755 (0.58) Portugal (mainland) 1.2742 (1.52)* Azorean ascendancy 0.6397 (–2.42)*** Education1: Secondary 1.2548 (1.57) Education2: Tertiary 1.3984 (2.36)*** Education3: Technical 1.5032 (1.33) High-level profession 0.9549 (–0.40) (2) Trip attributes Motive1: Leisure 0.6770 (–1.40) Motive2: Visiting friends or relatives 0.5177 (–2.07)** Motive3: Business 0.3146 (–2.97)*** Repeat visitor 0.6396 (–2.76)*** Charter flight 0.5891 (–2.82)*** Number of islands visited 0.7782 (–5.03)*** Travel party1: With spouse 0.9116 (–0.52) Travel party2: With family 0.8379 (–0.90) Travel party3: With other adults 1.5178 (2.22)** Travel party4: With business partners 2.0547 (2.96)*** Not coming back off-season 0.8403 (–1.18) Highly satisfied with visit 0.9369 (–0.66) Intends to revisit 0.9987 (–0.01)
(3) Sustainability practices (SP) (factors)
SP1: Waste management 0.8712 (–2.19)** SP2: Quality of environmental management 0.9209 (–1.94)* SP3: Water savings and tourist awareness 1.0351 (0.58)
(4) Destination image (SP) (factors)
DI1: Cultural heritage 1.1772 (1.99)** DI2: Nature and landscape 0.8692 (–1.94)** DI3: Availability of packages and flights 1.0389 (0.50) DI4: Safety and hospitality 0.9584 (–0.67) DI5: Quality and price 0.9785 (–0.24) DI6: Weather and ultra-periphery 0.8182 (–2.55)***
N 400
Log-likelihood –1993.3187
LRχ2(37) 121.16 (p-value = 0.000)
T E
years old and, overall, the results suggest that expected length of stay increases with age, reaching a peak for people between 45 and 54 years old, a result in line with Fleischer and Pizam (2002), who argue that middle-aged tourists tend to have time, resources and health that sustain longer stays.
Tourists from the Nordic countries, including Sweden, and German tourists experience shorter stays. These results have important policy implications given the strategical importance of these markets in the overall regional tourism policy context. Tourists from mainland Portugal are the largest group in the sample and exhibit shorter stays; a statistically significant result. Overall, the regression coefficients on nationalities do not follow any clear pattern, at least not according to the physical distance between a tourist’s place of origin and destination. In fact, ex ante one would imagine that tourists who live far away from the Azores would experience longer stays, to make up for the increased overall travel cost: the sum of travel time and on-site time-related costs. Hence, while it is indeed the case that tourists who live close to the Azores, such as tourists from mainland Portugal, do tend to experience shorter stays, when one controls for socio-demographic profiles and trip attributes, this pattern becomes less blunt. This is, indeed, the present case. In particular, it is found that the binary variable charter that equals 1 if the tourist took a (direct) charter flight (and 0 otherwise) significantly increases the length of stay; a statistically significant result. Considering that virtually all tourists from the Nordic countries took charter flights, it becomes less of a paradox that having a nationality from the Nordic countries is associated with shorter lengths of stay. The reverse could be said about tourists from mainland Portugal. This remark highlights the importance of controlling for a significant number of covariates. Azorean ascendancy is a binary variable that equals 1 in the case of tourists claiming to have some sort of Azorean ascendancy. The Azorean diaspora far outnumber the current Azorean population and there are many Azorean descendants, typically residing in North America, who visit the Azores. It is found that having an Azorean ascendancy increases the expected time to termination of stay. This result is statistically significant.
With respect to the education variables, it should be noted that the excluded class is other education, an education class associated with a lesser degree of education. Hence, it follows that higher levels of education are associated with shorter expected stays.
High-level profession is a binary variable that takes the value of 1 for professions associated with high income and social status. In this sense, high-level profession proxies top incomes.4 A high-level profession is associated with
shorter expected stays; a result with no statistical significance, however.
Trip attributes
Travel motive was divided into four classes: leisure; visiting friends or relatives; business; and the excluded class, other motives (which includes, for instance, religious festivities). It is found that, compared to the excluded class, all travel motives explicitly considered increased expected duration of stays. As Seaton and Palmer (1997) suggest, tourists visiting friends or relatives tend to exhibit longer stays if they are international tourists, as is generally the case in the Azores. Somewhat surprisingly, the hazard ratio associated with travel motive
business is quite low: about 0.3. In fact, among the several travel motives considered, the hazard ratio is lowest, by far, in an economic and statistical sense, for travel motive business.
Repeat visitor is a binary variable that takes the value of 1 if the tourist visited the Azores at least once in the past and 0 otherwise. Quite interestingly, it is found that repeat visitors stay for longer periods; a highly statistically significant result. In fact, all being equal, being a repeat visitor decreases the hazard rate by about 42%, to about 60% of the baseline value.
According to the results in Table 3, taking a charter flight increases expected stay as it decreases the hazard rate by about 40%, to about 58% of the baseline; this result is statistically significant.
Number of islands visited is a continuous variable ranging from 1 to 9, since there are nine islands in the Azores. An increase in the number of islands visited leads to a statistically significant increase in the expected length of stay. Moreover, the size of this island-hopping effect is quite large: visiting one more island increases expected length of stay since the hazard ratio is about 77%. ‘Not coming back off-season’ flags tourists who say that they do not consider visiting the Azores off-season, when the weather is not as nice as in the summer, when the questionnaire took place. Hence, this binary variable should be related inversely to a certain sense of unconditional satisfaction. The results are not statistically significant. By the same token, ‘highly satisfied with visit’ is a binary variable that directly captures overall tourist satisfaction with respect to visiting experience. Once more, the results are not statistically significant. The same applies to revisit intention.
Environmental initiatives
From a total of 24 environmental initiatives, a factor analysis exercise led to the construction of three factor-based regressors. The first is associated with waste management; the second with environmental management; and, finally, the third with the importance of water savings and associated tourist awareness. A higher value for any of these factor-based regressors means that the tourist attached more importance to such factor as part of a quality holiday experience. Overall, the results suggest that attitudes regarding sustainability practices have some predictive power over length of stay. Moreover, it is also true that a higher awareness towards such sustainability practices leads to longer stays, with the exception of water savings and associated tourist awareness. In fact, while waste management and the quality of environmental management exhibit statistically significant and lower-than-one hazard ratios, the result for water savings is not statistically significant. Hence, the results suggest some pay-off to implementing such sustainability practices in terms of prolonged stays, with the aforementioned exception of water savings and associated tourist awareness.
Destination image
A total of 25 dimensions and attributes were used to characterize destination image. A factor analysis exercise was carried out in order to synthesize the plethora of information gathered. A total of six factors were considered as regressors. There are several results worth noting. First, the results indicate that
T E
tourists who choose the Azores as a holiday destination for its weather and remoteness experience the longest stays, everything else being constant. This result is statistically significant. By the same token, tourists who choose the Azores as a holiday destination for its nature and landscape also experience longer stays. Again, this result is statistically significant. Hence, marketing investments in brand awareness along these dimensions and attributes may promote an increase in expected length of stay. On the contrary, tourists who attach high importance to cultural heritage in their holiday destination choice process tend to experience shorter stays, everything else being constant. This result is statistically significant. Finally, the factors quality and price, availability of packages and flights, and safety and hospitality do not display, when taken individually, any statistically meaningful predictive power regarding length of stay.
Conclusions and final remarks
This paper estimated a microeconometric semi-parametric survival analysis model to learn the determinants of length of stay, formally tackling the censoring and truncation data issues associated with the strictly positive nature of length of stay. The results are statistically significant and economically important. The richness of the information embedded in the covariates used allows the design of effective marketing policies, in the sense that the regression results allow one to estimate, for a given synthesized, policy-relevant individual or target group, the impact on expected length of stay of a change in socio-demographic profiles, actual trip experiences, attitudes towards sustainability practices and destination image.
Among the several results found, it can be argued that being a repeat visitor is an important criterion to identify tourists who are likely to experience longer stays. In fact, it is shown that being a repeater decreases, everything else being constant, the hazard ratio by about 37% and, concomitantly, increases expected stay. Repeat visitor behaviour is an interesting topic in its own right that has attracted researchers’ attention in the literature in recent years (see, among others, Oppermann, 1997; Kozak, 2001; Lehto et al, 2004). Thus, future research should characterize such groups and their economic and activity involvement. Taking (direct) charter flights also plays a highly statistically significant role in determining length of stay. This result is very important as the Azorean government, in its quest to promote air connections to the Azores, subsidizes charter flights and must, therefore, assess the socio-economic implications of such subsidies. Apparently, such policy is successful in terms of promoting longer stays. This is true, regardless of nationalities which were controlled for in the regressions. A higher degree of education is associated with shorter expected stays. Visiting more islands leads to an increase in the expected length of stay. This island-hopping effect suggests that there is no crowding-out behaviour on the part of tourists, in the sense that tourists do not trade a larger number of islands visited for a shorter visit per island, hence keeping overall length of stay in the Azores constant. On the contrary, tourists are willing to visit more islands at the expense of longer stays. This result is interesting when one takes into account that the Azorean government actively
promotes inter-island mobility since it regards island hopping as a way to spread the economic benefits from tourists across the islands and, in the process, to alleviate regional economic asymmetries. Future research should try to uncover what leads tourists to visit a different number of islands.
A factor analysis exercise was carried out in order to construct an operational set of factor-based regressors that capture tourists’ attitudes towards environ-mental initiatives as important ingredients of a quality holiday experience. The results suggest that there are, indeed, some pay-offs to such sustainability practices in terms of longer stays.
By the same token, a similar factor analysis exercise was undertaken in order to build a small set of factor-based covariates that capture tourists’ reported destination image. Overall, the results suggest that the image of the Azores associated with its nature, landscape, remoteness and weather promotes longer expected stays. On the contrary, tourists who attached high importance to the Azorean cultural heritage as a reason for visiting the Azores experienced shorter stays. Finally, the factors quality and price and availability of packages and flights do not seem to have any statistically meaningful predictive power over length of stay. As far as policy implications are concerned, and based on this evidence, one may argue that marketing strategies that promote the Azores for its nature, landscape, remoteness and weather increase length of stay, whereas cultural heritage has the opposite effect.
Endnotes
1. Apparently, there are very few studies in the tourism literature that employ survival analysis models. In fact, in their bibliometric study on tourism and statistics, Palmer et al (2005) review 1,790 articles in 12 leading tourism journals by means of a taxonomy with 24 statistical categories and fail to mention survival analysis explicitly in a single instance.
2. To save on space, details of the factor analysis exercise will be provided on request. 3. There is no evidence of multicollinearity in the data.
4. A first group of 50 tourists were interviewed in the initial stage of the fieldwork in order to validate the questionnaire. From this validation exercise, it followed that not all tourists were willing to report their income directly and, hence, such proxy for income, based on current professional status, was built into the questionnaire.
References
Alegre, J., and Pou, L. (2006), ‘The length of stay in the demand for tourism’, Tourism Management, Vol 27, No 6, pp 1343–1355.
Bargeman, B., and Poel, V. (2006), ‘The role of routines in the decision making process of Dutch vacationers’, Tourism Management, Vol 27, No 4, pp 707–720.
Beerli, A., and Martín, J. (2005), ‘Tourists’ characteristics and the perceived image of tourist destinations: a quantitative analysis – a case study of Lanzarote, Spain’, Tourism Management, Vol 25, No 5, pp 623–636.
Castro, C., Armario, E., and Rui, D. (2007), ‘The influence of market heterogeneity on the relationship between a destination’s image and tourist’s future behavior’, Tourism Management, Vol 28, No 1, pp 175–187.
Chen, C., and Tsai, D. (2007), ‘How destination image and evaluative factors affect behavioral intentions?’, Tourism Management, Vol 28, No 4, pp 1115–1122.
Crouch, G. (1994), ‘A meta-analysis of tourism demand’, Annals of Tourism Research, Vol 22, No 1, pp 103–118.
Crouch, G., and Louviére, I. (2000), ‘A review of choice modelling research in tourism, hospitality, and leisure’, Tourism Analysis, Vol 5, No 2–4, pp 97–104.
T E
Davies, B., and Mangan, J. (1992), ‘Family expenditure on hotels and holidays’, Annals of Tourism
Research, Vol 19, No 4, pp 691–699.
Decrop, A., and Snelders, D. (2004), ‘Planning the summer vacation: an adaptable and opportunistic process’, Annals of Tourism Research, Vol 31, No 4, pp 1008–1030.
Fleischer, A., and Pizam, A. (2002), ‘Tourism constraints among Israeli seniors’, Annals of Tourism
Research, Vol 29, pp 106–123.
Gokovali, U., Bahar, O., and Kozak, M. (2007), ‘Determinants of length of stay: a practical use of survival analysis’, Tourism Management, Vol 28, No 3, pp 736–746.
Greene, W. (2000), Econometric Analysis, Prentice Hall, Upper Saddle River, NJ.
Hellerstein, D. (1991), ‘Using count data models in travel cost analysis with aggregate data’,
American Journal of Agricultural Economics, Vol 73, No 3, pp 860–866.
Hellström, J. (2006), ‘A bivariate count data model for household tourism demand’, Journal of
Applied Econometrics, Vol 21, No 2, pp 213–226.
Hill, M., and Hill, A. (2002), Research with Surveys, Sílabo, Lisbon.
Hosmer, D., and Lemeshow, S. (1999), Applied Survival Analysis, Wiley, New York.
Hui, T., and Wan, T. (2003), ‘Singapore’s image as a tourist destination’, International Journal of
Tourism Research, Vol 5, No 4, pp 305–313.
Kiefer, N. (1988), ‘Economic duration and hazard functions’, Journal of Economic Literature, Vol 26, pp 646–667.
Kozak, M. (2001), ‘Repeaters’ behavior at two distinct destinations’, Annals of Tourism Research, Vol 28, No 3, pp 785–808.
Lancaster, T. (1990), The Econometric Analysis of Transition Data, Cambridge University Press, Cam-bridge.
Legoherel, P. (1998), ‘Toward a market segmentation of the tourism trade: expenditure levels and consumer behavior instability’, Journal of Travel and Tourism Marketing, Vol 37, No 1, pp 19– 39.
Lehto, X., O’Leary, J., and Morrison, A. (2004), ‘The effect of prior experience on vacation behav-iour’, Annals of Tourism Research, Vol 31, No 4, pp 801–818.
Lim, C. (1997), ‘An econometric classification and review of international tourism demand models’,
Tourism Economics, Vol 3, No 1, pp 69–81.
Lin, D., and Wei, L. (1997), ‘The robust inference for the Cox proportional hazards model’, Journal
of the American Statistical Association, Vol 84, No 408, pp 1074–1078.
Mok, C., and Iverson, T. (2000), ‘Expenditure-based segmentation: Taiwanese tourists to Guam’,
Tourism Management, Vol 21, No 3, pp 299–305.
Oppermann, M. (1995), ‘Travel life cycle’, Annals of Tourism Research, Vol 22, No 3, pp 535–552. Oppermann, M. (1997), ‘First-time and repeat visitors to New Zealand’, Tourism Management, Vol
18, No 3, pp 177–181.
Palmer, A., Sesé, A., and Montaño, J. (2005), ‘Tourism and statistics: bibliometric study 1998– 2002’, Annals of Tourism Research, Vol 32, No 1, pp 167–178.
Palmer-Tous, T., Riera-Font, A., and Rosselló-Nadal, J. (2007), ‘Taxing tourism: the case of rental cars in Mallorca’, Tourism Management, Vol 28, No 1, 271–279.
Pike, S. (2002), ‘Destination image analysis – a review of 142 papers from 1973 to 2000’, Tourism
Management, Vol 23, No 5, pp 541–549.
Saarinen, J. (2006), ‘Traditions of sustainability in tourism studies’, Annals of Tourism Research, Vol 33, No 4, pp 1121–1140.
Seaton, A., and Palmer, C. (1997), ‘Understanding VFR tourism behavior: the first five years of the United Kingdom tourism survey’, Tourism Management, Vol 18, No 6, pp 345–355.
Smith, V. (1988), ‘Selection and recreation demand’, American Journal of Agricultural Economics, Vol 70, No 1, 29–36.
Song, H., and Witt, S. (2000), Tourism Demand Modelling and Forecasting: Modern Econometric
Ap-proaches, Pergamon, Oxford.
Sung, H., Morrison, A., Hong, G., and O’Leary, J. (2001), ‘The effects of household and trip characteristics on trip types: a consumer behavioural approach for segmenting the US domestic leisure travel market’, Journal of Hospitality and Tourism Research, Vol 25, No 1, pp 46–68. UNCED (1992), Agenda 21: A Guide to the United Nations Conference on Environment and Development,
UN Publications Service, Geneva.
Witt, S., and Witt, C. (1995), ‘Forecasting tourism demand: a review of empirical research’,
Appendix 1
Environmental initiatives (sustainability practices) in the
tourism industry
How important do you think each of the following factors is for holidaymakers to have a high-quality holiday? Answers from 1 (very low importance) to 5 (very high importance).
(a) Separating recyclable or reusable materials from other solid waste. (b) Reusing materials and containers to reduce solid waste.
(c) Adequate treatment and disposition of solid waste. (d) Reducing energy and fuel consumption.
(e) Using energy-efficient technologies. (f) Using alternative/renewable energy sources. (g) Reducing water consumption.
(h) Using undrinkable water when possible (for irrigation, laundry, etc). (i) Adequate sewage treatment.
(j) Using environmentally friendly products. (l) Using recycled material where possible.
(m) Substituting hazardous materials with environmentally preferable alternatives. (n) Reducing noise (improving sound insulation levels, etc).
(o) Monitoring/reducing external air emissions. (p) Purchasing local products when possible.
(q) Educating and training staff to meet these sustainable practices. (r) Employing local people and building materials.
(s) Creating non-smoking areas and rooms.
(t) Encouraging guests to adopt water and energy reduction practices (reuse bathroom linen, etc).
(u) Providing environmental guidelines for tourists. (v) Motivating tourists to use public transport.
(x) Informing tourists about local attractions (natural and cultural). (y) Implementing quality management systems.
(z) Introducing eco-labels, to indicate tourist facilities and sites successfully using environmental management systems.
Appendix 2
Attributes of destination choice
How important was each of the following factors when you made your choice of the Azores as a holiday destination? Answers from 1 (very low importance) to 5 (very high
importance).
(a) Originality/uniqueness of destination (natural and cultural features). (b) Isolation/remoteness of the region.
(c) Climate.
T E (e) Package tours.
(f) Available information.
(g) Availability/quality of accommodation. (h) Availability/quality of local transport. (i) Contact with friends and relatives. (j) Value for money.
(l) Quality of service.
(m) Sports facilities and activities (golf, etc). (n) Scenery, landscape.
(o) Gastronomy.
(p) Entertainment, nightlife.
(q) Historic and architectural heritage, monuments, museums. (r) Nature, fauna and flora, volcanic nature of the islands. (s) Cultural attractions, festivals, special events.
(t) Oceans, beaches and other water activities. (u) Religious attractions, religious events. (v) Shopping facilities.
(x) Hospitality/friendliness of local people. (y) Peacefulness, tranquillity, pace of life. (z) Safety and security.