Licenciado
Complex Networks and Data Mining:
Toward a new perspective for the
understanding of Complex Systems
Dissertação para obtenção do Grau de Doutor em Engenharia Electrotécnica e de Computadores
Orientadores :
Pedro Sousa, Professor Doutor, Universidade
Nova de Lisboa
Stefano Boccaletti, Senior scientist, CNR -
Insti-tute of Complex Systems, Florence, Italy
Júri:
Presidente: Prof. Camarinha da Matos
Arguentes: Prof. João Paulo Branquinho Pimentão Prof. Ruedi Stoop
Vogais: Prof. Ginestra Bianconi Prof. Ernestina Menesalvas
Complex Networks and Data Mining:
Toward a new perspective for the understanding of Complex Systems
Copyright c⃝ Massimiliano Zanin, Faculdade de Ciências e Tecnologia, Universidade Nova de Lisboa
A Faculdade de Ciências e Tecnologia e a Universidade Nova de Lisboa têm o direito, perpétuo e sem limites geográficos, de arquivar e publicar esta dissertaçáo através de ex-emplares impressos reproduzidos em papel ou de forma digital, ou por qualquer outro meio conhecido ou que venha a ser inventado, e de a divulgar através de repositórios científicos e de admitir a sua cópia e distribuição com objectivos educacionais ou de in-vestigação, não comerciais, desde que seja dado crédito ao autor e editor.
that led to this PhD thesis. Gratitude should clearly go to all those friends and colleagues whose advice and wisdom have positively marked my career; but also to those who have just unintentionally increased my determination to walk through the path of research. Going back in time, I should start with those people who have guided (and trusted) me through the first steps: Javier Buldú, of the Universidad Rey Juan Carlos in Madrid; Alexander Pisarchik, then at the Center for Optic Research in Mexico; and Francisco Mancebo, of the Universidad Politécnica di Madrid. After these somehow improvised beginnings, things got more serious, with my work at Innaxis and at the Center for Biomedical Technology in Madrid. The latter has been a place where my vocation for research has been confirmed, especially thanks to the positive interactions with excellent professionals like Juan Almendral, Inmaculada Leyva, Adrián Navas, David Papo, Irene Sendiña-Nadal; but also to not-so-positive experiences, which, as many profess, are part and parcel of the academic world. I should mention a few ones of people with whom I’ve interacted during these years. Ricardo Sevilla, with whom I shared many a bottle of tequila - but just for research purposes! Joan Serrà and Pedro Cano, who introduced me to the world of music and audio technology; Daniel Ramos, whose skill as a singer is second only to his skill as a researcher; Joaquín Medina and Jesús Vicente, who taught me that plant genetics is easier to understand with Gin Tonic; Regino Criado and Miguel Romance, always ready to explain complex mathematical concepts in simple terms. My fellow reader, if you are not included here, please excuse my horrible memory, as no offence is meant in the omission! Finally, I can hardly find the words to express my gratitude to the three people who made this Thesis possible: Pedro Sousa, Stefano Boccaletti and Ernestina Menasalvas. Besides teaching me so many things, both actively and by their own example, that a thesis would only be a short summary, they have been instrumental in overcoming all the problems (scientific and bureaucratic) that we have encountered - in spite of my stubborn attempts at ruining my own scientific career. Thanks Pedro, Stefano and Ernestina for demonstrating that these attempts have so far been unsuccessful!
Complex systems, i.e. systems composed of a large set of elements interacting in a non-linear way, are constantly found all around us. In the last decades, different ap-proaches have been proposed toward their understanding, one of the most interesting being the Complex Network perspective. This legacy of the 18th century mathematical concepts proposed by Leonhard Euler is still current, and more and more relevant in real-world problems. In recent years, it has been demonstrated that network-based rep-resentations can yield relevant knowledge about complex systems. In spite of that, sev-eral problems have been detected, mainly related to the degree of subjectivity involved in the creation and evaluation of such network structures. In this Thesis, we propose ad-dressing these problems by means of different data mining techniques, thus obtaining a novel hybrid approximation intermingling complex networks and data mining. Results indicate that such techniques can be effectively used to i) enable the creation of novel net-work representations, ii) reduce the dimensionality of analyzed systems by pre-selecting the most important elements, iii) describe complex networks, and iv) assist in the analy-sis of different network topologies. The soundness of such approach is validated through different validation cases drawn from actual biomedical problems, e.g. the diagnosis of cancer from tissue analysis, or the study of the dynamics of the brain under different neurological disorders.
Os sistemas complexos, i.e. sistemas compostos por um vasto conjunto de elemen-tos que interagem de forma não linear, são comuns e abundantes. Nas últimas décadas, diferentes aproximações têm sido tentadas com vista a fazer a sua interpretação, sendo que o uso de Redes Complexas é um dos mais eficazes. O legado de conceitos mate-máticos propostos por Leonhard Euler (matemático do século XVIII) continuam actuais e confirmam a sua aplicabilidade. Os últimos anos têm confirmado que representações baseadas em redes conseguem descrever conhecimento relevante sobre os sistemas com-plexos. Contudo estão identificadas diversas limitações, sobretudo relacionadas com a o grau de subjectividade na criação e avaliação das estruturas em rede. Nesta disserta-ção, abordam-se estes assuntos com o recurso a técnicas de data mining, resultando assim numa aproximação híbrida que interliga a aproximação das redes complexas com o data
mining. Os resultados obtidos indicam que as aproximações sugeridas são eficazes i) na
criação de novas representações em rede; ii) na redução da dimensionalidade dos sis-temas analisados pela pré-selecção dos elementos mais relevantes, iii) na descrição de redes complexas e iv) no suporte à analise de diferentes topologias de redes. A robustez da aproximação foi validada através de diversos estudos de casos da área da biomédica,
e.g. o diagnóstico do cancro na análise de tecidos, ou no estudo da dinâmica do cérebro
afectado por diversas patologias neurológicas.
1 Introduction 1
1.1 Objectives and hypothesis . . . 3
1.2 Research methodology . . . 5
1.3 Main contributions and publications . . . 6
1.4 Structure of the document . . . 8
2 Review of the State of the Art 11 2.1 The birth of Complex Systems . . . 12
2.2 Complex networks . . . 14
2.2.1 Characterizing networks. . . 15
2.2.2 Classes of networks . . . 18
2.2.3 Recent trends in network theory . . . 19
2.3 Data mining . . . 21
2.3.1 Knowledge Discovery in Databases . . . 21
2.3.2 Feature selection . . . 23
2.3.3 Data Mining tasks . . . 25
2.3.4 Review of classification algorithms . . . 26
2.3.5 Validation . . . 28
3 Representing data sets by means of complex networks 31 3.1 Network reconstruction method . . . 32
3.2 Validation: Obstructive Nephropathy . . . 37
3.3 Validation: Glomerulonephritis . . . 39
3.4 Validation: analysis of plant genetic responses . . . 43
3.5 Conclusions . . . 48
4 Reducing the dimensionality of the system 51 4.1 Feature selection methods . . . 52
4.1.2 Goodness of constraint models . . . 53
4.1.3 Mutual information . . . 54
4.2 Validation: Obstructive Nephropathy . . . 55
4.3 Validation: ARCENE data set . . . 56
4.4 Conclusions . . . 61
5 Extracting knowledge from a complex network representation 63 5.1 Optimizing the network representation . . . 64
5.2 Validation: MEG data. . . 67
5.3 Validation: comparing different synchronization metrics . . . 71
5.4 Validation: analysis of neuroimage data . . . 80
5.5 Validation: diagnosis of leukemia from blood spectroscopy . . . 83
5.6 Conclusions . . . 84
6 Novel instruments for complex networks analysis 87 6.1 Fast enumeration of 3-nodes motifs. . . 88
6.1.1 The need of a new motif enumeration program . . . 88
6.1.2 Description of the algorithm . . . 89
6.1.3 Computational cost comparison . . . 91
6.1.4 Availability . . . 91
6.2 Network Information Content . . . 92
6.2.1 Information Content calculation . . . 93
6.2.2 The meaning of Information Content . . . 95
6.2.3 Application to real networks . . . 97
6.2.4 Information Content for feature selection . . . 99
6.2.5 Conclusions . . . 100
7 Conclusions and future lines of research 101 7.1 Toward a new perspective for the understanding of complex systems . . . 102
7.2 Review of the Thesis objectives . . . 103
7.3 Future lines of research . . . 105
7.4 Acknowledgments . . . 106
1.1 Interaction between complex networks and data mining . . . 2
1.2 Structure of the Thesis . . . 9
2.1 The human brain . . . 13
2.2 Representation of the city of Königsberg. . . 14
2.3 Graph representation of the city of Königsberg. . . 14
2.4 KDD process steps . . . 22
2.5 KDD as a non-linear process . . . 24
3.1 Example of the calculation of link weights . . . 33
3.2 Network reconstruction with one constraint. . . 36
3.3 Examples of four networks built from genetic and metabolic profiles . . . 39
3.4 Four examples of network representations of spectral data . . . 41
3.5 Structural characteristics of GN networks . . . 42
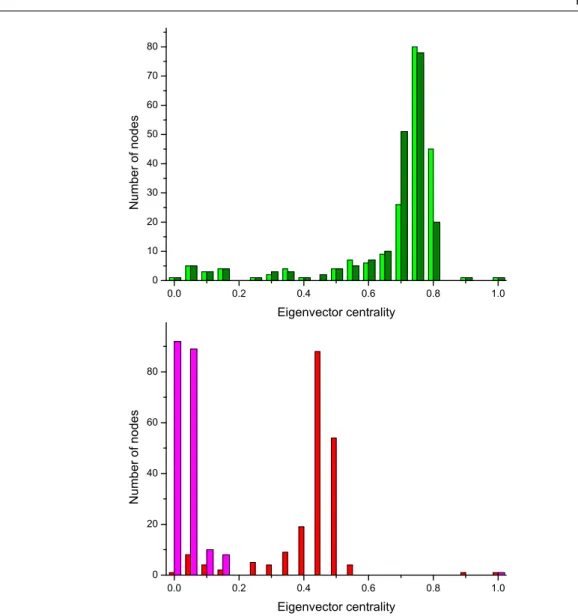
3.6 Eigenvector centrality histograms. . . 43
3.7 Classification score with noisy data . . . 44
3.8 Arabidopsis thaliana at 3 h. . . 46
3.9 In vivo experimental verification of the predictions. . . 48
3.10 Outcome of the experimental results. . . 49
4.1 Example of spectra binning . . . 53
4.2 Performance of feature selection algorithms for the ON data set . . . 56
4.3 Relation between ON severity and the network structure . . . 57
4.4 Classification score for the ARCENE data set . . . 58
4.5 F-measure for the ARCENE data set . . . 59
4.6 Area under the ROC curve for the ARCENE data set . . . 60
5.1 Classical network analysis steps. . . 65
5.2 Process for the optimization of network representations . . . 66
5.4 Relevance and stability of classification results . . . 70
5.5 Classification of MCI and healthy patients . . . 70
5.6 Correlation matrices for different synchronization metrics. . . 76
5.7 Topological and synchronization metrics. . . 77
5.8 Classification score for the seven synchronization metrics considered . . . 78
5.9 Classification score as a function of the link density . . . 79
5.10 Classification score for the three classification task . . . 80
5.11 Link density associated to the best classification score . . . 80
5.12 Evolution of Alzheimer’s disease . . . 82
5.13 Classification of control and leukemia subjects . . . 84
5.14 Evolution through time of a leukemia patient . . . 85
6.1 Comparison of computation time between FMotifs and MFINDER. . . 91
6.2 Example of one iteration of the Information Content assessment process. . . 94
6.3 Modularity vs. ICnorm. . . 96
6.4 ICnormand Clustering Coefficient. . . 97
6.5 Phenospaces of 55 real networks. . . 98
6.6 Modularity and ICnormin weighted functional brain networks. . . 99
6.7 Information Content and feature selection. . . 100
A.1 Calculation of the clustering coefficient. . . 136
A.2 Connected components of a graph. . . 138
3.1 New genes in osmotic stress responses. . . 47
4.1 Resume of classification results for the ARCENE data set . . . 60
5.1 Neuroimage data best classification scores. . . 82
6.1 Resume of motif detection software functionalities. . . 88
6.2 Association of motifs to numbers . . . 90
1
Introduction
In the last decades, the scientific community has realized that there are some systems, both natural and manmade, which cannot be fully understood by a reductionist ap-proach, i.e. by analyzing their constituting elements in an isolated way. On the contrary, their macroscopic properties seem to be defined by the structures of interactions between these elements. Such systems are now called complex systems. Examples have been found in many scientific fields, e.g. in social or technical (transport networks, Internet, et caetera) contexts. Probably, one of the most astonishing examples of a complex system is the brain; it is composed of more than 100 billions neurons, each one of them showing a very simple dynamics; the human capacity for reasoning (or for writing a PhD Thesis) only emerges when these simple dynamics start to interact.
Nowadays, two are the approaches used to extract information from complex systems (see Figure 1): classical data mining techniques, and complex networks. Born within physics, with substantial inputs from mathematics and statistics, the theory of complex
networks has proven to be a powerful tool for the analysis of complex systems; it allows
re-ducing them into simple structures of interactions, which can easily be studied by means of mathematical (algebraic) tools, while removing all unnecessary details. Following this idea, some important results have been obtained, as, for instance, the detection of critical genes in an organism [BO04], or the definition of the best strategies to stop the spreading of an infectious disease [PSV01]. On the other hand, data mining refers to the process of discovering patterns in large data sets, in order to automatically extract information and transform it into an understandable structure [FPSS96]. Born within computer science, it involves methods drawn from applied mathematics and statistics.
As is schematically represented in Figure1.1(Left), both approaches (data mining on one side, complex network analysis on the other side) are now applied independently,
Raw!data!
Knowledge!
Data!mining! techniques! Complex! Network! analysis! Computer! science! Physics!Raw!data!
Knowledge!
Data!mining! techniques! Complex! Network! analysis!Figure 1.1: Interaction between complex networks and data mining. (Left) The nowa-days approach to the study of Complex Systems. (Right) Creating interactions between data mining and complex networks, as proposed in this Thesis.
usually by two communities of researchers, i.e. computer scientists and physicists, that had little contact in the past. The main challenge is, therefore, to see how the state of the art and the most recent advancements from both communities can be integrated, with the ultimate aim of better understanding complex systems surrounding us.
In spite of some initial and basic attempts to join both fields (see, for instance, Ref. [HW12]), these undertakings have been mainly focused on confined problems, and a more comprehensive approach has not yet been pursued. Indeed, each field can yield new ideas and techniques that can strongly contribute to the improvement of the state of the art of the other. On one side, knowledge discovery and data mining techniques may improve the creation and analysis of complex networks by means of: i) identifica-tion and selecidentifica-tion of the most relevant features in the initial data, ii) standard methods for data pre-processing (like, for instance, creation of new features), and iii) analysis of the significance of network-based results. On the other side, complex networks analy-sis is mainly expected to provide a new way of representing and extracting information about the structure of systems characterized by interacting elements, thus providing a new point of view to classical data mining tasks like classification or regression.
Consequently, in this PhD thesis we are going to tackle the problem of the integration of knowledge discovery and complex network analysis (see Figure 1.1 Right), in order to improve the output of classification tasks performed on complex systems, thanks to the improved information provided by a complex network analysis. As this will require stronger and sounder methods for the extraction of knowledge from complex systems, such integration will also improve our understanding of how they are organized and evolve. From an engineering point of view, such additional knowledge can also open new doors toward the optimization, repair or forecasting of complex systems and of their dynamics, being them technological, social, or biomedical.
In order to validate such proposal, the presented case studies are drawn from con-temporary biological and biomedical problems. Several are the reasons supporting this
election. First, the social relevance of this field: any small improvement on the state of the art can yield important benefits toward the understanding, and hence the treatment, of deadly diseases. Additionally, biomedical data sets are intrinsically challenging, due to the cost of obtaining a relevant quantity of information, and to the always-present mea-surement noise; they thus represent a perfect tool for validating any new methodology. Last, but not least, the interaction of the PhD candidate with the Center for Biomedical Technology in Madrid, which ensured the access to a large collection of different biomed-ical data sets.
In spite of this primary focus, the techniques here developed have a general applica-bility, and thus potential applications to social or technological systems will be taken into account.
1.1
Objectives and hypothesis
In this Section, we review the main objectives of the Thesis, along with their correspond-ing research questions and hypothesis, as developed in the Thesis Plan Proposal.
Objective 1: Use of feature selection techniques in the pre-processing phase of network
recon-struction.
Research Question: How can features be pre-selected and ranked, in order to reduce the
computational cost of the network reconstruction and analysis phases, without reducing results significance?
In the creation of the network representation of a complex system, it is common to map all the elements composing such system into nodes, without any before-hand evaluation of their significance; on the contrary, it is believed that the true significance will be defined by the network itself. For instance, in the analysis of genetic networks, all available genes are usually included in the structure, with the idea that the network analysis will be able to detect if some of them are irrelevant. Clearly, this approach has a major drawback: a significant increment in the compu-tational cost. The complexity of the analysis may be reduced by eliminating irrele-vant features from the initial data set; furthermore, flexibility may be improved by ranking features according to their relevance, such that the final network size can arbitrarily be tuned. In both cases, an improvement of the score associated to data mining tasks may also be detected.
Hypothesis:If the initial data are processed, such that only relevant features are in-cluded in the analysis, both an improvement of the score associated to data mining tasks, and a significant reduction of the computational cost should be detected.
Objective 2: Network reconstruction through data mining techniques.
representations of data sets?
One of the most important points in the creation of a network representation of a given data set is the definition of the meaning of links, i.e. the connections between pairs of nodes. It is not uncommon to find that physical or virtual relationships between the elements of the system, e.g. hyper-links between the pages of a web site, constrain the way a link is defined. When such relationships are not explicit,
functional links can still be built, providing that nodes are described by time
evolv-ing observables (e.g. the time evolution of a stock price, or of brain activity in a given region). Here we will tackle this problem for data sets that do not fulfill these requirements, as the case of (static) sets of biomedical measurements. The use of data mining techniques should allow the creation of non-conventional net-work representations, thus enabling the application of complex netnet-work analysis to previously off-limits problems.
Hypothesis:If data mining techniques are applied to the creation of network rep-resentations, the resulting networks should be more representative of the systems under study, and this should reflect in an improvement of the performance of sub-sequent data mining tasks.
Objective 3: Use of network representations for improving data mining tasks.
Research Question: How can complex networks be transformed into a set of features,
which can be used to feed a data mining algorithm?
Classical data mining tasks can be of utmost importance in the analysis of com-plex systems; a classification algorithm can be used, for instance, to detect people suffering from a disease, or to automatically classify different variants of a tumor. Nowadays, data mining techniques are applied directly to the raw pre-processed data: here we propose the use of a network representation as an intermediate step. The interactions between the elements composing the system may be represented as a complex network, whose topological characteristics may then be used to feed a classifier. Such explicit use of the structure of interactions is expected to reduce the complexity of the data mining task, as structural features are promptly provided, thus improving the score.
Hypothesis:If a description of the structure of interactions, characterizing the com-plex system under analysis, is used to feed data mining algorithms, there should be a significant increase in the output scores associated to different knowledge dis-covery tasks.
Objective 4: Use of data mining tools to validate network representations.
Research Question: How can a network representation be validated, i.e. how can the
discovery task be assessed?
The accepted methodology for complex network reconstructions includes several steps in which the experience of the researcher comes at play. This creates the prob-lem of validating the significance of the network representation, that is, estimate how much information about the system is indeed encoded in the network, and as-sess whether such information is enough to perform a given data mining task. Our contribution consists in turning the problem around: specifically, in using the score of a data mining task to provide metrics assessing the significance of the representa-tion in an objective way. This will also allow an automarepresenta-tion of the network recon-struction process, in which specific parameters are optimized in order to achieve the highest score.
Hypothesis: If the score obtained in a data mining task, by using information ex-tracted from complex networks, is improved with respect to comparable studies in the Literature, then we can conclude that the network representation considered is valid.
1.2
Research methodology
The use of a robust methodology is one of the most important requirements of scientific research, in that, by defining the general direction and the specific steps one ought to fol-low, it allows reaching the expected results in an efficient and safe way. Throughout this Thesis, the scientific methodology proposed by Quivy and Van Campenhoudt [QVC98] has been used, adapted to the characteristics and challenges of the problem in hand.
As proposed in Ref. [QVC98], any scientific activity should be constructed around three acts. First, the researcher needs to break pre-established ideas; this requires identify-ing a question, for then analyzidentify-ing the answers that have already been given in the Litera-ture and preparing a set of objectives to be pursuited. Second, these pieces of information should be used to construct an analysis model, that is, a theory that can systematically be analyzed by means of real data. Finally, such model must be validated: the observed real-ity should be used to assess its usefulness or, if this does not happen, should be used as a starting point for the construction of a new analysis model.
The reader will recognize these acts in the different parts composing this document: from the identification of the scientific questions and associated hypotheses in Section 1.1, the discussion of the current state of knowledge in Chapter2, up to the development and validation of several analysis models in Chapters3-5- see the following Section1.4 for a description of the structure of this Thesis.
Three important aspects of this methodology should here be discussed. First of all, this Thesis deals with the application of data mining techniques to complex network analysis; the latter requires a specific methodology, i.e. a set of steps leading from the raw data, as recorded in the real world, to the final knowledge about the system. The analysis
process here followed corresponds to the best practices accepted in the research com-munity, for the analysis of both complex networks [FCOTRBAVR11] and data in general [FPSS96]. Second, the validation of all developed analysis models has been performed with the help of real data. Validation case studies have been drawn from biomedical and biological problems, mainly due to the associated complexity and social relevance. As one of the main drawbacks of complex network analysis is its subjectivity, the main topic of Chapter5, it was important to ground all validations with objective measures. This has been achieved by means of classification problems, e.g. discriminating between healthy subjects and patients, or the identification of the elements responsible for a dis-ease, which can then be validated against the literature. Finally, the reader should notice that, although any validation process should include analyses of both accuracy, reliabil-ity and usefulness, here we have focused only on the first of them. Obtaining biomedical data sets from real experiments was out of the scope of this PhD, due to its complexity and the need of specific knowledge; therefore, the reliability was ensured by the use of well-known public data sets, or of data sets already used in peer-reviewed publications. Similarly, the usefulness of the obtained results was assessed by experts in the pertinent biomedical areas.
1.3
Main contributions and publications
In this Thesis, we present the first description of a global process for the use of data
mining techniques in the study of complex networks, covering all its phases: from the definition of nodes and links, to the final analysis of topological metrics. Starting from a set of raw data representing a complex system, our first contribution is a novel
tech-nique for mapping them on a network structure. While different methods have been proposed in the past, none of them was targeting situations in which the elements of the system are described by static data, i.e. not evolving with time; furthermore, they lacked a collaborative approach: each system is usually analyzed in an individual fash-ion, without creating a global picture of the differences and similarities between groups of systems. The algorithm we propose maps deviations from an expected behavior into links, being such normal behaviors detected through standard data mining techniques. The possibility of creating network representations from static data sets opens doors to-ward addressing problems that were outside the range of complex network applications, as for instance the analysis of biomedical data like genetic or metabolic expression levels. We also compare feature selection strategies for the reduction of complex network
dimensionality. While the physics community considers complex networks as indis-soluble objects, the deletion of superfluous information is a standard problem in data mining, providing benefits such as reduced computational costs and increased statistical significance. For the first time we here apply algorithms, based on the assessment of the information encoded by each node, to demonstrate that the network size can be reduced up to a 50% without affecting the score of a classification task. The application of feature
selection strategies to Obstructive nephropathy (Section4.2) and cancer (Section4.3) have been respectively published in Networks and Heterogeneous Media (Impact Factor of 0.909) [ZMSB12] and PLoS One (Impact Factor of 4.092) [ZMBS13].
Furthermore, we provide a methodology for selecting the network topological
fea-tures most relevant for describing a system. This is performed by assessing the infor-mation encoded in networks representing different conditions, e.g. healthy subjects and patients, through the score obtained in a classification task. Thus, starting from a ground truth, the proposed methodology yields criteria for an optimal network representation relative to a given problem. We also show how this approach can be extended to related problems, e.g. the identification of the best parameters in the network reconstruction phase, or the estimation of the severity of a pathological condition. This methodology, that will be extensively discussed in Section5.1, has been published in Nature Scientific
Reports (Impact Factor of 2.927) [ZSPBGPPMB12].
Due to the young age of complex network theory, it is acknowledge that a lot of work has still to be done, both from the theoretical (i.e. the design of metrics able to detect relevant topological structures) and applied point of view (as, for instance, the reduction of the computational cost of network analysis, which would yield a deeper understand-ing of the properties of large-size systems). In order to cope with problems arisen by the novelty of the proposed methodology, a fast motif detection algorithm and a meso-scale
topological metrichave been developed. The former reduces the computation time by up to two orders of magnitude, making possible the analysis of motifs in medium and large networks; this has allowed us, for the first time, to highlight their importance in the dynamics of the brain - something that was hypothesized, but never demonstrated with real data. The latter allows the representation of a large number of meso-scale topological structures with a single number, thus allowing the use of such structures as an input in data mining tasks. This method for assessing the presence of meso-scale structures has been presented in Europhysics Letters (Impact Factor of 2.260) [ZSM14].
Finally, we validate these new concepts by applying them to seven biomedical
problems, ranging from the analysis of human and plant genetic expressions, up to the identification of pathological patterns in brain dynamics. This has lead to the publication of several manuscripts. Specifically, results obtained from the analysis of metabolic data, as will be presented in Sections 3.3 and5.5, have been published in Metabolites [ ZPSE-FRASEJRBMS13]. Furthermore, the identification of genes involved in the Arabidopsis Thaliana response to osmotic stress has been published in Nature Scientific Reports (Im-pact Factor of 2.927) [ZMVGPSMB14].
Beside these six published papers, two more have been prepared and are now under consideration in different journals. Specifically, the application of data mining techniques for the comparison of different synchronization metrics in the analysis of brain activities, as reported in Section 5.3, is under consideration in Neuron (Impact Factor of 15.766). Furthermore, the algorithm for the fast motif enumeration in dense graphs, presented in Annex6.1, is being considered in Bioinformatics (Impact Factor of 5.468).
Some selected results have been also presented in international conferences, and in several closed-doors meetings with research groups involved in biomedical studies. Among them, the most important have been given at Net-Works 2011, October 26-28, in El Esco-rial (Spain); 9th AIMS Conference, July 1-5, 2012, in Orlando (USA); Dynamics Days
Eu-rope 2013, June 3-7, 2013, Madrid (Spain); EuEu-ropean Conference on Complex Systems ’13,
16-20 September 2013, Barcelona (Spain); and ESMRMB ’13, 3-5 October 2013, Toulouse (France). Presentations have also been given at the University College of London, UK (group of Alexey Zaikin), and at the Università di Milano Bicocca, Italy (group of Costanza Papagno).
1.4
Structure of the document
We begin this Thesis by discussing the current state of knowledge in Chapter 2. This chapter is intended to provide relevant background material on the two main fields rele-vant for this work, i.e. complex systems and complex network science and data mining. Subsequently, the main work is developed following the structure depicted in Fig.1.2. It is based on the logical flow that allows the researcher to move from raw data to knowledge about the system under study. Thus, Chapter3tackles the problem of creating network representations starting from real-world data sets, and presents a novel technique for re-constructing network representations that builds up from sets of scalar data representing groups of pre-labeled subjects; Chapter4presents the application of standard feature
se-lection techniques to different types of biomedical data, and their effectiveness in
improv-ing the accuracy of network representations; finally, Chapter5deals with the problem of extracting useful knowledge from a network representation, and how to assess the quan-tity of information codified in a network. Each one of these Chapters first presents an introduction to the problem and the novel solution we propose, for then demonstrate its relevance with a set of validation cases drawn from the biomedical field.
As a topic transversal to all the work here proposed, Chapter6 presents two novel instruments for complex networks analysis, which have been developed to tackle specific problems encountered throughout this Thesis: the fast enumeration of motifs in dense networks, and the assessment of the presence of meso-scale structures.
Finally, we summarize the insight gained in Chapter7, and discuss directions for ex-tending the proposed methodologies in the future. For the sake of completeness, a final Annex presents a description of the complex network topological metrics used through-out this document.
Review SoA
CN reconstruction
Feature selection
Extracting knowledge
Conclusions
Instruments
2
Review of the State of the Art
Review SoA CN reconstruction Feature selection Extracting knowledge Conclusions Instruments
The work expounded in this PhD Thesis knits two different inter-related research fields, i.e. data mining and complex networks theory. The field of data mining focuses on the design of algorithms that enable computers to learn how to recognize non-trivial patterns and make intelligent decisions based on empirical data. On the other hand, the complex networks theory deals with the study of network representations of complex systems, i.e. systems composed of a high number of highly interconnected elements. In the intersection of both fields we can find the work proposed in this PhD Thesis, which aims at creating bridges between both frameworks, for enriching our understanding of complex systems.
Section 2.1 introduces the concept of complex systems, and how their study has been historically tackled. Afterwards, moving to more topical lines of research, Section 2.2 presents the main concepts associated to complex networks, the metric used for describ-ing their structure, and the most important types of networks known from the analysis of real-world complex systems. Finally, Section2.3reviews the main concepts associated to data mining.
2.1
The birth of Complex Systems
The decade of the seventies witnessed the birth of a new fundamental concept in the sci-entific community. At that time, almost all researchers were accepting without question the reductionist hypothesis, according to which all systems could be defined just by their composing elements; therefore, any phenomena could be understandable by character-izing their individual constituents, and summing up these individual effects. Ultimately, this meant that any system could be explained in terms of some few fundamental laws,
e.g. the performance of a car by applying quantum mechanics to its atoms. Nevertheless,
at the same time, it was becoming clear some systems escape this principle. Although, for instance, cell biology is based on the ideas of chemistry, it also requires brand new laws and generalizations, especially if one wants to make even simple problems tractable in feasible time [And72].
The behaviors of some systems cannot be explained just by extrapolating the proper-ties of their constituting elements, as important information is codified in the interactions between these elements. Such interactions generate behaviors at the macro-level, i.e. the level of the whole system, which cannot be explained by simply studying the constituting elements: such behaviors are known as emergent phenomena.
These systems are called Complex Systems: systems composed of a large number of elements, interacting between them in a non-linear fashion, and giving birth to emergent behaviors. In the last decade, thanks to the advancements in information management and in available computational power, the ubiquity of such systems has been observed in different fields of knowledge. From biology to economy and sociology, interactions between the elements of a system have been recognized as important as the elements themselves.
If one is to clarify what a complex system is by means of an example, one of the most paradigmatic would be the human brain (see Figure2.1). According to the last es-timations, it is composed of 100 billion neurons, which are the basic computation units [HH09]. Each neuron is very simple, and its dynamics is very well known: no computa-tion can arise from a single neuron, nor from a small group of neurons. Yet, when a huge number of them are connected following some specific structures, the human intelligence appears as an emergent phenomenon. Once the special nature of complex systems has been recognized, the problem of their characterization, or, in other words, of the extrac-tion of useful informaextrac-tion about their structure and dynamics, aroused. This knowledge
Figure 2.1: The human brain: one of the most astonishing known complex systems.
discovery process should take into account the specificities of the systems under analysis:
• Most of the information is encoded in the interactions, and not in the individual
elements.
• Such interactions are not always evident, and their presence should be inferred
from the dynamics of the elements composing the system.
• Finally, the quantity of information to be processed grows with the number of
po-tential interactions, which, in turns, grows with the square of the number of ele-ments. Therefore, the computational cost can become an important limiting factor, especially in the study of large socio-technical systems.
The extraction of useful information from complex systems has traditionally followed two parallel and almost independent paths:
1. The use of standard data mining tools and techniques, therefore partly neglecting the complex nature of the system.
2. A physical approach, by applying concepts drawn from the disciplines of applied mathematics and statistical mechanics.
Up to now, these two approaches have walked independently: the objective of this PhD Thesis is the creation of a bridge between both, (i) by improving the understanding of these systems by supporting the physical analysis with data mining techniques, and
(ii) by improving the outcomes of data mining tasks with the help of physical concepts.
In the next two Sections, a review of the most important concepts in complex network theory and knowledge discovery is presented.
Figure 2.2: Representation of the city of Königsberg, and of its seven bridges.
2.2
Complex networks
Any description of the complex networks theory should start from its origin, namely from the graph theory developed by Leonhard Euler and the Königsberg bridges prob-lem. In 1735, the city of Königsberg (nowadays Kaliningrad, Russia) laid on both sides of the Pregel River, with two islands in the middle; connecting all the regions of the city were seven bridges (see Figure2.2). A problem was formulated: was it possible, starting from one zone of the city, to visit all other zones, by crossing all bridges exactly once, i.e. crossing all the bridges, but not crossing a bridge twice?
Euler tackled this problem by firstly eliminating any unessential information. In other words, he realized that the actual structure of the land masses, or of paths inside them, was not necessary toward the resolution of the problem; what was really relevant was the structure of connections created by the bridges. The map of the city was then transformed into a virtual representation: land masses were represented as nodes (or vertices), and bridges as links (or edges). Figure2.3shows this abstract representation.
Beyond the Königsberg problem, Figure2.3represents the first representation of a real
Figure 2.3: Graph representation of the city of Königsberg. Nodes represent land masses, and links bridges between them.
system done with the help of a graph. There is one concept that is important to stress: the graph of Fig.2.3is a representation of the system that only considers the interactions between its constituting elements, avoiding any information about the nature of the ele-ments themselves. In other words, by means of a graph it is possible to represent in an abstract form the structure behind a system, independently of the nature of the system itself. As we will see below, this can be applied from biology (for instance, with nodes representing genes, and links co-expressions between pairs of them) up to sociotechnical systems (persons and friendship relations, or computers and communication networks). In the 18th century, the possibilities offered by this approach were not recognized: without doubt, this was due to the limited sources of information about complex sys-tems, and on the null computational capabilities available at that time. As a consequence, graph theory was initially developed as a pure mathematical subject, far away from any application. Yet, in recent years, the advancements in information storage and computa-tion has permitted the analysis of many real-world systems [FCOTRBAVR11], and hence the development of a large set of measures describing their structure [CRTV07].
2.2.1 Characterizing networks
As a first step toward the analysis of complex networks1and their classification in
fami-lies, it is necessary to define some methods for characterizing their structure. Indeed, and as may be expected, network measurements are an essential ingredient for many tasks, as network representation, characterization, classification or modeling. Nowadays, hun-dreds of different structural network metrics have been defined; while, in what follows, an overview of the most important is presented, the interested reader may refer to Annex Afor the definition of all metrics used in this PhD Thesis. Furthermore, the interested reader may also refer to the different reviews available in the Literature, like for instance Refs. [BLMCH06;CRTV07;FCOTRBAVR11].
Metrics describing complex networks are generally classified into three families, de-pending on their focus: micro-, meso- and macro-scale metrics.
The first of these families, i.e. micro-scale metrics, focuses on the properties of a single node; when the whole network is analyzed, these metrics are usually averaged over all nodes composing the network. The simplest example of a micro-scale metric is the degree, defined as the number of connections arriving or departing from a node. While this measure unveils some information about the structure of the network (for instance, it is possible to define the most central node as the one with more connections), even more knowledge can be extracted from the aggregation of all degrees. In other words, a degree
distribution P (k) can be constructed, which expresses the fraction of nodes in the network
with degree k.
The second important metric that can be extracted from the analysis of the degrees is the assortativity, defined as the presence of correlation between the degree of connected,
1
While graph and network are usually used as synonymous, the former refers to simple objects, i.e. having a regular or random structure, while a network is characterized by a more complex backbone of connections.
i.e. neighboring, nodes; in highly assortative networks, central nodes (that is, those
hav-ing a high degree) are connected with other central nodes with a probability higher than what expected in a random configuration. By analyzing different real-world networks, it has been discovered that social networks tend to be assortative, while biological and technological networks are often disassortative [BLMCH06].
When shifting the focus from a single node to a group of them, it is possible to de-fine meso-scale metrics [ACLBSN11] 2; the three most important concepts here are the
clustering coefficient, motifs and communities.
The clustering coefficient measures the presence of loops of order three in the network,
i.e. the density of triangular structures. It is also known as transitivity [New01], and is defined as follows:
C = 3N△ N3
, (2.1)
N△ being the number of triangles in the network, and N3 being the number of
con-nected triples. Notice that the former measures the number of sets composed of three nodes fully connected between them, while the latter considers sets of three nodes con-nected by at least 2 links. The factor three accounts for the fact that each triangle can be seen as consisting of three different connected triplets, one with each vertices as central vertex; this, in turn, ensures that 0≤ C ≤ 1.
An extension of the concept of clustering, named motifs, was proposed in 2002 by Milo and coworkers [MSOIKCA02; SOMMA02]. Motifs are subgraphs (usually composed of three or four nodes) that appear more frequently than what could be statistically ex-pected. In order to find these motifs in a real network, one should calculate the number of occurrences of each subgraph in the network, and compare it with the number expected in an ensemble of random equivalent networks. In order to quantify the significance of a given motif, a Z-score is usually calculated as:
Zi =
Ni(real)− ⟨Ni(rand)⟩ σi(rand)
. (2.2)
Here, Ni(real)is the number of occurrences of motif i in the real network,⟨Ni(rand)⟩ the ensemble average, and σi(rand)the ensemble standard deviation. From this definition of motifs, it can be seen that the clustering coefficient is just the frequency of occurrence of one of all the possible motifs of the network, specifically, of complete triangles.
To conclude this review of meso-scale characteristics of networks, it is worth noticing that most real networks present an inhomogeneous structure of connections, i.e. it is pos-sible to identify groups of nodes more densely interconnected to one other than with the rest of the network. Such groups are called modules, or communities, and their presence
2A good definition of meso-scale can be found in Ref. [BS10]: It is intermediate between a microscopic level,
when one studies elements of a system separately (e.g. molecules of a fluid), and a macroscopic one, when an entire system is considered as a whole (e.g. in terms of some averaged characteristics).
has been accounted for from social systems [ADDGGG04] to metabolic [GA05] networks. Intuitively, the identification of community structures in real networks is of great impor-tance, as nodes belonging to the same community are usually expected to share some characteristics. This insight has been successfully used in biology, and specifically for the identification of the function of new genes and metabolites, based on the function of neighboring nodes [GA05].
In spite of its importance, the concept of community presents two main drawbacks: there is no consensus about its definition, and the problem of identifying communities in networks is NP-complete. For the former problem, i.e. defining what a community is, we may cite three relevant definitions: the weak definition of Radicchi et al., according to which a subgraph is a community if the sum of all node degrees inside the subgraph is greater than outside it [RCCLP04]; the modularity Q, introduced by Newman and Girvan [NG04]; and the definition of communities in terms of information entropy [ZMW05]. The problem of identifying communities in real networks, on the other hand, has been tackled by mean of many different approaches, each one of them having its specific ad-vantages in terms of computational cost, scalability, and precision. For a complete review, the reader may refer to [LF09;For10].
The third family of metrics that can be extracted from complex networks refers to their
macro-scale, in that they account for the overall structure of the network. In this case, what is analyzed is the movement of information through the network: for instance, how many jumps are needed to move from one side of the network to the other, or what is the importance of a node with respect to the movement of information within the network. In what follows, we will briefly review three of such metrics, which will be repeatedly used throughout this Thesis.
The first metric, and the most simple, is the average geodesic distance, defined as the mean number of jumps needed to travel between two nodes of the network:
l = 1
N (N− 1)
∑
i̸=j
dij (2.3)
While this definition has the advantage of being intuitive, it also presents an impor-tant problem: it diverges when the network is disconnected, i.e. when the distance be-tween two pairs of nodes is dij = ∞. In order to avoid this divergence, Latora and Marchiori proposed a closely related measure, called global efficiency [LM01]:
E = 1 N (N − 1) ∑ i̸=j 1 dij (2.4) This measurement quantifies the efficiency of the network in transmitting informa-tion, supposing that the cost of such transmission if proportional to the distance between the sender and the receiver nodes.
Finally, the overall structure of the network can also be studied by means of spectral measurements. Specifically, it is of interest the calculation of the set of eigenvalues λi(i =
1, 2, . . . , N) of the matrix encoding the connections between nodes (also called adjacency
matrix A). The eigenvalues, and their associated eigenvectors, are related to multiple
macro-scale properties of the network: from connectivity properties [DA05], up to the importance of individual nodes [Ruh01] or the effects of the topology on the dynamics taking place on top of the network [ADGKMZ08].
2.2.2 Classes of networks
In the last decade, the analysis of a large number of real-world networks [FCOTRBAVR11] has revealed that some structures, or networks topologies, are ubiquitous across many natural and man-made systems. Although an extensive analysis of their properties, and of the models developed to explain how they appear, is out of the scope of this PhD The-sis, in what follows we will shortly review four main types of complex networks, as this constitutes the basis of any classification of real systems.
After the initial work of Euler in 1735, the network (then called graph) theory received little attention. After him, the person mainly responsible for the theoretical advancements in graph theory has been Paul Erdös. Between his numerous contributions, probably the most important has been the introduction of the concept of random graphs, also known as Erdös-Rényi graphs. Given a set of n disconnected vertices, links between all pairs of nodes are created with a probability p. Many theoretical results were obtained in random graphs, as, for instance, the expected size of the largest component (groups of nodes connected between them), or the critical value of p for which the graph was connected [ER59]. A comprehensive review of all results obtained in random graph analysis can be found in Ref. [Bol01].
If random graphs are characterized by a complete absence of structure, the other ex-treme is represented by regular graphs, i.e. networks where all nodes have the same number of connections. Both extremes are of limited applicability in describing real-world networks, as usually natural and man-made systems present a trade-off between regularity and more complex structures. Yet, random graphs are usually used to normal-ize the properties found in a real network; for instance, the frequency of appearance of a motif is usually compared with the frequency expected in equivalent (same number of nodes and links) random graphs, in order to assess its statistical significance.
In 1998, Watts and Strogatz realized that real networks were not regular, nor com-pletely random graphs, but that they lie somewhere between these two extremes. Specif-ically, random graphs are characterized by a low mean geodesic distance, and by a low clustering coefficient; on the other hand, regular graphs show high mean geodesic dis-tance and high clustering. By analyzing social and biological networks, they discovered that most of them are characterized by a low mean geodesic distance, but also by a high clustering coefficient. In order to explain how such combination can emerge in real sys-tems, they proposed a hybrid model: starting from a regular graph, few links are deleted at random, and replaced by random (and therefore, not regular) long-range connections.
By tuning the number of links affected by such rewiring, it is possible to create a large fam-ily of networks, all of them maintaining the high clustering of the regular initial graph, but also showing a reduced distance between nodes. The two combined properties are now widely known as the small-world effect [WS98].
Finally, a fourth class of network topologies emerged when another fact about real-world networks was observed. Instead of having homogeneous nodes, i.e. nodes with approximately the same number of connections, real-world networks are characterized by some highly important nodes, usually called hubs. A clear example can be found in transportation networks: for instance, the air transport network is characterized by few airports connecting with most of the network, e.g. Paris, London, or Madrid, and by many small (secondary) airports [ZL13]. Mathematically, these networks are called
scale-free, as their degree distribution follows a power law, and thus have no characteristic
scale.
In 1999, Barabási and Albert developed a simple model explaining how such scale-free networks can naturally emerge, based on the concept of preferential attachment [BA99]. The process begins with an initial network of m nodes, m being usually small. After-wards, new nodes are added to the network, one at a time; each one of these new nodes is connected to existing nodes with a probability that is proportional to the degree of the latter: pi= ki ∑ j∈Gkj (2.5)
pi being the probability of connecting with node i, and k the degree of nodes. Due to this biased attachment mechanism, highly connected nodes rapidly gain more links, thus becoming hubs of the system: an effect known as rich gets richer.
2.2.3 Recent trends in network theory
The two previous Sections have presented, in a concise form, the main elements of com-plex network theory, i.e. the core concepts that are by and large used in the analysis of real systems. Nevertheless, these concepts have been extended in the last years, in order to include situations that cannot be directly described by the standard framework: the result has been the creation of temporal and multi-layer networks.
The former, i.e. temporal networks, are composed of edges that are not continuously active. As an example, in networks of communication via e-mail, text messages, or phone calls, edges represent sequences of instantaneous or practically instantaneous contacts. In some cases, edges are active for non-negligible periods of time: for instance, the proxim-ity patterns of inpatients at hospitals can be represented by a graph, where individuals are pairwise connected while they are at the same ward. Clearly, the temporal structure of edge activations can affect dynamics of systems interacting through the network, from disease contagion on the network of patients to information diffusion over an e-mail net-work. The interested reader may refer to some reviews on the topic that can be found in
the Literature [HS12;HS13].
Beside the temporal aspect, it should be noticed that the traditional complex network approach has mostly been limited to the representation of node interactions by means of a (generally, real) number, quantifying the weight of the corresponding graph’s connection (or link). Nevertheless, considering all links as instances of a single object can be an important constraint. It may occasionally result in not fully capturing the details present in some real-life problems, leading even to incorrect descriptions of the corresponding phenomena. In what follow, three examples are considered, representative of the major limitation of that approach.
The first one is borrowed from sociology. Social networks analysis is one of the most used paradigms in behavioral sciences, as well as in economics, marketing, and industrial engineering [KY08], but some questions related to the real structure of social networks have been not properly understood. A social network can be described as a set of peo-ple (or groups of peopeo-ple) with some pattern of contacts or interactions between them [Joh00]. At a first glance, it seems natural to assume that all the connections or social relationships between the members of the network take place at the same level: the real situation is quite different, though. Indeed, social interactions seldom develop on a single channel, and more than one relationship can bind pairs of people. Such idea was proba-bly firstly analyzed by Erving Goffman in 1974, along with the theory of frame analysis [Gof74]. According to this research method, any communication between individuals (or organizations) is constructed (or framed) in order to maximize the probability of being interpreted in a particular manner by the receiver. Such framing may differ according to the type of relations between the involved individuals, several of them potentially overlapping in a single communication.
A second paradigmatic example of intrinsically multirelational systems can be found in transportation networks, as for instance the Air Transportation Network (ATN) [ZL13]. The traditional study of this infrastructure is based on representing it as a single-layer network, where nodes represent airports and links stand for direct flights between them. Yet, it is clear that a more accurate mapping can be reached if airlines are considered, as passengers cannot easily connect two flights operated by different airlines, at least by airlines belonging to different alliances [CZGGRAB13].
Moving on to biology, the third example is the effort of scientists to understand the role of specific components in a biological system. For instance, the Caenorhabditis elegans (or C. elegans) is a small nematode, the first organism for which the entire genome was successfully sequenced. Recently, biologists were able to get a full mapping of the C. el-egans’ neural network, consisting of 281 neurons and around two thousand connections [WSTB86]. The result is not a single network, as neurons can be connected by chemi-cal and electrichemi-cal (ionic) link, having these two types of connections completely different dynamics. Therefore, a correct representation should include two independent layers of connections.
network theory, by developing a novel framework for the study of multi-layer
net-works, i.e. graphs where several different layers of connections are taken into account [BBCGGGRSNWZ14]. Multi-layer networks explicitly incorporate multiple channels of connectivity and constitute the natural environment to describe systems interconnected through different categories of connections: each channel (relationship, activity, category) is represented by a layer, and the same node may have different kinds of interactions (dif-ferent set of neighbors in each layer). For instance, in social networks, one can consider several types of different actors’ relationships: friendship, vicinity, kinship, membership of the same cultural society, partnership or coworker-ship, etc.
2.3
Data mining
The idea of extracting some knowledge from a set of data is not recent, but has existed, in its manual form, since the beginning of civilization. For instance, one may think in the
Kabbalah, a school of thoughts inside Judaism, born in the 12th- to 13th-century
South-ern France and Spain, which uses different methods to analyze hidden meanings and messages inside the Torah [Dan05]; or the analysis of the astronomical observations per-formed by Johannes Kepler in the 16th century. Yet, the proliferation, ubiquity and in-creasing power of computer technology have dramatically increased data collection, stor-age, and manipulation ability. This, in turn, has created a new need for automatic data analysis, classification, and understanding.
Throughout this Thesis, several concepts and techniques drawn from data mining will be used. Yet, it should be noticed that data mining is a particular step, involving the analysis of data, of a more general concept called Knowledge Discovery in Databases (KDD)
3For the sake of completeness, the formed will be described in the light of the latter.
2.3.1 Knowledge Discovery in Databases
The name Knowledge Discovery in Databases (KDD) was introduced in the first KDD workshop in 1989 [PS90], and since then it has become popular in the artificial intel-ligence and machine learning fields. KDD has been defined as the non-trivial process of identifying valid, novel, potentially useful and ultimately understandable patterns in data [FPSS96]. In other words, KDD is a process that transforms a set of raw data into other representations that might be more compact, more abstract, or more useful. This process is performed by combining methodologies and techniques from different fields, such as statistics, databases, machine learning and visualization, and it is composed of the different steps depicted in Figure2.4[FPSS96]. It should be noticed that data mining refers to the design of algorithms that enable computers to recognize non-trivial patterns
3In the last decade, the new concept of data science has emerged, whose goals include extracting
knowl-edge from data and creating data products. KDD and data mining are usually considered as tools inside data science - see, for instance, Ref. [SBGMPT11].
Figure 2.4: Overview of the steps composing the KDD process. Source: www. crisp-dm.org.
and make intelligent decisions based on empirical data, and as such, it is one of the el-ements required in a KDD study. The terms “Knowledge Discovery in Databases" and “data mining" are frequently used interchangeably, with the latter becoming more pop-ular in the business and press communities in the last decade. Yet, KDD refers to the overall process of discovering useful patterns from data, while data mining refers to a particular step in this process, i.e. its analysis step [FPSS96].
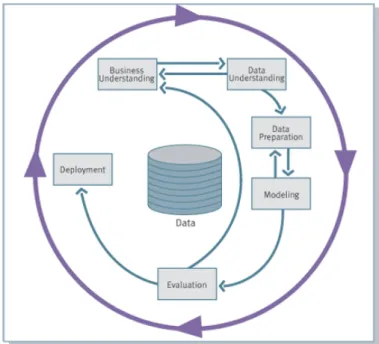
KDD is usually organized in phases, although most of the time the knowledge dis-covery process is not linear and presents loops and feedbacks - such characteristic will be depicted in Fig. 2.5. In 1997, an industry group called the Cross-Industry Standard
Process for Data Mining (CRISP-DM) proposed a methodology for organizing KDD
pro-cessed in standard steps, as illustrated in Fig. 2.5, which are described in what follows [CCKKRSW].
• Business (or Problem) Understanding: Initial phase that focuses on understanding the
project objectives and requirements from a business perspective. This first phase re-quires several sub-objectives to be fulfilled. Business objectives, i.e. what the client really wants to achieve, should be clearly understood; resources, assumptions, con-straints and other important factors (collectively known as the current situation) should be analyzed; both business objectives and the current situation should be transformed into data mining goals; finally, a good data mining plan has to be es-tablished. In resume, this first step creates the initial knowledge about the problem that will guide all subsequent phases.
• Data Understanding: this phase mainly deals with the acquisition of the data and
their initial analysis, with the aim of getting familiar with them, and of understand-ing their main features. Of special relevance is the analysis of the quality of the data, that is, the identification of missing or wrong information within the set.
• Data preparation: against the general belief, this phase is one of the most important
of the whole process, as the success of the final analysis strongly depends on it, and may consume up to the 90% of the time devoted to the process. Once the
suitable data sources have been identified, it is necessary to select, clean, construct and format them into the desired form. Good surveys are available on this topic: see, for instance, Ref. [ZZY03], where firstly the importance of data preparation for data analysis is motivated, and secondly a review of the research achievement on this field are presented, along with future directions and open problems.
• Modeling: this phase of the KDD is commonly known as data mining. Once data
are ready to be analyzed, different machine learning and data mining algorithms are selected and applied, and their parameters fine-tuned; in the next Section, some of these techniques will be reviewed in detail. Typically, several techniques can be chosen to solve the same modeling problem, each one of them having their own specific requirements on the format of input data; due to this, a step back to the data preparation phase is often required.
• Evaluation: once the models have been executed against the data, it is necessary to
review the output patterns obtained in the light of the business requirements iden-tified in the first phase. This is because the final aim of the KDD process is to gain deeper understanding of the business under study (as described in the first phase), and therefore the discovery of a specific pattern in the data may rise new ques-tions, which should be analyzed in detail. Due to this, the phases included between Business Understanding and Evaluation should be seen as an iterative process, as depicted in Fig. 2.5. Only when all relevant questions have been addressed, one can move to the final phase, i.e. the deployment of the product.
• Deployment: once all the knowledge about the business under study has been
gath-ered, such knowledge should be organized and presented in a way the customer can understand and use. Depending on the context, this can be as simple as cre-ating a report, or as complicated as a repeatable data mining process across the organization.
From this short review of the KDD process, and in the light of what was described in Section2.2, it should be noticed that a joint data mining and complex network approach may go beyond specific contributions to the Modeling phase. Instead, new synergies can also be created for the Data Preparation and Evaluation phases. In what follows, we will review the three phases, with special attention for the Modeling phase.
2.3.2 Feature selection
High dimensionality of the feature space can make the learning problem more difficult, even when the model does only depend on a reduced number of variables. Indeed, even if many data mining algorithms attempt to automatically detect which features are im-portant, and which features can be eliminated, both theoretical and experimental studies indicate that many algorithms scale poorly with a large number of irrelevant features are
Figure 2.5: KDD as a non-linear process. Source:www.crisp-dm.org.
included [Lan96]. The goal of feature extraction procedures is then threefold: reducing the amount of data to be analyzed, center the analysis only on relevant data, and im-prove the quality of the data set. Feature selection is a particularly important step in those domains that entail a large number of measured variables but a very low number of samples, like, for instance, biological and medical domains: gene and protein expres-sions, magnetoencephalographic and electroencephalographic records, et caetera.
Many feature selection algorithms have been described in the Literature [LM98;LM07]. Broadly speaking, they can be classified into three different families:
• Wrappers, using an algorithm to search through the space of possible features and
evaluate each subset by running a model on the subset. Wrappers can be computa-tionally expensive and have a risk of overfitting the model.
• Filters are similar to Wrappers in the search approach, but instead of evaluating
against a model, an independent filter is evaluated.
• Embedded techniques, which are embedded in and specific to a model.
Furthermore, the construction of the subsets to be evaluated can follow different strategies: exhaustive approaches, where all possible subsets of features are analyzed, which is impractical for large sets of features due to its extreme computational cost; heuristic
ap-proaches, i.e. based on a greedy algorithm that adds the best feature (or deletes the worst
feature) at each round; nondeterministic approaches, randomly generating feature subsets; and instance-based approaches, where features are weighted according to their role in dif-ferentiating instances of different classes for a data sample.