KEY PERFORMANCE INDICATORS
IN A HIGH EDUCATIONAL INSTITUTION:
A BUSINESS INTELLIGENCE APPROACH
Irakli Rostomashvili
KEY PERFORMANCE INDICATORS
IN A HIGH EDUCATIONAL INSTITUTION:
A BUSINESS INTELLIGENCE APPROACH
Master in Technology and Management of Information Systems
Supervisor
Pedro Castro
Co-supervisor
Miguel Bento Alves
October 2010 Program was supported by ERASMUS MUNDUS External Cooperation Window
Acknowledgement
I would like to say that I appreciate the help from Polytechnic Institute Viana do Castelo. Direct thanks to my supervisors Professor Pedro Castro and co-supervisor Mr. Professor Miguel Bento Alves for their support during the thesis preparation.
I want express my gratitude to Professor Jorge Ribeiro, who helped me a lot during my work. He provided me with books, materials and his advice was always extremely helpful.
I want to say many thanks to my teachers in IPVC Institute, to Professor Sara Paiva, Professor Antonio Miguel Cruz, Professor Rui Gomes and others. And special thank to Elsa Coelho and Sónia Simas, I would like to express my thanks to them for cooperation and support during my studies in Portugal. I am very thankful that they gave me the thorough knowledge and inspired me to work in this field.
My special thanks go to the European Commission, Education, Audiovisual and Culture Executive Agency (EACEA) and to my Erasmus Mundus program coordinator in Greece - Prof. Tania Kapiki. She gave me the opportunity to do my Master‟s degree in Portugal. It was a great challenge and a wonderful experience to be an Erasmus Mundus student. It was a great chance to meet other international students and I have lots of good memories that are never going to fade.
Special thanks to Professor Marina Javakhishvili in Georgia – Telavi State University coordinator of International Exchange office for her support and assistant during my participation in this program.
I want to say great thanks to Boris Elvison, Vice President and Principal Analyst at Forrester Research. I was very happy when I received his reply providing me with the up-to-date materials related to my research work.
Many thanks to Paruyr Khnkoyan (Employee in Synopsys http://www.synopsys.com as a Software Engineer II, December 2006 - April 2010, Yerevan-Armenia); I received his assistance and consultations during my thesis document preparation.
Abstract
Nowadays it is impossible for organizations to perform business activities without using the Information and Communication Technologies (ICT), which includes computers, networks hardware and applications. Usually organizations use applications to perform their business processes storing daily transactional data related to products, customers and other entities into operational databases. Operational databases are embedded into applications in order to provide to users mechanisms to analyze data and get reports from different points of view. On the other hand, there is an increasing amount of data stored in operational databases, which can be used in analytical reports in order to help managers in decision making activities. In this context, it is important for organizations to evaluate if their applications work well and answer to the business requirements, as well as control all business processes in all organization´s levels, namely, produce reliable and high quality products, increase customers‟ satisfaction, improve application performances and the quality of services provided to costumers and collaborators. For this purpose, organizations have the opportunity to comply with ISO (International Organization of Standards) requirements, guidelines and instructions in order to improve quality of processes, and then achieve the Quality Management System (QMS) in different levels of the organization.
In order to improve business performances in enterprises, decision makers define key performance indicators (KPI) for all (or some) business processes, which are based according to their strategies and goals, to evaluate, control and monitor services in order to improve business activities. For this purpose, Business Intelligence (BI) system demonstrates to be a possible solution to achieve this issue, allowing to integrate all enterprise operational data into a single data repository, get analytical data and generate reports. In general, a BI application is a meta-data driving tool, which has the capability to extract data from different systems and store them into a data repository (also called a data warehouse). It gives the opportunity to gather, store, filter and analyze huge volumes of data, providing to access historical data and develop set of reports in a quick and easy manner in order to support decision making activities.
During the last years there are many examples of the application of BI systems in different types of organizations. BI systems can also be used in educational
data of educational processes into data warehouses, from where it is possible to deliver KPI reports for decision makers through the use of Online Analytical Processing tools. In this context, this project focuses to apply BI systems in a Quality Management System (ISO 9001 Standard) implemented in a high educational institution (Polytechnic Institute of Viana do Castelo), with the objective to provide analytical tools to decision makers in order to evaluate, control, monitor and improve educational performances in all levels of the institution. With this work we have developed a BI application to provide IPVC decision makers with management tools to analyze data from QMS and get KPI reports with the purpose to satisfy the needs and expectations of IPVC managers.
Table of Contents
1. Chapter 1 – Introduction ... 1
1.1 Background ... 1
1.2 Problem Description ... 3
1.3 Objective ... 4
1.4 Structure of the document ... 6
2. Chapter 2 - Quality Management Systems ... 7
2.1 Introduction ... 7
2.2 Quality Management Systems Objectives ... 7
2.3 International Organization for Standardization (ISO) ... 9
2.4 Applicability of Quality Management System ... 11
2.5 Benefit of Quality Management System ... 13
3. Chapter 3 – Business Intelligence systems ... 15
3.1 Introduction ... 15
3.2 BI systems ... 17
3.3 Applying BI systems in companies ... 18
3.4 Applicability of Business Intelligence ... 20
3.5 Key Performance Indicators (KPI) ... 24
3.6 Operational Database ... 25
3.7 Data Warehouse systems ... 26
3.8 Online Analytical Process (OLAP) ... 30
3.9 BI Reports ... 31
3.10 Business Intelligence Vendors... 32
4. Chapter 4 - BI System Implementation in IPVC ... 35
4.1 Introduction ... 35
4.2 IPVC and Quality Management System ... 36
4.3 IPVC QMS Process Description ... 37
4.4 Using Agile BI methodology ... 41
4.5 Selected BI Tools ... 44
4.6 Implementation ... 46
4.7 Answering IPVC Business Needs ... 54
4.8 Key Performance Indicators (KPI) in Dashboard Report ... 76
5. Chapter 5 - Conclusions and Future Work ... 79
5.1 Conclusion ... 79
5.2 Future work ... 82
6. Bibliography ... 83
Appendix A– Current standards from ISO/TC 176 and its subcommittees ... 85
Appendix B – IPVC business needs and DW models ... 87
List of Figures
Figure 1 - ISO 9000 process approach [5 p. 2] ... 11
Figure 2 - Three keys for effective decision making [10 p. 10] ... 16
Figure 3 - Specific goals at each level of the organization [10 p. 18] ... 18
Figure 4 - Concrete measures at each level of the organization [10 p. 18] ... 19
Figure 5 - Timing of the foundation and feedback information [10 p. 19] ... 19
Figure 6 - Traditional Business Intelligence Architecture [11 p. 7] ... 20
Figure 7 - Self-Service BI application [18 p. 5] ... 23
Figure 8 - Massachusetts DW - clarifying questions through the data analysis process [17 p. 6]. ... 23
Figure 9 - Digital Dashboard report ... 25
Figure 10 - Relational Database Model [23] ... 26
Figure 11 - Data Warehouse Star Model [29 p. 19] ... 28
Figure 12 - Data Warehouse Snow Flake Model [29 p. 20] ... 29
Figure 13 - A data cube example. ... 30
Figure 14 - BI Report Service [30] ... 32
Figure 15 - BI Agile Methodology Life Cycle (adapted from [34]) ... 43
Figure 16 - IPVC Schools Data Warehouse Model ... 47
Figure 17 - Example of Academic Service ETL process ... 49
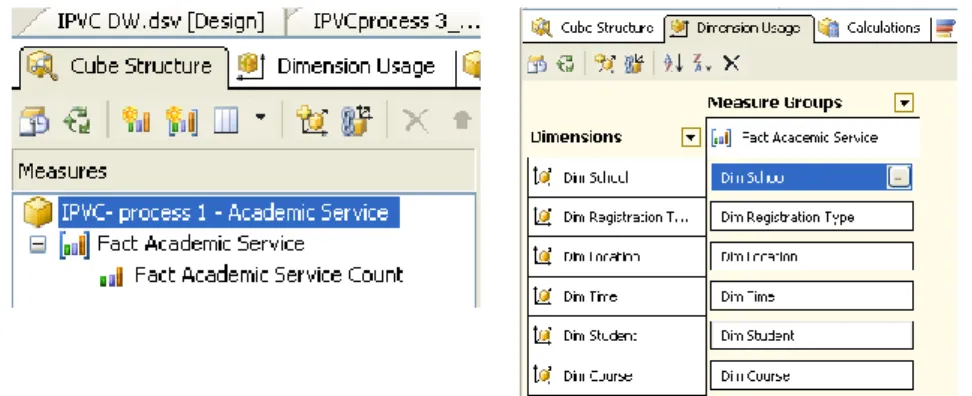
Figure 18 - Cube structure interface ... 50
Figure 19 – Definition of a calculated measure. ... 51
Figure 20 - Web browser tab of the Cube Designer ... 52
Figure 21 - KPIs tab on the Cub Design ... 53
Figure 22 - IPVC Digital Dashboard report ... 54
Figure 23 – Star model of student‟s online subscription of academic service process .. 55
Figure 24 - OLAP cube of students online subscription of academic service process ... 56
Figure 25 - Microsoft Excel report of student‟s online subscription ... 56
Figure 26 - Chart report of students‟ online subscription ... 57
Figure 27 – Star model of simulacra indicator of EHS process ... 58
Figure 28 - Microsoft Excel report of EHS simulacra indicator ... 58
Figure 29 - Chart report of EHS simulacra indicator ... 59
Figure 30 - Web report of EHS simulacra indicator ... 59
Figure 31 – Star model of complaints number of EHS process. ... 60
Figure 32 - Microsoft Excel report of EHS complaints number ... 61
Figure 33 - Chart report of EHS complaints number ... 61
Figure 34 - Web report of EHS complaints number ... 62
Figure 35 – Star model of manuals indicator of EHS process... 62
Figure 36 - Microsoft Excel report of EHS manuals indicator... 63
Figure 37 - Chart report of EHS manuals indicators ... 64
Figure 38 - Web report of EHS manuals indicator ... 64
Figure 39 – Star model of average cost of alimentation process ... 65
Figure 40 - Microsoft Excel report of alimentation average cost ... 66
Figure 41 - Chart report of alimentation average cost ... 66
Figure 42 – Star model of percentage of users in canteens of alimentation process. ... 67
Figure 43 - Microsoft Excel Report of alimentation users‟ percentage in canteen ... 68
Figure 44 - Chart report of alimentation users‟ percentage in canteen ... 68
Figure 46 - Microsoft Excel report of alimentation average satisfaction level ... 70
Figure 47 - Chart report of alimentation average satisfaction level ... 70
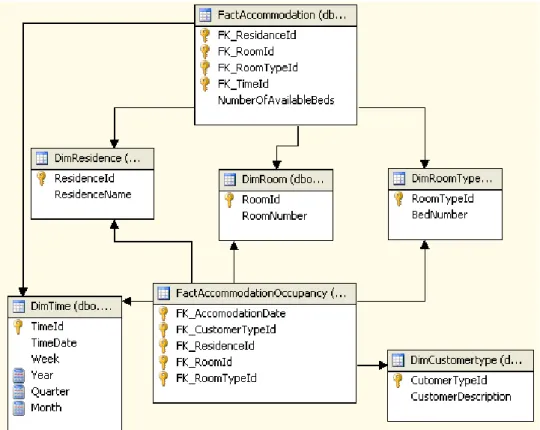
Figure 48 – Star model of occupancy rate of accommodation process ... 71
Figure 49 - Microsoft Excel report of accommodation occupancy rate ... 72
Figure 50 - Chart report of accommodation occupancy rate ... 72
Figure 51 - Microsoft Excel report of accommodation variation rate ... 73
Figure 52 - Chart report of accommodation variation rate ... 74
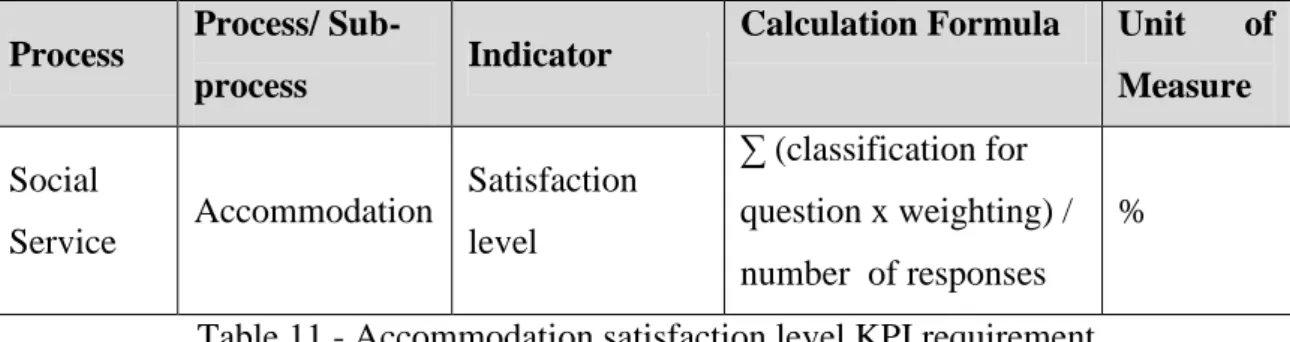
Figure 53 – Star model of satisfaction level of accommodation process. ... 74
Figure 54 - Microsoft Excel report of accommodation satisfaction ... 75
Figure 55 - Chart report of accommodation satisfaction ... 75
Figure 56 - IPVC digital dashboard report ... 77
Figure 57 - Dashboard report with Tableau Software ... 77
Tables
Table 1 - Decision making support table ... 17
Table 2 - Student online subscription KPI requirement ... 55
Table 3 - Simulacra KPI requirement ... 57
Table 4 - EHS complaints KPI requirement ... 60
Table 5 - EHS number of manuals KPI requirement ... 62
Table 6 - Alimentation average cost KPI requirement ... 65
Table 7 - Percentage of users in canteens KPI requirement ... 67
Table 8 - Average level of satisfaction KPI requirement ... 69
Table 9 - Occupancy rate of residences KPI requirement ... 71
Table 10 - Housed students‟ variation KPI requirements... 73
Abbreviations
BI Business Intelligence
DI Data Integration DW Data Warehouse
EDW Education Data Warehouse EDW Enterprise Data Warehouse
IS Information Systems IT Information Technology
IPVC Viana do Castelo Politechnic Institute ISO International Organization for Standards KPI Key Performance Indicators
MDX Multidimensional Expression OLAP Online Analytical Processes OLTP Online Transactional Processes
RDMS Relational Database Management Systems SSIS SQL Server Data Integration Service UDM Unified Dimensional Model
1.
Chapter 1 – Introduction
1.1 Background
Nowadays, we live in an information age where huge volumes of information are stored around us and we have to choose from mountains of data to produce useful information. Very often we have difficulties to find and choose the right information, losing resources and a lot of time filtering and sorting datain order to find the right one from the huge of data volumes which are collected and produced by organizations. People waste a tremendous amount of time trying to find and sort through the information in orderto perform their tasks. According to Forrester Consulting research [1 p. 23], “office workers spend 42% on working on information and 58% using the information making reports and analyzing”.
Indeed, the data produced and stored by enterprises increases overtime as a result of their internal and external processes, which are related to their products and customers services. In this context, organizations have the objective to reduce the amount of time consumed on searching and sorting through mountains of data and spend more time on analysis and making decisions.
In a competitive environment, organizations need to have the right and on time information in order to be able to get advanced position in the markets. Traditionally, in enterprises, information is located in various internal or external places in different sources and for business people (for example the managers and decision makers), it becomes harder and harder to find the right information, which consumes a lot of time and energy. In this context, Business Intelligence (BI) Systems are used to overcome these difficulties, since they enable to get quickly needed information by transforming mountain of data into meaningful, useful and insightful information, which will help to meet business requirements to make real time decisions. In recent years, demands for BI systems are increasing in enterprises. BI systems begin to rise due to the increasing data volumes, the growing of complex business operations, the necessity to generate reports with increasing complexity and the need to answer to complex regulatory and general report requirements. Furthermore, most of enterprises have to comply with rules and implement BI tools to ensure legal compliance [1 p. 5].
On the other hand, enterprises need to implement quality management system (QMS) in order to improve and control all processes in the organization that will help to monitor and evaluate business operations and satisfy customers demand. Using the QMS, organizations manage their work in a systematic manner, where all activities are documented in accordance with the written manuals, procedures, instruction, specification and forms, which help to determine whether prescribed activities are accomplished successfully. QMS stores large volumes of information related to products and services that can be used to monitor the performance of the services and define actions to improve the performance, efficiency and accuracy of services. Decision makers have the necessity to have access to performance indicators to control and evaluate business processes. To access to the set ofindicators about processes, there is a need to concentrate all information into a data repository, from where decision makers should be able to access indicators related to their business processes using simple, fast and easy tools that will help to define strategies and make decisions.
Considering the points mentioned previously in the context of the evaluation and improvement of processes across departments in enterprises, BI solutions reveal to be appropriate solutions. BI applications can be valuable tools to evaluate, monitor, control and audit all organization levels using Key Performance Indicators. Using BI solutions decision makers have the opportunity to access real time information, be provided with high quality reports and to achieve a level of maturity to implement multiple BI projects in the future.
In fact, Business Intelligence requirements are increasing and enterprises are depending on IT staff to fulfill these requirements. They usually depend on IT personnel to get requested BI reports. Business requirements can be inconsistent because they depend on economic impact, regulations and many other factors. Consequently, BI applications and models need to be changed and populated overtime in order to support new type of requirements and make new type of analysis. On other hand, business requirements changes very frequently overtime, and by this fact companies need different kind of management reports to overcome market changes and get advanced position against to competitors. In another point of view, IT staff needs time to develop new type of reports for business, however the managers or decision makers need to get the required report in a very short time, for that reason there is a need of “BI self service
tool”[1 p. 7], which will decrease IT support to a minimum level.
On the other point of view, Business Intelligence (BI) applications are composed by multiple tasks and components such as data integration, modeling, warehousing, OLAP, matrix creation and management, reports, dashboards, queries alerts and many more. When business requirements frequently changes overtime, implementing many component BI projects becomes hard and difficult. In this context, in order to simplify the implementation of BI projects, there is a need to use a kind of BI tool that has the capability to automatically update all dependent components when occurs changes in any single component [2 p. 4] Unfortunately not all BI tools have such kind of automatically components changing capability. According to Forrester [2 pp. 5-6] BI applications are classified into two categories: “first generation metadata-driven BI” and “second generation metadata-data driven BI”, where second generation BI systems are improved BI systems, which has agile and self service capability.
1.2 Problem Description
The Polytechnic Institute of Viana do Castelo (IPVC) is a high public educational institution providing opportunities for quality training in the human, cultural, scientific and technical sectors. IPVC integrates seven organizational structures, namely, five schools (Education School, Agricultural College, Technology and Management School, Management Sciences School, Health School), Social Services and Central Services.
Recently, theIPVC implemented a quality management system (QMS)1 in 2009 that allowed to ensure the ISO 9000 certification. QMS is used to perform daily services in the organized manner, covering the activities of the IPVC materialized in many processes, in particular, Academic, Environment, Health and Safety, Social Services, Courses Creation/Restructuration, Training, Economic-financial management, Management of works and Infrastructure, Information Management, Management and Improvement System, Project Management, Information Systems Management, Observatory, Promotion and Image, Human Resources and Technical and Educational Resources.
Nowadays, theQMS plays an important role in the management of the IPVC. In fact, the QMS can help managers to perform services effectively, as well as to define actions to improve it. In that context, top managers (and especially QMS managers) have defined a set of key performance indicators (KPI) in order to observe and evaluate all management processes to support decision making activities. The purpose of KPI is to get quantifiable measure, which reflects critical factors of success towards the institution strategy and goals. In the case of IPVC, the defined KPIs comprise the twenty-four processes covered by QMS of the institution departments, which are dispersed geographically. In this sense,IPVC has the need to integrate all data of QMS into one place that will help to define and evaluate institution work and to be eligible to compare current state with their strategies and goals. In fact, integrating all data across all the schools will give the possibility to get valuable information on how the work is performed by IPVC departments. The integration of all data across all the schools to produce KPI will allow to have an important tool to monitor IPVC activities. For the Institution, it is necessary and important to provide decision makers with tools that will permit to access KPIs on time, based on information produced by the QMS. KPI reports are vitally important for IPVC in order to monitor and analyze all services, activities, as well as to improve the performance objectives.
In that perspective, it is appropriate to study and explore the implementation of a Business Intelligence environment for the managers of the quality management system in Polytechnic Institute of Viana do Castelo. In this context, the motivation of applying BI application in the IPVC Quality Management System (QMS) is to develop a decision support system that will help to control, evaluate and improve IPVC educational performances.
1.3 Objective
The purpose of this project is to support quality management staff in decision making activities, in order to give opportunity to define and evaluate the institution services, compare institution strategies and goals and help in the planning of the future improvements. In this sense, the main objective is to implement a decision support system using BI technologies that will answer to the Key Performance Indicates (KPI) requirements. For this purpose decision makers need to access information about all the
processes of IPVC schools from one system to simplify and support decision making activities. Using business intelligence applications it is possible to satisfy business needs and QMS manager‟s expectations, such as increase productivity of work and improve and optimize processes in educational institution. In this work we will consider and apply BI tools in order to develop a decision making system to answer to the KPI requirements specified by theQMS managers. For this purpose, we define the following objectives in the frame of our project:
Develop a Data Warehouse system in IPVC, which will give advantages to integrate all IPVC QMS processes data into one common place and to achieve a maturity level to be able to develop various business intelligence projects in the future, depending on demands and necessities;
Analyze integrated data and prepare analytical reports;
Develop a decision support system for IPVC in order to support decision making activities;
Develop tools in order to monitor and evaluate predefined Key Performance Indicators (KPI) to assess the state of education performance in a short period of time.
In the context of the decision support system, the objective is to create a Business Intelligence environment in a high educational institution. Within this project we will provide to the IPVC decision makers (or managers) with analytical reports in order to help and support right decisions making in a timely manner. To develop this project we will need to integrate all information about IPVC processes from different data sources into a single repository, called Educational Data Warehouse, which is suitable for direct querying and analysis, as well as to apply Business Intelligence tools to generate reports and dashboards using predefined Key Performance Indicators in order to observe and evaluate all management processes in a timely manner.
Taking into account the objectives of this work and due to time limitations and difficulties to involve QMS managers, the BI system in this project has only been fully implemented for some processes of IPVC. However, we consider that, despite these limitations, the project is a contribution to demonstrate the advantages and benefits to develop BI tools in a high educational institution.
1.4 Structure of the document
The thesis is composed of five chapters.
Chapter 1 introduces the project, the problem description and the purpose of this document.
Chapter 2 presents the concepts and objectives of Quality Management Systems (QMS) and ISO standards.
The next chapter is about Business intelligence (BI) concepts and its components such as operational systems, data warehouse, data analysis and reporting.
The fourth chapter is entirely devoted to implementation details of BI system for IPVC QMS. In this chapter we present business needs, the methodology used to develop the project, the data warehouse models and reports.
The last chapter of this document consists of summary and conclusions about this project and points future work as well.
2.
Chapter 2 - Quality Management Systems
2.1 Introduction
Traditionally organizations move their activities by the need to produce high rates of performance, efficiency and efficacy, the satisfaction of their employees, customers and suppliers in order to be competitive and to enable organizations to face competition. The application of Quality Management Systems – QMS, particularly the ISO 9001 standard in organizations allows the definition of a set of processual and organizational documentation in order to guide and achieve high levels of efficiency, improve the services performance and to improve the internal and external quality of the services provided. In this sense, in the next sections we will describe shortly the objectives, the characteristics and the general benefits of the implementation of QMS in organizations.
2.2 Quality Management Systems Objectives
Quality Management System (QMS) is a set of coordinated activities, which guarantees a common attitude in the management of an organization and helps to control all processes in order to improve the efficiency and performance of the business. In organizations all rules are defined as policies, procedures, tasks, which are aligned into QMS functions with their objectives to help end-users to perform their daily work.
The objective of QMS is to satisfy business‟ and customers‟ requirements and at the same time, to extend the business operations outside of the company. QMS allows companies to present high rates of yield, by the satisfaction of their clients, partners or collaborators, and by maintaining high levels of competitiveness that allows them to face concurrency and assure their survival in the markets where they develop their activities. QMS includes many organizational processes and functions, which are interlinked between them in order to satisfy stakeholders and customers. In this sense, the main purpose of QMS is to increase customers‟ satisfaction, credibility, and improve products and services quality [3].
The development of QMS documentation is achieved by defining quality standards and practices in order to monitor and review external or internal performance against the defined quality standards and practices.
The document structure of a Quality Management System consists of a set of documents, where is specified quality requirements, which are materialized through procedures, policies, structural matrixes and forms. With this information it is possible to define quality standards and identify and provide the best practices in order to monitor and review the efficiency and performance of the processes.
In general, organizations use QMS to manage their work in a systematic manner. As mentioned in Westinghouse Electric Company QMS document, “In QMS all activities are documented in accordance with written manuals, procedures, instructions, specifications and drawings that contain appropriate criteria for determining whether prescribed activities have been accomplished satisfactorily” [4 p. 5].
In terms of objectives, the QMS implementation in economical organizations and in educational institutions can converge for a set of goals [5]:
To improve the quality of products and/or services; To use information and access it in timely manner;
To optimize processes by providing automatic transmissions of requests between the users and services;
To reduce execution time of tasks and answer to requests efficiently;
To increase the collaboration between internal and external stakeholders by using centralized environments (for example web-based applications);
To determine key indicators in order to evaluate and monitor services.
In general the Quality Management Systems that are applied to customer‟s satisfaction must comply with standards of information systems requirements defined by credible institutions like the ISO (International Organization for Standards). This institution is recognized by providing a set of standards in order to improve the efficiency and performance in many areas of the companies, with the purpose to define guidelines and to develop more efficient, safer and cleaner products and services. Using the ISO recommendations, companies are able to be recognized as a reliable system,
which gives opportunity to increase chances to do business in worldwide more effectively [5].
One of that standards is the QMS ISO 9001 certification standard. It corresponds to a tool in order to achieve customer enhanced satisfaction. Implementing the ISO standards gives opportunity to obtain advanced management mechanism, which will allow to improve products and services to increase chances of success in the global competition. In a general point of view the ISO 9001 is a standard documentation of processes consisting of a set of process matrixes, procedures, work instructions, process forms, requirements and other kind of documentation related to processes [6]. In the next section we will present a general description about this standard.
2.3 International Organization for Standardization (ISO)
International Organization for Standardization (ISO) is a worldwide organization which develops ISO standards. These standards are developed in terms of voluntary technical efforts in order to improve the performance and efficiency of diverse types of business operations. The use of ISO standards gives the opportunity to improve all kind of business operations and to develop more efficient and safer products/services. ISO Standards safeguard users and consumers. Its related documents are divided into three main dimensions of sustainable development: economic, environment and social fields [5].
The work of preparing International Standards is performed through ISO technical committees, cooperating with international organizations, governmental and non-governmental bodies. However some companies provide certification services which are previously certified by the ISO technical committees, for example, SGS - Société Générale de Surveillance SA2, APCER3, which belong to the IQNET (The international Certification Network) Association4.
The ISO 9000 is a family member of international quality management standards and guidelines. It is recognized in establishing effective and efficient quality management systems. In the field of Information Systems, ISO Technical Team 176 (TC 176 - see Appendix A) is responsible for the development of standards for quality
2 http://www.sgs.com/ 3 http://www.apcer.pt/
management and quality assurance [5]. In this standard, the documents for Quality Management Systems are comprised by [5]:
ISO 9000:2005 - Quality management systems – Fundamentals and vocabulary; ISO/FDIS 9001:2008 - Quality management systems –requirements;
ISO 9004:2000 – Guidelines for performance improvement;
ISO 19011:2002 Guidelines for quality and/or environmental management systems auditing.
In other hand, the ISO 9000 provides the basic concepts of QMS based on eight quality management principles and is used to achieve processes with continuous improvement capability. These eight principles are: customer focus, leadership, involving people, process approach, systems approach, continual improvement, factual decision making, and mutually beneficial supplier relationships. The ISO process approach is illustrated in Figure 1. During the implementation of a QMS, there are five sections in ISO 9001 standard that indicate activities that need to be taken into account
[5 p. 2]:
Overall requirements for the quality management system and documentation; Management responsibility, focus, policy, planning and objectives;
Resource management and allocation;
Product realization and process management;
Measurement, monitoring, analysis and improvement.
As we mentioned, the ISO 9001 specifies basic requirements for QMS, which are needed to provide products and services to enhance customer satisfaction and meet regulatory requirements. In practical terms, the application of the ISO 9001 requirements allows to achieve first level of QMS performance in order to develop high quality of products and fulfill customer‟s needs and expectation.
After a system answers to the requirements of ISO standards, it can be used for certification, registration or contractual purposes in order to be recognized. One fact is that ISO 9001 Standard recognizes that “customers play a significant role in defining requirements as inputs” [7 p. 11]. QMS supports the monitoring of customer satisfaction, which is necessary to evaluate and validate whether customers‟
requirements have been meet. The ISO 9004 version gives some guidelines in order to improve QMS by considering all involved parties interests and to extend the benefits obtained from ISO 9001. This version is used to achieve systematic and continual improvement of organizations overall performances.
Figure 1 - ISO 9000 process approach [5 p. 2]
In terms of the control of the implementation of the ISO 9002 family, the ISO 19011 Standard is used for auditing the QMS and has guidelines and instructions on how the audit of management systems should be performed. During the performing of an audit, organizations need to ensure that QMS was implemented successfully and meet all the requirements, which were predefined in ISO 9001 or ISO 9004 standards. In companies, audits are performed by ISO 9001 Auditing Practice Group (APG) [8].
2.4 Applicability of Quality Management System
There are many good reasons why organizations must apply QMS into their systems, for example:
To produce products with consistent quality;
To improve their quality of services provided to clients; To improve companies‟ management processes;
To monitor their processes and achieve great client satisfaction.
In order to implement a QMS in an organization, the top managers should define a set of quality policies, quality objectives and quality indicators. The quality objectives are measured using quality indicators which includes data availability, data quality and customer satisfaction. The ISO suggests some steps (or guidelines) to implement efficiently the standard [5 p. 4]:
1. Fully engage top management
Define the reasons why the organization wants and needs to implement ISO 9001;
Define the mission, vision, and values in the organization;
Define the organization‟s stakeholders: customers, suppliers, stockholders, employees, society, etc;
Define the quality policy;
Define and align organizational objectives and related product/ service quality objectives
2. Identify key processes and the interactions needed in order to meet quality objectives
3. Implement and manage the QMS and its processes (using process management techniques)
4. Build the ISO 9001-based QMS, in special to: Identify ISO 9001 requirements;
Map these requirements with the implemented QMS, where applicable; Make a gap analysis: identify where in the organization the requirements of
the existing system are fulfilled, and where they are not;
Include in the QMS processes the activities, procedures and controls needed. 5. Implement the system, train company staff and verify effective operation of the
processes
6. Manage the QMS:
Focus on satisfaction of customers;
Monitor and measure the operation of the QMS; Strive for continual improvement;
Consider implementing business excellence models in operations of the company.
7. If necessary, seek third party certification/registration of the QMS or as an alternative, issue a self-declaration of conformity.
2.5 Benefit of Quality Management System
In terms of the benefits of the QMS implementation in an organization, QMS enables to achieve the goals and objectives set out in its policy and strategy. According to Department of Trade and Industry document, “It provides consistency and satisfaction in terms of methods, materials, equipment, among others, and interacts with all activities of the organization, beginning with the identification of customer requirements and ending with their satisfaction, at every transaction interface” [9 p. 1].
The usage of QMS functions gives opportunity to have access to a set of key performance indicators that reflects the activities of the organization and, in this sense, it allows to monitor services performance. In the last years, many companies and organizations applied the ISO 9001 (and other) standards. In general, by the results achieved and mentioned in the literature, a good quality system can bring the following benefits:
Set direction and meet customers‟ expectations; Improve process control;
Reduce wastage; Lower costs;
Increase market share; Facilitate training; Involve staff; Raise morale.
3.
Chapter 3 – Business Intelligence systems
3.1 Introduction
Day after day, managers need each time more information about the various business activities of their organizations, to take strategic decisions based on the information, which are located in the available business sources. Usually, the historical information of these organizations is stored in information repositories, on which analytic processing servers process all the possible analysis combinations, disposing fast response times to all possible queries that decision agents may post.
The Business Intelligence concept refers to a set of techniques, which can be used to help managers in their decisions in order to respond to business needs using information technology (IT) capabilities. In this context, the tools to analyze the business needs could be analytical reports in order to prospect new market needs, which have the objectives to timely respond to customers, manage customer satisfaction, increase profit, optimize business processes, among others. In order to develop a Business Intelligence system, the Information Technology (IT) structure could include operational systems, databases, data warehouses, online analytical processes (OLAP), reporting tools and other IT components. In this sense, using this kind of systems to analyze data with the purpose to deliver analytical reports, gives the opportunity to align IT to business needs. Additionally, the relationship between the IT capabilities with BI systems offers the possibility to provide organizations with advanced analytical solutions, which allow to improve business processes, increase satisfaction of business persons and be aware about the business competitive environment in terms of concurrency and challenges.
A Business Intelligence system relies on intelligence information which is used to support the effective decision making activities concerning production, marketing and personnel. “Effective decisions are choices that move an organization closer to an agreed-on set of goals in a timely manner” [1 p. 8]. The decision makers in this process could be top managers of the company, the chief executive officer (CEO), the president, chairpersons or others. The key of organizational success is to make good choices based on specific goals, measures, information and feedbacks.
In order to make effective decisions, in general, the high level managers of an organization consider the set of business goals to measure how chosen courses are moving toward to these goals. The information about business processes is based on these measures, which must be provided in a timely manner. Decisions are made based on “foundation information” about current business conditions and are evaluated after receiving the “feedback information” as a result of decisions [10 p. 9]. Figure 2 illustrates the concepts of effective decisions that consist of three keys: specific goals, concrete measures, and timely foundation and feedback of information.
Figure 2 - Three keys for effective decision making [10 p. 10]
Organization need to define measures to understand if their goals and objectives are achieved or not. As goals are more specific the measures could be defined more clearly and are more measurable. Measures are the result of decision processes and feedbacks in the company, they are used to evaluate and monitor business processes. For example, consequences of some decisions in a company could be sales increase or decrease and this information will appear automatically in defined measures. The feedbacks are inputs (sales increased, or decreased) from customers that affect organization as a result (value) of decisions, which are represented in measures. Business goals define the status levels of the measures, so if values are less than defined goal the decision is evaluated as a bad decision, and if it is more than or equal, then decision could be evaluated as a good decision, meaning that specific goals were achieved. In an educational institution a global goal could be “students‟ satisfaction in alimentation process” measured by “percentage of meals served” in canteen with a goal of 80%, from where “percentage of meals served” is a specific goal. We can measure
decision rightness based on the increase or decreased of student‟s meal service percentage in canteen. Table 1 is an example that shows decisions making support table.
Global Goal Specific goal Measures (How we
know our goals is reached or not?) Foundation and Feedback Information 1.students satisfaction in alimentation process Maintain students number of meals served at canteen Students meal served are 80% and more If enrolment are: >=80% < 80% 2. Students registration academic service Increase students online subscription Students online subscription are 70% and more If Online subscription are: >=70% < 70%
Table 1 - Decision making support table
Decisions determine the general course that organization is going to take in a defined period of time. Decisions point the organizations toward to its goals. The goals have the repeatable measures that are used to control process toward defined goals and determine whether the organization is making effective decisions.
3.2 BI systems
“Business Intelligence is the delivery of accurate, useful information to the appropriate decision makers within the necessary timeframe to support effective decision making” [10 p. 14].
Business persons have to make effective decisions on time, which must rely on trusted information from well designed measures. Business Intelligence application has the capability to provide business persons with feedback information about their business performances in a timely manner. The feedback information from customers has a vital importance for business persons to make effective decisions and to evaluate decisions at all organization levels. Business Intelligence delivers timely updated information, which significantly influences on decision making processes.
Business Intelligence has the capability to analyze huge volume of data. The exploration of data sources could reveal trends, correlations and dependences, but such kind of relations could be impossible to be noticed by human being using either layout-let (designed to get appropriate report) or led discovery (information we find determines, where we want to go next) [10 p. 16]. In Business Intelligence systems “highly sophisticated mathematical algorithms are applied to the data to find correlations between characteristics and events. This type of information can be extremely helpful in organizations when planning marketing campaigns, setting up cross-product promotion or doing capacity planning for the future, determining when additional resources and efforts would be produced for the most effective results” [10 p. 17].
3.3 Applying BI systems in companies
Inside each company decision makers‟ activities can be classified into three levels [10 p. 18]: upper level decision makers, middle level decision makers and operational level decision makers. Figure 3, Figure 4 and Figure 5 present decision makers‟ levels, measures and timing of the foundation and feedback information at each level of the organization. At different levels of management different type of Business Intelligence tools and techniques are required to approach predefined goals. In each level of management specific goals, concrete measures, timing of foundation and feedback information is required in order to make effective decision.
Figure 4 - Concrete measures at each level of the organization [10 p. 18]
Figure 5 - Timing of the foundation and feedback information [10 p. 19] Upper level decision makers set long term goals, where measures that are defined are highly summarized. Highly summarized measures are also known as Key Performance Indicators (KPI).
Middle-level decision makers manage departments and organization at operational level. Middle level decisions are based on short term goals that are needed for planning to manage functional processes in organizations. Decision makers need to get reports about business activities and to apply drilldown techniques to the reports. Drilldown techniques are provided by BI reporting service that are used to obtain more detailed information and help to make better decisions.
Middle level management can also use data mining techniques effectively for making decisions.
Operational level decision makers (forepersons, managers, and group leaders) rely on day-to-day operational goals in order to manage daily information to react to changes. Based on the feedback information decision makers need to react quickly to improve processes on time.
3.4 Applicability of Business Intelligence
In general, the amount of information in organizations increases over time due to business processes. It is very important for enterprises to maintain and manage all information related to their businesses. In fact decision makers have the need to get complete reports about all business in a very short time. For that purpose, there is a need to have a system which will have the capability to access a variety of data sources (systems, databases, office programs, text files, web, etc) and to integrate all information into one common place. For such kind of advanced business needs, the solution can be provided by Business Intelligence (BI) systems. A BI tool gives the opportunity for decision makers to access all data, integrate them in a Data Warehouse (DW) and get analytical reports in a very short time. Figure 6 presents traditional business intelligence architecture with components that can be used to deliver solutions for business needs.
Figure 6 - Traditional Business Intelligence Architecture [11 p. 7] DW ETL process Data Sources Online Analytical Process
The major steps to deliver timely BI reports for business persons are: extraction, transformation, loading, creating data marts with Online Analytical Processes (OLAP) and deliver BI reports. Extraction, transformation and load are related to data integration process (DI), which is performed by BI systems to allocate data into a DW as shown in Figure 6. To implement DI process it is essential to identify data sources. In BI systems, data is extracted from enterprise sources such as ERP, CRM, financial systems, databases, text files, among others. These sources may reside in different locations and on different platforms. After data is loaded into DW, BI systems apply OLAP techniques to generate Data Marts (DM) [12]. Using OLAP data is stored into small databases called Data Marts, which give the opportunity to generate various reports, to have fast access to data by specific groups and distribute information to remote sites. As shown in Figure 6, BI starts from data sources to support users in the process of analyzing very large quantity of information and delivers management reports. It generates semi or fully automatic reports in order to answer daily business questions [13 p. 5].
In an organization, the following steps should be performed to implement a BI project [14]:
1. Define data sources – In enterprises departments, data is usually stored in databases via applications;
2. Understand business needs – The identification and understanding of business needs will enable to construct DW and transform data to business information; 3. Create Data Warehouse - Define measures, dimensions and fact tables to create
a data warehouse;
4. Make an ETL process – ETL process is used to store information into the data warehouse. BI tool can automatically import and transform data from different systems and different locations.
5. Analyze data and deliver reports – OLAP tool is used to store data in cubes from DW in order to analyze data. From cubes, reports are developed and distributed to decision makers.
These described five steps are the traditional path to develop BI projects. It enables to answer to business needs in enterprises by focusing on exploring and
delivering real time business information. BI has also the possibility to use predictive analysis tools, which helps to give recommendations to business persons using data mining techniques. For example, it allows to estimate the future growth of the enterprises according to its business types [14].
Business requirements often change overtime and depend on economic impact, regulations and many other factors. Because of that, BI applications and models need to be changed and populated overtime in order to support new type of requirements and make new type of analysis. For this reason, it is recommended to decrease reliance on Information Technologies staff [1 p. 2]. BI applications need to provide the ways for decision makers to fulfill their information requests related to their businesses via self-services.
New generation business intelligence applications have seven characteristics such as “access any data source, easy and accurate data visualization, see relationships, communication and collaboration, data in view all of the time, intuitive interface, desktop or server based” [15]. They have also self-services capability which uses five type of BI search: report search, faced search, NLP search, exploration engines and text mining [16] that gives opportunity to search and explore large volume of data. Next generation BI system provides with advanced reporting tools, which gives ability to get dynamic reports. Advanced reporting tools allows to type key words in natural language to find needed information in a very short time. New generation BI tools use advanced language processing algorithms, which gives opportunity to parse questions in common language into SQL standard language with the objective to query databases (Figure 7).
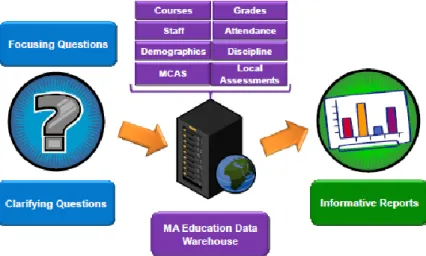
Finally, it should be noted that, according to Massachusetts Department of Elementary and Secondary schools [17 p. 6], BI can bring a set of benefits in educational institutions, which include:
To provide decision-makers with the meaningful information on what is working and what is not in education processes according to student attendance, grades, test scores, observations, disciplinary actions, and more;
Efficiently examine performance over time at multiple levels: student, class, grade level, school, and district.
Easily aggregate and disaggregate data, compare disparate data, and produce customized reports, providing more detailed and insightful information through the data analysis process (Figure 8).
Figure 7 - Self-Service BI application [18 p. 5]
Figure 8 - Massachusetts DW - clarifying questions through the data analysis process [17 p. 6].
3.5 Key Performance Indicators (KPI)
The objectives of key performance indicators (KPI) are to better evaluate organizations current business conditions and to help in planning the future. KPIs are used to measure business progress toward organization strategy and goals. Each KPI is a high summarized measure which is used in upper level of decision making. Decision makers define long term goals based on organizations strategy and mission which are not often changed. KPIs definition takes into account detailed goals and measures, which will reflect organizations most vital aspects. Measures represent a status indicator, showing whether these measures are within an expectable range [10 p. 19]. In the case of an educational institution, KPI could be: students‟ online subscription, accommodation occupancy rate, student‟s accommodation satisfaction, alimentation service, among others.
Key Performance Indicators (KPIs) are frequently used in dashboard reports in order to improve strategic and decision making activities. A Business Intelligence system can provide organizations with digital dashboard reports which are used to help executives and decision makers to make decisions better and faster [19 p. 3]. It enables decision makers to establish measures and criteria that are used to monitor and evaluate all business processes at a single glance in all level of the organization. Dashboards are based on Key Performance Indicators (KPI) measures and can include business values, goals, status and trends [20 p. 212]. Business intelligence usually gives the capability to create dashboard reports which are composed with KPIs components using visual graphical images such as stop light, gauges and other symbols. Dashboards reports provide the necessary status information about business trends at a single glance. Using dashboards in decision making activities, decision makers are able to evaluate organizations health and correct problems on time. Dashboard reports are also useful to determine how the organization moves towards specified goals. Figure 9 shows a digital dashboard report example, where we can see values, goals, status and trends of KPIs.
All processes which influence organizations businesses could be captured in dashboards. This feature distinguishes dashboards from other reports as an effective management tool for measuring, evaluating and monitoring all organization levels in order to compare performance with defined goals. The KPIs types depend on the nature of the organization and organization‟s strategy.
Figure 9 - Digital Dashboard report
3.6 Operational Database
Operational databases are used to store daily transactional data during business processes. The usage of operational database systems allows the management of data in an organized manner. Operational databases are also called transactional databases or Online Transactional Processes (OLTP). According to Larson [10 p. 26], “OLTP systems are embedded into the applications and front users are able to manage their data by inserting, editing, deleting, updating, filtering, summarizing and reporting”.
There are several kind of databases such as row oriented, column oriented, object oriented, among others. From them, row oriented relational database management systems (RDBMS) are mostly used in applications to support OLTP, which are data source systems for BI tools and data warehouses [21 p. 13].
In databases, similar and logically connected data are grouped into subjects called data entities or tables. These data entities/tables have relationships between them, which form the relationship model, that‟s why these systems are called Relational Databases Management systems (RDMS).
In RDBMS tables consists of a set of attributes [22 p. 25] also called fields, which defines what kind of data can be stored. The data which is stored in the fields are called tuples or records. Table must have a unique name and fields have a name and type, where type specifies what type of data can be stored and name gives a way of accessing. Each table must have a primary key that identifies each record. The relationships between tables can be established using reference keys. Reference key means that a table has a Foreign Key [22 p. 315] that is a field or a combination of fields whose values match a primary key of another table.
Figure 10 represents an example of a relational model of OLTP system. We have four data entities - Class, Student, Presence and Lesson that are related to each other. Table Class has one attribute Class_id, which is the Primary Key. Tables Student and table Lesson are related to table Class using Reference key.
Figure 10 - Relational Database Model [23]
Database systems have data query tools that use SQL (Standard Query Language), and are used to retrieve information from databases using the relational model of the databases [22 p. 20]. With Data Query Tool we can manipulate data from databases in order to retrieve appropriate information, make summary of data, get reports, edit, delete, update and transfer data into other database systems.
3.7 Data Warehouse systems
“A data warehouse is a subject-oriented, integrated, time variant, non-volatile collection of data that serves as a physical implementation of a decision support data model and stores the information on which an enterprise needs to make strategic decisions” [24 p. 2].
Data Warehouse (DW) platform consist of hardware servers, operational systems, database management systems and storage infrastructure [25 p. 6]. Data
Warehouses concepts can be used in any kind of business fields. They can be used in manufacturing, educational institutions, tourism industry, among others.
OLTP systems are used as data sources for data warehouses (DW). The objective of a DW is to collect and integrate all data across different systems and locations and locate them into one source. From the transactional databases we can store large volume of data in a DW, in a central, manageable, analytical, governable location, from where we can get summary reports, which will help to support decision making processes [26 p. 33]. Allocating the data into a DW from multiple data sources is the result of integration process, with the purpose to have accurate information in a timely manner.
Data warehouse models includes business entities like customer, product, finances and functions like sales, supply chain, operations, which represent whole enterprise performance. The data which will be stored in DW will be historical, read-only data.
The process of storing data from transactional databases into a data warehouse is called ETL process, which means Extract, Transfer and Load [10 p. 30]. ETL process has the objective to collect data from diverse sources and to aggregate it into a dataset to provide DW with complete, trusted data [27 p. 9].
A data warehouse consists of dimension tables and fact tables. In dimension tables data is stored by subject. Fact tables are connected to dimension tables from where they take quantitative/qualitative values. For example students name, address and phone number could be stored in students dimension table. From dimension tables, data are populated into fact tables and measures are calculated.
A measure, also called a fact, is a numeric quantity which expresses some characteristic of organizations performance. The information that this quantity represents is used to support or assess the performance and decision making of an organization [10 pp. 30-31].
Numerical measurements are stored in fact tables which are taken from the intersection of dimension tables [28 p. 12]. For example, students‟ subscription number across schools, locations and time could be a numerical measure in fact table, where schools, location and time are intersection (dimensions).
The creation of a data warehouse is a preparation step in order to use business intelligence systems. To analyze data, it is better to run BI systems over DW than over OLTP systems. The reason is that the use of a DW allows to have complete, integrated and historical information and at the same time, the system is independent from transactional processes. In fact, if we use a transactional database to analyze the data whilst there are a lot of transactions, there is the possibility that the system will halt and overload.
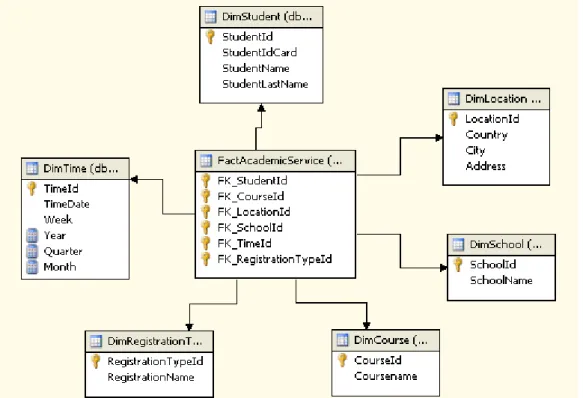
The most usual process to create a DW system is to use a database system such as Relational Database Management System (RDBMS). To create a data warehouse there is two possible data models: Star and Snowflake models. They are based on relational database concepts and are composed of dimension and fact tables. In star model each dimensional table is directly connected to fact tables. Figure 11 is an illustration of DW star model.
Figure 11 - Data Warehouse Star Model [29 p. 19]
On the other hand, snowflake model is based on hierarchies. “A Hierarchy is a structure made up to two or more levels of related dimensions. A dimension from the next at an upper level of the hierarchy completely contains one or more dimensions lower level of the hierarchy” [10 p. 35]. In Snowflake model each level of a hierarchy is stored in a separate dimension table and they are connected to fact
tables thought the up hierarchy dimensional tables. Figure 12 illustrates a DW snowflake model.
Figure 12 - Data Warehouse Snow Flake Model [29 p. 20]
The use of a data warehouse gives the opportunity to deliver solutions quickly, and allows enterprises to be mature and be ready to provide data for new solutions. With extended, growing and customized capability, DW allows to develop multiple new BI solutions and be mature to answer new type of business demands in the future [25 p. 8]. In fact, according to Massachusetts Department of Elementary & Secondary Schools [17 p. 5], Data Warehouse can bring a lot of benefits to educational institutions, like:
Time saving in making decisions;
Being able to access real time information on time in order to improve educational performances;
Data warehouse can be used to aggregate and disaggregate data and produce customized reports;
Integration and transformation capability to allocate all data about educational processes in one common place for future use.
3.8 Online Analytical Process (OLAP)
BI application offers analysis services tools to analyze business data. This process is called Online Analysis processes (OLAP). OLAP tool use a cube structure, being data extracted from data warehouse and loaded in cube. OLAP has multiple features such as Key Performance Indicators to monitor business processes, Multidimensional Expression (MDX) to get analyzed information for reports and Unified Dimensional Model (UDM) which enables to slice-dice and get summarized information.
After the execution of data integration process, which loads data into a DW, it is possible to apply OLAP tool to analyze integrated data. To analyze data, OLAP uses multi-dimensional data cubes retrieving information from measures, dimensions, hierarchies and cubes [10 p. 39].
OLAP cube consists of cells which store summarized data called measures. Dimensions divide a cube into sections. Each tuple in OLAP cube is associated to hierarchies. Hierarchies are dimension levels which are also defined in cube [10 p. 284]. Figure 13 illustrates an example of a data cube.
Figure 13 - A data cube example.
In OLAP cube it is possible to calculate measures and navigate through the cube using MDX expressions and functions. Calculation can involve a number of different fields from different tables. In OLAP calculations are performed using Multidimensional Expression language (MDX). For example, in OLAP, KPI could be developed using MDX expressions for dashboards reports, which could be used to
calculate the KPI values, goals, current status and trends in order to compare values with business rules.
OLAP tool gives the ability to use several useful operations such as:
Roll-up - taking the current data objects and doing further grouping by one of the dimensions;
Drill-down - The drill-down operation is the opposite of roll-up. It navigates from less detail data to more details;
The slice operation performs a selection on one dimension of the given cube, resulting is a sub-cube;
The dice operations define a sub-cube by performing a selection of one or more dimensions;
Pivot (Rotate) - Pivot is a visualization operation that rotates the data axes in view in order to provide an alternative presentation of the data. It allows visualization of the other side of the dice.
3.9 BI Reports
The main purpose of BI tools is to deliver reports to decision makers. All the strike of BI is to create high quality reports in a timely manner. BI reporting service enables the distribution of reports throughout the organization in a timely manner using Information Technologies (IT). Reporting service are composed by multiple programs, has series of services, web applications and databases, that work together in order to create a report management environment. BI uses data marts from the analysis service (shown in Figure 14) to develop web based or local reports. Analysis service allows to access data with external applications to develop reports that could be used in different applications like spreadsheets. BI report services allow to provide users with reports in most appropriate formats, since it is in general possible to produce different kind of report formats such as HTML, PDF, TIF, among others.
Reports can be constructed using SQL (Query relational database), MDX (Query Multidimensional Databases) and DMX (Query for Data Mining). These queries are used to extract data from defined sources and to provide these data to reports. Once the report is developed, it can be deployed in a report server. End-users can interact with