Master of Science in Geospatial
Technologies
Universitat Jaume I, Castellon
NOVA IMS, Lisbon
Institut fur Geoinformatik, Munster
Open Data, a new approach with
GIS components
Supervisor:
Dr. Sven
Casteleyn
Author:
Dr. Albert
Gil Escura
Co - Supervisor:
Dr. Marco
Painho
Co - Supervisor:
Dr. Joaquin
Huerta
Acknowledgments
I would like to thank Dr. Sven Casteleyn and Mr. Sergi Trilles for their advices and their assistance. This work is their work.
I would also like to thank the recommendations of Dr. Marco Painho and Dr. Joaquin Huerta.
I would want to dedicate this work to Joaquin Huerta and Michael Gould for trying to help me in a very delicate moment of my life last year.
Thank you.
Abstract
In this work, we wanted to develop a proposal to improve the Open Data Infras-tructure in Universitat Jaume I.
To do this, we have studied the definition of Open Data and its principles. In addition, thanks to the rise of GIS technologies, we have studied how to add some GIS components to our proposal. These components are to manage spatial data, to visualize spatial data and to process spatial analysis. We have also made a comparison between different Open Data Infrastructures to get a general idea of how is running today. From a practical perspective, it can give a requirements for an implementation of an Open Data Infrastructure for Universitat Jaume I. Finally, we made a two cases study and we have done a test that has given us some ideas as future work.
Keywords
Open Data
Open Data Infrastructure GIS Components
Transparency Participation Collaboration Framework Spatial Analysis Visualization Life Cycle
Acronyms
API - Application Programming Interface CSV - Comma Separated Values
GEOJSON - Geographic JavaScript Object Notation GIS - Geospatial Technologies System/Science ICT - Information and communications technology JSON - JavaScript Object Notation
REST - Representational State Transfer GPS - Global Positioning System
UJI - Universitat Jaume I iOS - iPhone OS
Contents
Acknowledgments iii
Abstract v
Keywords vii
Acronyms ix
1 Introduction 1
1.1 Motivation. . . 1
1.2 Context . . . 3
1.3 Objectives . . . 4
1.4 Research questions and hypothesis . . . 4
1.5 Methodology and Organization of the thesis . . . 4
2 Literature Review 7 2.1 Introduction . . . 7
2.2 Transparency, Participation, Collaboration and how contribute to this proposal . . . 8
2.3 Principles of Open Data and how contribute to this proposal . . . . 9
2.4 GIS components and how contribute to this proposal. . . 11
2.4.1 Data . . . 11
2.4.2 Process . . . 13
2.4.3 Visualization . . . 14
2.5 Summary of what Open Data proposal should be . . . 14
2.6 Related work . . . 15
2.6.1 ArcGIS Open Data . . . 15
2.6.2 Geoportal and Linked Open Geodata . . . 15
3 Open Data Benchmarking 17 3.1 Introduction . . . 17
3.2 Explanation for the comparative. . . 18
3.3 Results. . . 21
3.4 Current Status of UJI Open Data . . . 23
4 Open Data Development 25 4.1 Introduction . . . 25
4.2 Requisites . . . 26
4.3 Technologies. . . 27
4.4 Life Cycle . . . 28
4.4.1 Administrator . . . 29
4.4.2 Documentation . . . 34
4.4.3 API . . . 36
4.5 Case studies . . . 37
4.5.1 Departments . . . 37
4.5.2 Waste Containers . . . 43
5 Open Data Feedback 49 5.1 Test . . . 49
5.1.1 To get drugstore name list . . . 49
5.1.2 To get each drugstore information. . . 50
5.1.3 To get the drugstores are within a certain distance of our location . . . 50
5.2 Results. . . 51
6 Conclusions and Future Work 53 6.1 Conclusions . . . 53
List of Figures
2.1 Linked Geo Data Browser . . . 16
3.1 Euskadi Open Data Infrastructure . . . 18
3.2 Barcelona Open Data Infrastructure . . . 19
3.3 Castellón Diputación Open Data Infrastructure . . . 20
3.4 UJI Open Data Infrastructure . . . 21
4.1 Creating a new dataset . . . 29
4.2 Displaying datasets . . . 29
4.3 Adding a new field in dataset . . . 30
4.4 More options in a dataset . . . 31
4.5 The dataset view. . . 32
4.6 Adding a new value in a dataset . . . 33
4.7 The documentation 1 . . . 34
4.8 The documentation 2 . . . 35
4.9 The documentation 3 . . . 35
4.10 The documentation 4 . . . 36
4.11 UJI Open Data view . . . 38
4.12 UJI Department Row . . . 38
4.13 Creating the department dataset . . . 39
4.14 Adding a new field in the department dataset . . . 40
4.15 Importing data in department dataset . . . 40
4.16 Displaying data without spatial data . . . 41
4.17 Adding a polygon type in department dataset . . . 41
4.18 Editing spatial data in department dataset . . . 42
4.19 Displaying the department dataset . . . 43
4.20 Creating the waste containers dataset . . . 43
4.21 Adding new field in waste containers dataset . . . 44
4.22 Adding new values in waste containers dataset . . . 45
4.23 The documentation of waste containers dataset . . . 46
4.24 The fields of waste containers dataset . . . 47
4.25 iOS application views. . . 48
5.1 The documentation of Drugstore Dataset 1 . . . 50
5.2 The documentation of Drugstore Dataset 2 . . . 51
6.1 Open Data Login Example . . . 55
List of Tables
3.1 Open Data Names and Urls. . . 21
3.2 Open Data Results. . . 22
4.1 Spatial analysis.. . . 37
4.2 Department Location Fields.. . . 39
Chapter 1
Introduction
The objective of this chapter is to summarize the scope of the present thesis. To do this, in section 1.1 we suggested a motivation for our work. The context of the thesis is in section 1.2. The objectives of this thesis are explained in sec-tion 1.3. The research questions and hypothesis are listed in section 1.4. Finally, the methodology and the organization of this thesis are in section 1.5.
1.1 Motivation
We live in times of change [Oscar Cortés, 2013].On the one hand, we have an institutional crisis that has generated discontent among citizens and politicians. The spanish corruption, combined with ineffective institutional responses, is likely to have produced widespread dissatisfaction and distrust on the part of Spanish citizens [Manuel Villoria et al., 2012]. In Spain, a process of change started when a few demonstrated through movement 15M in 2011 with the support of people. The 15M was followed with interest by the majority of citizens and more than 70% of the population valued it positively [S. Martí i Puig, 2011].
Further, we have a technological transformation centered internet and mobile devices. According to a survey of AIMC1, 85% of respondents reported having used
a smartphone to connect to the internet with an average of more than 3 hours of daily consumption of news being the main reason for access [AIMC, 2015]. One reason for this change is the rise of Web 2.0. According to Wikipedia:
1Association for Media Research
2 CHAPTER 1. INTRODUCTION
Web 2.0 describes World Wide Web sites that emphasize user-generated content, usability, and interoperability. A Web 2.0 site may allow users to interact and
collaborate with each other in a social media dialogue as creators of user-generated content in a virtual community, in contrast to Web sites where
people are limited to the passive viewing of content.
The tools used in Web 2.0 are blogs, wikis, podcasts, videos, images, social networks. The most important innovation of Web 2.0 is to make the Web into a platform for publishing and production of content and applications by any user [Domingo et al., 2010].
In parallel, there are many authors and many social groups who support the thesis that people are calling for more transparency, more participation and more cooperation in administrations as one method to resolve this crisis and they are similar to web 2.0 [Rubio, 2014]. These three concepts are also included in the def-inition of Open Government. Open Government is the governing doctrine which holds that citizens have the right to access the documents and proceedings of the government to allow for effective public oversight [Lathrop, Ruma, 2010]. A transparent government encourages and promotes accountability of government to citizens and provides information on what it is doing and its plans of action. The objective is to inform the public all the information necessary for it to work criti-cally. A government that promotes citizen participation favors the right of citizens to actively participate in shaping public policy and encourages the Administration to benefit from the knowledge and experience of citizens. A government that pro-motes collaboration involves and engages citizens and other agents in the proper work of the Administration [Oscar Cortés, 2013].
Finally, according to the European Commission, Open data refers to the idea that certain data should be freely available for use and re-use [EC, 2011]. European Commission support open data for 4 reasons:
• Public data has significant potential for re-use in new products and services. • Addressing societal challenges – having more data openly available will help
1.2. CONTEXT 3
• Achieving efficiency gains through sharing data inside and between public administrations.
• Fostering participation of citizens in political and social life and increasing transparency of government.
The Open Data foundations are transparency, collaboration, participation. These foundations are exactly the same as the Open Government and also the same as spanish people claim to solve their problems. Open data is a tool that can help solve this problem.
1.2 Context
To contextualize the topic in this thesis, we must first define what is Open Data. Open data can be a movement. Open Data is the idea that some data should be freely available to everyone to use and republish as they wish, without restrictions [Wikipedia, 2016].
Open data can be a infrastructure. As we mentioned in section 1.1 Web 2.0 and Internet have transformed the society. Therefore, the idea of opening data for everyone is much more feasible. Today, when we refer to an organization it has an open data, in fact, we are saying that the organization has a web site with public information available to everyone.
The main objective of this thesis is to develop an Open Data Infrastructure of the University Jaume I. For this, the first step will be to define what an Open Data. Sunlight Foundation defined a series of principles Open Data. With these principles we resolve the ambiguity that generates the idea of opening data.
According to IGN2, 80% of the information managed by administrations may
contain a spatial reference [Suarez, 2012]. This aspect invites us to consider with special attention the information from an Open Data applied to an institution like the University Jaume I especially becomes important. Therefore, the next step will be to define the GIS components and apply them to our proposal of Open Data Infrastructure.
In short, the goal of this thesis will be to develop a proposal for an Open Data Infrastructure that supports spatial data.
4 CHAPTER 1. INTRODUCTION
1.3 Objectives
In particular the objectives of this thesis are divided into the following parts.
• To define an Open Data that allows managing spatial data.
• To made a comparison on different Open Data Infrastructure previously selected.
• To develop a proposal Open Data Infrastructure for the University Jaume I.
• To make a questionary to test the usability of Open Data Infrastructure and to analyze results.
1.4 Research questions and hypothesis
From the previous context this question is considered to be answered during this thesis.
• Which improvements can be made in UJI Open Data?
• Which GIS components can be useful for the UJI Open Data?
• What contribution can have our proposal of UJI Open Data?
1.5 Methodology and Organization of the thesis
The study begins with a literature review in some depth of concept of Open Data, a brief explanation of the objectives and some questions that resolve this work.
Secondly, the theoretical framework, explains the principles of Open Data that we need to know. These are the requirements of our Open Data Infrastructure. In addition, we also need to know which components has a GIS application to apply in our Open Data Infrastructure.
1.5. METHODOLOGY AND ORGANIZATION OF THE THESIS 5
Fourth, we explain the strengths of the proposed development of our Open Data Infrasctructure.
Fifth, we explain the fact feedback ten developers to determine the level of acceptance of our Open Data Infrastructure.
Chapter 2
Literature Review
2.1 Introduction
The literature review is divided into three main chapters plus a final conclusion.
The first section 2.2 talked about the context of the Open Data on concepts of transparency, participation and collaboration and how these concepts help to develop our proposed Open Data explained in this paper. The current concept of Open Data is not understood without theses terms and helps to contextualize the Open Data Movement in our society.
In the second section 2.3 we do a Open Data definition as specific as possible and we explain each principles of Open Data. We also explain the requirements of our proposed Open Data that support each of these principles.
In the third section 2.4, we explain why GIS is a important contribution to our proposed Open Data. How we can add spatial information in our Open Data, such as how to process and view geographical data. Based on the GIS definition we explain the components applied to our Open Data proposal.
Finally, we make the first brief in section 2.5, explanatory summary of what Open Data proposal should be.
8 CHAPTER 2. LITERATURE REVIEW
2.2 Transparency, Participation, Collaboration and
how contribute to this proposal
The Open Data movement are focused in three aspects, transparency, partici-pation and collaboration[Patrice McDermott, 2010]. There are many versions of Open Data [Borglund, 2014]. That is why The Sunlight Foundation identifies and establishes the principles that explain in the next section 2.3. However, all open data have in common the three pillars mentioned above.
Open Data is a tool that helps transparency. This allows citizens to access the data published since they are always available for use. We imagine for example, the publication of the annual accounts of an organization or the geographic information of the public buildings have. In addition, the opportunity to add new data sets is very wide.
Open Data is a tool that helps to participation. Citizens can help to add new information. They can also warn that such information may not be appropriate. Participation can be manifested in many forms, from a person detects any incorrect information, for someone to propose a new set of data that does not exist or a fault in particular. This directly affects the quality of published data, as well as provide a means for the public to show their opinion about the services offered.
Open Data is a tool that helps collaboration. It is also called shared value because the information can be used for everyone freely. There is a benefit to the organization and there is a benefit for those who use the data for their own benefit. As the information is public, any person or company can make use of the information. Therefore, to use this information to develop their own mobile applications is an initiative that adds value to the organization that has a Open Data and the individual developer of mobile application, as it is generating a shared value[Garcia, 2014].
The Open Data initiative improves interoperability between administrations, in our case, between universities, but also with the local government or educational administration. In addition, it also seeks cooperation with the private sector re-lated to universities.
2.3. PRINCIPLES OF OPEN DATA AND HOW CONTRIBUTE TO THIS PROPOSAL9
data. Finally, Open Data helps collaboration with the organization, internally and externally with other public or private organizations.
2.3 Principles of Open Data and how contribute
to this proposal
According to Open Knowledge Foundation1 open data is defined as data that can
be freely used, reused and redistributed by anyone - subject only, at most, to the requirement to attribute and sharealike. In 2008, because of the definition falls short of 8 operating principles of Open Data were established.
To achieve these purposes, the data must meet several characteristics. In fact, open data should be able to be freely used, reused and redistributed by anyone, be-ing, if necessary, subject only to acknowledgment of authorship and redistribution under the same or a similar license to the original[Open Knowledge, 2014]. All these characteristics that must define the data is usually collected on the known principles of open data, driven by the Sunlight Foundation2, which are generally
accepted in the context of open data projects developed worldwide.
1. Completeness. All public data is made available. Public data is data that is not subject to valid privacy, security or privilege limitations. Datasets should be as complete as possible.
In our Open Data, the data is always available and can export all the infor-mation presented. In addition, so that this inforinfor-mation can be reused, an application developer can use the information in their apps.
2. Primacy. Data is as collected at the source, with the highest possible level of granularity, not in aggregate or modified forms.
The data of the Open Data should be considered as a source and verified information. This point is beyond our proposal because our datasets are a test.
10 CHAPTER 2. LITERATURE REVIEW
3. Timeliness. Data is made available as quickly as necessary to preserve the value of the data.
Both the web application and the web service is always available for use. If the service shuts down, all applications and who want to see the information they can not.
4. Accessible. Data is available to the widest range of users for the widest range of purposes.
The information is considered as open public you will always have to be accessible. In our application all the information available.
5. Machine processable. Data is reasonably structured to allow automated processing.
The information on our Open Data is structured in simple datasets. The data types that make up a dataset can be text, a number or a spatial data, such as a point or a line. All information of a dataset is structured and hence, it is possible to display and then represent it.
6. Non-discriminatory. Data is available to anyone, with no requirement of registration.
In our dataset is no need to register to access the information. But to manage information and create a dataset or edit another.
7. Non-propietary. Data is available in a format over which no entity has exclusive control.
The format that we use our dataset is internally JSON. We can export the information in JSON or CSV format, which are open formats. Add other formats is possible and does not require too much difficulty to implement it.
8. License-free. Data is not subject to any copyright, patent, trademark or trade secret regulation. Reasonable privacy, security and privilege restric-tions may be allowed.
2.4. GIS COMPONENTS AND HOW CONTRIBUTE TO THIS PROPOSAL.11
9. Permanence. The capability of finding information over time is referred to as permanence.
10. Usage Costs. There should be no cost to access the data.
2.4 GIS components and how contribute to this
proposal.
Once we have established the basic requirements that you will have our Open Data, in this chapter we make a GIS definition with the GIS components that our proposal have. Next step, we make several comments about how important are spatial data in our open data.
Our starting point of this study begins with the need to add spatial informa-tion to our open data. We know that 80% of the informainforma-tion managed by the Administration contains a spatial reference[Suarez, 2012]. Accordingly, if we are to develop an open data for administration, in our case, the university, it is very important to study the spatial references. So, we explain the definition of a GIS application and then we explain the requirements that our application have.
Basically, a GIS must allow performing the following operations[Olaya, 2011]
• Spatial data management. A GIS must be able to read, edit, storage spatial data.
• Spatial analysis. A GIS must be able to perform processes on spatial data. • Visualization of the results as a maps, reports or other formats like
geoJSON.
2.4.1 Data
12 CHAPTER 2. LITERATURE REVIEW
attributes, based on Javascript Object. Notation. JSON is a lightweight data-interchange format. It is easy for humans to read and write. It is easy for machines to parse and generate[json.org, 2008].
The management of geographic data in an Open Data presents the challenge of establishing a usable implementation[Newman et al., 2010]. Users need to un-derstand how geographic data can be managed with a simple method. In the chapter 4we explain how we develop a possible solution.
GeoJSON can take many forms:
To a point, the representation may be as follows {
” type ” : ” Feature ” , ” geometry ” : {
” type ” : ” Point ” ,
” c o o r d i n a t e s ” : [ 1 2 5 . 6 , 1 0 . 1 ] } ,
” p r o p e r t i e s ” : {} }
To a line, the representation may be as follows {
” type ” : ” Feature ” , ” geometry ” : {
” type ” : ” L i n e S t r i n g ” ,
” c o o r d i n a t e s ” : [ [ 3 0 , 1 0 ] , [ 1 0 , 3 0 ] , [ 4 0 , 4 0 ] ] }
} ,
” p r o p e r t i e s ” : {} }
To a polygon, the representation may be as follows {
” type ” : ” Feature ” , ” geometry ” : {
2.4. GIS COMPONENTS AND HOW CONTRIBUTE TO THIS PROPOSAL.13
” c o o r d i n a t e s ” : [ [ [ 3 0 , 1 0 ] , [ 4 0 , 4 0 ] , [ 2 0 , 4 0 ] , [ 1 0 , 2 0 ] , [ 3 0 , 1 0 ] ] ]
} } ,
” p r o p e r t i e s ” : {} }
GeoJSON format not only serves to represent simple geometries, it is also possible to make multiple representations as a group of geometries, they are called FeatureCollection. These geometries can be used to display the results of spatial analysis applied in our Open Data.
As we have said before a GIS application must be able to manage spatial data. Our Open Data manages spatial data with geoJSON. We may introduce a point or polygon GeoJSON manually typing like a string. We can also introduce a point or polygon using a map and drawing the figure we need. Therefore, one of the first challenges is to facilitate the use of spatial information for people who use the Open Data from the administrative to the end developer. In the case of a developer we need to document the open data[Suarez, 2012]. If we document the Open Data, each of the datasets, we facilitate the use of Open Datay and we increase participation, which is one of the objectives of an Open Data.
Another issue is that json and geojson are free and open formats. In devel-oping apps, they are most commonly used formats. Therefore, we are helping to interoperability between administrations and companies using our Open Data. Collaboration is an important piece in the Open Data movement.
2.4.2 Process
Spatial analysis is one of the basic functions of GIS. A GIS always incorporates a number of formulations that allow getting results and spatial data. These formu-lations represent processes that can be very simple or extremely complex. There are different types of spatial analysis[Olaya, 2011].
14 CHAPTER 2. LITERATURE REVIEW
When performing a process such as transformation, the result could be a multiple or complex geometry
2.4.3 Visualization
Any type of information can be represented graphically, which it usually facilitates the understanding of that information or part of this. Many of the characteristics of information are easier to study when they rely on some visual element[Olaya, 2011]. In the case of geographic information, the visualization is not only a way more work with that information, it makes it easier and intuitive processing that in-formation. The geographic information has an inherent visual nature, since space itself is understood graphically by humans. We must not forget that geographic information is stored in a traditional maps. A map is itself a representation visual the information on geographical[Olaya, 2011].
In our proposal, we may use a map in many parts of the application, in the process of creating data, in the process of editing data, in the process of reading data, in the process of obtaining the results of a spatial analysis.
2.5 Summary of what Open Data proposal should
be
We make a brief summary of the elements that we have explained that will be considered for the implementation of our proposal.
• The construction of the our Open Data should respect the Principles of Open Data.
• The Open data should allow the management, the processing and the visu-alization of spatial data through the geojson format.
• The formats of Open Data must be a open formats, to increase the use of the Open Data.
2.6. RELATED WORK 15
2.6 Related work
We have found some related work with the idea of adding GIS components in an Open Data Infrastructure. The first work is ArcGIS Open Data in section 2.6.1. The problem is the high cost of using this technology. The second work is the geoportals in section 2.6.2.
2.6.1 ArcGIS Open Data
Before we close this chapter, I would like to mention an initiative of ESRI on building your own platform Open Data which is currently under development and has many similarities with this project. Perhaps its major disadvantage is the high cost of its license.[esri, 2015]. For ESRI the benefits are:
• Improve basic functions of democracy and access to information.
• Provide a platform of innovation.
• Promote civic engagement.
• Encourage cross-jurisdictional and -agency data collaboration.
• Drive economic growth and value.
• Layer complex data to improve decision-making and reduce costs.
• Improve transparency for citizen engagement.
• Improve communications during a crisis.
• Improve data quality and create standards.
• Improve data quality because the information being shared comes from the government.
2.6.2 Geoportal and Linked Open Geodata
16 CHAPTER 2. LITERATURE REVIEW
editing, analysis, etc.) via the Internet. Geoportals are important for ef-fective use of geographic information systems (GIS) and a key element of Spatial Data Infrastructure (SDI) [Wikipedia, 2016].
LinkedGeoData is an effort to add a spatial dimension to the Web of Data / Semantic Web. LinkedGeoData uses the information collected by the Open-StreetMap project3 and makes it available as an RDF knowledge4 base
ac-cording to the Linked Data principles5. It interlinks this data with other
knowledge bases in the Linking Open Data initiative [Linkedgeodata.org, 2016].
Figure 2.1: This is a browser in a linked open geodata.
These projects are focused on the semantics of the web.
3Open Street Maps
Chapter 3
Open Data Benchmarking
3.1 Introduction
In this chapter we make a comparison of the various Open Data of that is in the Spanish government. It gives us some insight into what elements can be important in drawing conclusions for the implementation of our Open Data Infrastructure. Furthermore, we can compare the different Open Data Infrastructures with the specific UJI Open Data and we observe what elements would be necessary to add. Therefore, this chapter explain what questions we have chosen first to do the test. The questions or the reasons to perform benchmark are grouped into two groups. The first group are questions regarding whether the Open Data Infras-tructures complies or not with the principles of Open Data. The second group are questions regarding the Open Data consume spatial data. And then we add some generic issues.
Once we have specific questions and explained, the next step will perform benchmark on the following selected Open Data Infrastructure. We make a final conclusions explaining the key elements.
Finally, we make a few comments on the current situation of UJI Open Data and specify that similar elements with other Open Data Infrastructure have. This will help us define the final requirements for which we have relied for the imple-mentation of this proposed Open Data Infrastructure for the University Jaume I.
18 CHAPTER 3. OPEN DATA BENCHMARKING
3.2 Explanation for the comparative
The first group deals with the principles of Open Data. This is to compare whether the Open Data maintain the principles or infringe any of its principles.
1. Display datasets. If the datasets are available and view information on the web portal.
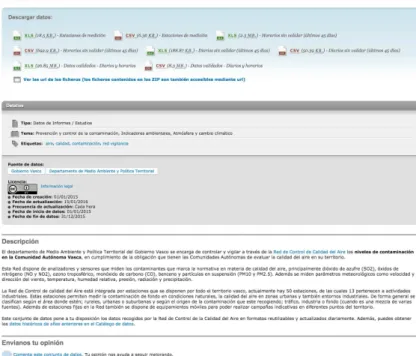
2. Has documentation. If the information is properly documented datasets as shown in Figure 3.1. It is therefore to recognize if the web site not only displays information but also displays information about the structure of each dataset and operations that can be applied to them. Also if it is able to export the information could be one of the operations.
Figure 3.1: Euskadi Open Data Infrastructure view displaying the information of a dataset.
3.2. EXPLANATION FOR THE COMPARATIVE 19
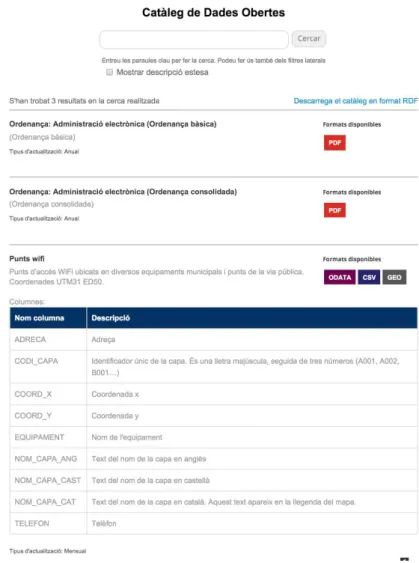
Figure 3.2: Barcelona Open Data Infrastructure view displaying a datasets with their available formats.
4. Registration required. If a registration is needed to access the data. 5. Payment required. If you need to pay to use the data.
6. Violates some principles. If you violate some other principle, which spec-ify.
20 CHAPTER 3. OPEN DATA BENCHMARKING
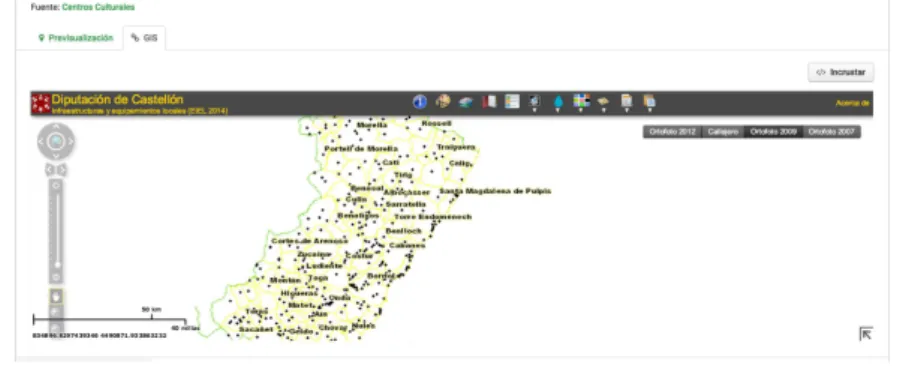
6. Has GIS capabilities. It has any GIS component as shown in Figure 3.3. 7. Spatial Data. Which spatial data manage the Open Data.
8. Spatial Analysis. If the Open Data process spatial analysis.
9. Display Spatial Data. If the Open Data can display geographic informa-tion.
Figure 3.3: Castellón Diputación Open Data Infrastructure view displaying a map in a dataset.
Other questions that we considered for the comparison we include the following.
11. Has a tutorial. If there is any guide on how to use the Open Data. 12. Number of datasets. The number of datasets have the Open Data. 13. Users can contribute. Users can interact with the Open Data, ie, they
may propose new datasets or may contact the administrator of the Open Data.
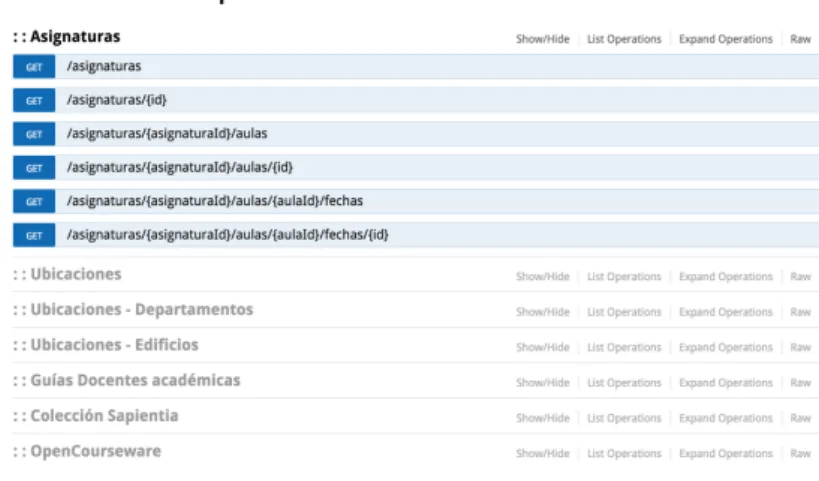
14. Has an API REST service. If the Open Data has a REST API for third-party applications can consume the data in your apps as shown in Figure
3.3. RESULTS 21
Figure 3.4: UJI Open Data Infrastructure view displaying a REST API documen-tation of available datasets.
3.3 Results
OD Name OD Url
Euskadi http://opendata.euskadi.eus/w79-home/es Valencia http://www.gvaoberta.gva.es/open-data Barcelona http://opendata.bcn.cat/opendata/ca Spain http://datos.gob.es/
Aragon http://opendata.aragon.es/
Navarra http://www.gobiernoabierto.navarra.es/es/open-data
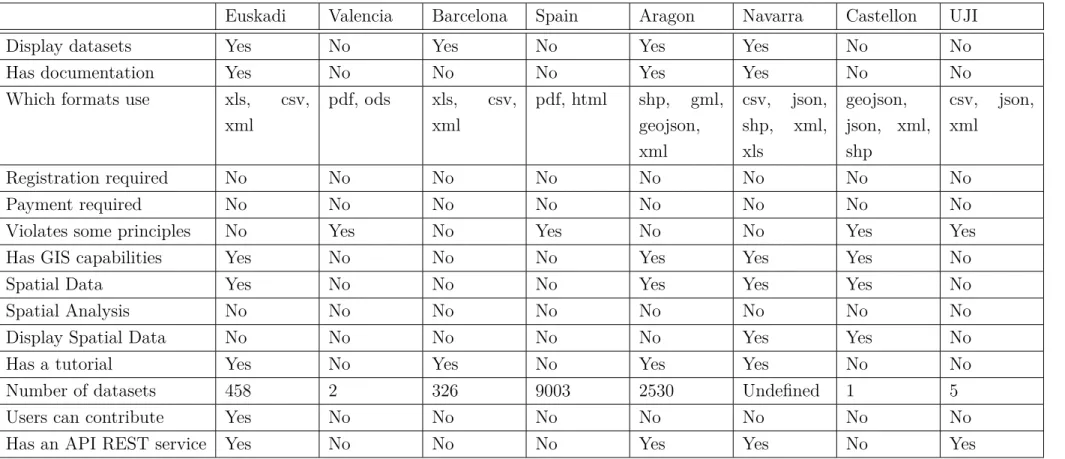
22 CHAPTER 3. OPEN D AT A BENCHMARKING
Euskadi Valencia Barcelona Spain Aragon Navarra Castellon UJI
Display datasets Yes No Yes No Yes Yes No No
Has documentation Yes No No No Yes Yes No No
Which formats use xls, csv,
xml
pdf, ods xls, csv,
xml
pdf, html shp, gml,
geojson, xml csv, json, shp, xml, xls geojson, json, xml, shp csv, json, xml
Registration required No No No No No No No No
Payment required No No No No No No No No
Violates some principles No Yes No Yes No No Yes Yes
Has GIS capabilities Yes No No No Yes Yes Yes No
Spatial Data Yes No No No Yes Yes Yes No
Spatial Analysis No No No No No No No No
Display Spatial Data No No No No No Yes Yes No
Has a tutorial Yes No Yes No Yes Yes No No
Number of datasets 458 2 326 9003 2530 Undefined 1 5
Users can contribute Yes No No No No No No No
Has an API REST service Yes No No No Yes Yes No Yes
3.4. CURRENT STATUS OF UJI OPEN DATA 23
The following conclusions may be drawn.
• The high number of datasets is not relevant. What is important is the quality of the data. Euskadi datasets are very well designed, whereas the open state data are merely independent unrelated files.
• One of the requirements of an Open Data is to display the information in a clear and understood by the user. We have found 4 Open Data Infrastruc-tures that do not show the information in a simple and understandable way. Display information is on the portal both their values and the structure of the dataset.
• The documentation is important to show how the dataset part. It helps to use. We have found up to 5 Open Data Infrastructures which have no documentation.
• The formats offered by each open data varies each and in most cases are provided two or more formats.
• All Open Data Infrastructures studied does not require payment or services are offered for use.
• Only 3 Open Data Infrastructures found using spatial data. Only two of them display information through a map and none of them processed some kind of spatial analysis.
• 3 Open Data Infrastructures has some sort of tutorial to help users suc-cessfully using the tool. Only one encourages active participation through contests of ideas.
3.4 Current Status of UJI Open Data
As seen in the above comparison, the UJI Open Data has some other limitations on the Open Data compared
24 CHAPTER 3. OPEN DATA BENCHMARKING
• The datasets are available in various formats.
• It does not have any geographic component.
• There is no guidance, nothing is displayed. Only formats that are available. • There is no contact to propose new datasets or warn of an error.
Chapter 4
Open Data Development
4.1 Introduction
This chapter explains how we design and implement the proposal to improve the UJI Open Data. We have choosed the requirements drawn from the previous chapters. The firts step in section 4.2 is a brief summary of the requirements we have assumed.
In section 4.3 we explain briefly what technologies we used. The Open Data Application is basically divided into three logical parts.
The sequence of steps from a dataset is created until it is used by an application called lifecycle[den Broek et al., 2013]. In section 4.4.1 we talk about the part of the administration. This part is responsible for managing information on the Open Data by the admin users. In section 4.4.2 we talk about the documentation site. In the documentation the Open Data shows all information about each datasets as its definition or their attributes. In section 4.4.3 we talk about the web service of the Open Data to communicate with external apps.
Finally, the last section we talk about some case studies in section 4.5. The first case study is about the departments of Universitat Jaume I in section 4.5.1. With this example, we use the import option to get information from the current UJI Open Data.
The second case is about the waste containers of Universitat Jaume I in sec-tion 4.5.2. With this example, we show how to consume data in a mobile applica-tion from the UJI Open Data.
26 CHAPTER 4. OPEN DATA DEVELOPMENT
4.2 Requisites
We need to define and specify the requirements for implementation of our Open Data. In section 2.3, we make a definition of Open Data and in section 2.4 we make a GIS definition applied to Open Data. Now we apply the theory to specify how the implementation of an Open Data system is defined.
This proposal should not be understood as a closed work. It is a starting point in the work and development of a tool that may be of interest not only for this university, also for any institution.
An open data contains a number of datasets. A dataset is a collection of information that contains a number of data type. This data type can be a string, a number or a spatial data as a point or a polygon.
A dataset can contain additional information related to the dataset that help better describe the dataset. This information is called metadata. Metadata may help to create order in datasets by describing, classifying and organizing information[Zuiderwijk et al., 2012]. In our open data we considered as metadata a contact email, a text description of the dataset and a location that determines a central point of the dataset if it uses spatial data.
We need to use a technology that allows to visualize the spatial information on a map. In Web 2.0 user interaction is done through web forms. We need a tool that allows to add spatial data using a web form and anyone can understand the process of adding information on any dataset. Furthermore, the Open Data documentation must be well explained.
The Open Data uses json, csv and GeoJSON. They are open formats.
Using information from each dataset the Open Data has to be able to perform spatial processes. As discussed in section 2.4 a spatial process is an operation on the data returned by another spatial information.
To complete the Open Data we need to implement a RESTful API. A RESTful API is an application program interface (API) that uses HTTP requests to get information or send information[Techtarget, 2015]. We explain in section 4.4.3
4.3. TECHNOLOGIES 27
4.3 Technologies
As we mentioned in section 1.1, Web 2.0 was a change that allowed users to interact on web applications. There are many Web 2.0 tools such as blogs or social networks. Therefore, it has been considered to implement the Open Data infrastructure as a web application. In addition, we selected nodejs as server-side application. According to Wikipedia:
Node.js is a development platform built on top of Google’s V8 JavaScript virtual machine. While JavaScript engines (including V8) are traditionally run in Web browsers to form the client side of aclient/server application, the Node.js libraries
are focused on building server-side applications in JavaScript.
Then we can list the following advantatges:
1. Node.js uses the same language on the server side and the client.
2. Oriented management to manage inputs and outputs. This is especially important for applications with a high number of requests, as in our case.
3. Designed to manage access to databases.
Node.js is not recommended for heavy applications. It is designed to manage large number of communications between clients and servers[Iscar, 2015]. There are many projects using Node.js. LinkedIn, the business-oriented social networking service uses Node.js. GitHub, a web-based Git repository hosting service uses Node.js.
In Node.js, the framework for building web applications is called Express. Ac-cording to Wikipedia:
Express is a minimal and flexible Node.js web application framework that provides a robust set of features for web and mobile applications.
28 CHAPTER 4. OPEN DATA DEVELOPMENT
MongoDB (from humongous) is a cross-platform document-oriented database. Classified as a NoSQL database, MongoDB eschews the traditional table-based
relational database structure in favor of JSON-like documents with dynamic schemas (MongoDB calls the format BSON), making the integration of data in
certain types of applications easier and faster.
Finally, to display the spatial data on a map we decided to use Leaflet.js. According Leaflet.js:
Leaflet is the leading open-source JavaScript library for mobile-friendly interactive maps. Leaflet is designed with simplicity, performance and usability
in mind. It works efficiently across all major desktop and mobile platforms.
There is a virtual machine with a version of the Open Data Infrastructure. We have used a Amazon Virtual Machine1. The address are:
• Documentation site: http://54.200.166.214:3000/
• API service for Departments: http://54.200.166.214:3000/api/Departments
• Administrator site: http://54.200.166.214:3000/structures (We do not rec-ommend access this area for safety)
4.4 Life Cycle
The sequence of steps from a dataset is created until it is used by an application called lifecycle[den Broek et al., 2013].
The life cycle is divided in two sections. In section 4.4.1 an admin can add a new dataset, can add new fields in a dataset and can add spatial data in a dataset. This section is responsible for adding new data. The other section is responsible for display data, both section4.4.2and section4.4.3display the same data in different way. In section 2.5 we conclude the documentation must be a well explained. In section4.4.3 we explain about a external application can use one of our datasets.
4.4. LIFE CYCLE 29
4.4.1 Administrator
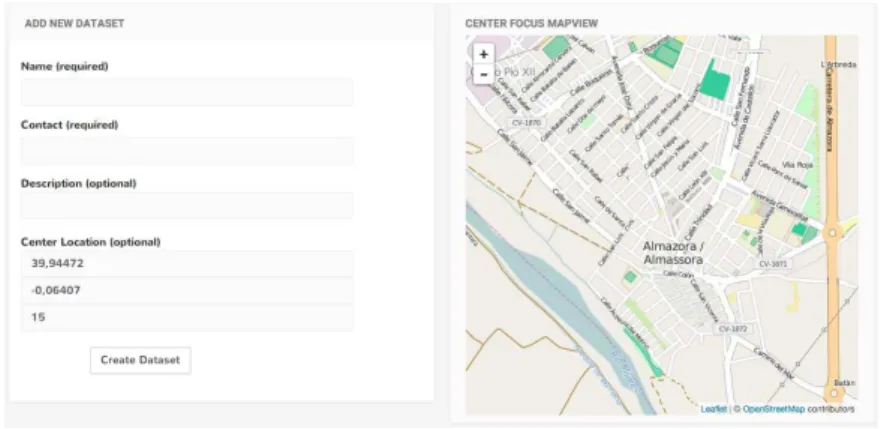
The task of the user admin is to manage the information in the Open Data. An user admin can add new datasets as shown in the Figure 4.1. When a dataset is created, it does not contain any data. The Figure 4.2 shows a list of the datasets available. We have two options, to manage the structure of each dataset and to manage the content of each dataset.
Figure 4.1: When we are creating a new dataset, we have the following view where we have to add a dataset name, a email contact, a description and spatial point.
Figure 4.2: You can view the list of datasets through a table consisting of a series of values such as name, description, contact and two buttons to access the dataset structure and content of the dataset.
30 CHAPTER 4. OPEN DATA DEVELOPMENT
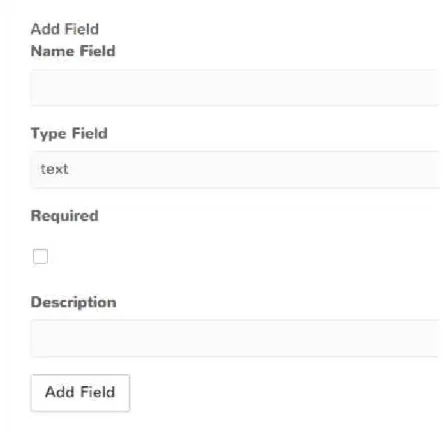
Figure 4.3: When we are creating a new field for a dataset, we need to add a name, type, if the data is required and a description.
The Type Field is a selector in the web form that shows the different types of data of the Open Data Infrasctructure. The types that are available are as follows:
• Text can represent a string or simple text.
• Number can represent a integer o floating number.
• Url represents a link of internet.
• File represents a binary file like a image or pdf.
• Point represents a location point in geojson format.
• Line represents a linea in geojson format.
4.4. LIFE CYCLE 31
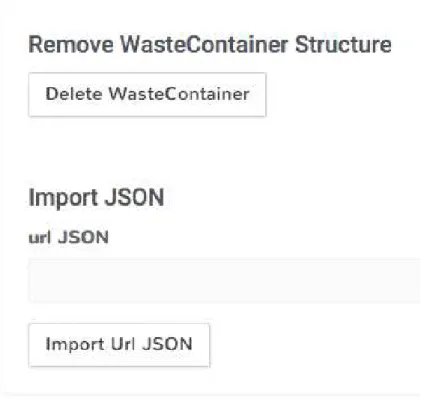
There are a more functions like, delete a specific field, import data from an external source and eliminate the dataset. These functions are in the same view in Figure 4.4
Figure 4.4: In a dataset there are other functions like to remove dataset and to import data.
32 CHAPTER 4. OPEN DATA DEVELOPMENT
4.4. LIFE CYCLE 33
34 CHAPTER 4. OPEN DATA DEVELOPMENT
4.4.2 Documentation
Figure 4.7: The documentation shows the list of the datasets where each dataset have one button to see the detail of each dataset.
4.4. LIFE CYCLE 35
Figure 4.8: The upper part of the documentation view shows a map and a table with the information of the dataset.
36 CHAPTER 4. OPEN DATA DEVELOPMENT
Finally, in Figure4.10the documentation view shows a different spatial analysis with the definition of each and how to use it is.
Figure 4.10: The documentation view shows list of available spatial analysis.
4.4.3 API
A RESTful API is an application program interface (API) that uses HTTP requests to get information or send information[Techtarget, 2015]. The role of API is to generate a communication with other applications such as mobile applications. In section 4.5.2 we see a case study where an iOS application consumes information from a dataset.
4.5. CASE STUDIES 37
Name Description of Spatial Analysis
center returns the absolute center point of all features
centroid calculates the centroid using the arithmetic mean of all vertices envelope returns a rectangular Polygon that encompasses all objects
extent calculates the extent of all input features, and returns a bounding box merge returns a single merged polygon feature. If the input polygon features
are not contiguous, this function returns a MultiPolygon feature nearest takes lat and lng params and returns the point from the set closest
to the reference
pointonsurface returns a Point guaranteed to be on the surface of the feature tin creates a Triangulated Irregular Network, or a TIN for short,
and returned as a collection of Polygons Table 4.1: Spatial analysis.
4.5 Case studies
The following case studies are examples of how we can use the open data. The first example in section 4.5.1 is a dataset about waste containers in which we will show how a mobile application can consume the data. The second example in section4.5.2 is a dataset of the departments in which we will show how to import data from another open data.
4.5.1 Departments
Step 1: Getting the department information
We can access to UJI Open Data2. As can be seen UJI Open Data has six datasets
in the next list and in the Figure 4.11
• OpenCourseware
• Guíes docents
38 CHAPTER 4. OPEN DATA DEVELOPMENT
• Sapientia: Humanes i socials
• Sapientia: Jurídiques i econòmiques • Sapientia: Tecnologia i experimentals • Ubicacions dels departaments
Figure 4.11: UJI Open Data shows that has only six datasets.
As explained in the section 3.4, this open data has many limitations. So the first step we do is add a new dataset as shown in Figure 4.13. But firts, we need to understand the Department Location dataset in this link:
http://ujiapps.uji.es/lod-autorest/api/datasets/ubicaciones/departamentos
Figure 4.12: UJI Open Data Department Row
4.5. CASE STUDIES 39
Field Value
nombreCA represents the name of department in valencian language nombreES represents the name of department in spanish language nombreEN represents the name of department in english language url represents url of department
acronimo represents acronym of department
Table 4.2: Department Location Fields.
Step 2: Creating the department dataset
The second step is to create the Departments dataset. Firstly, we create the Department dataset as shown in Figure 4.13
Figure 4.13: This is the view where we can create a new dataset.
Now, in Figure4.14we need to add this fields in the dataset and then, in Figure
4.15 we import the information with the next link:
40 CHAPTER 4. OPEN DATA DEVELOPMENT
Figure 4.14: This is the web form where we can add a new field in the dataset.
Figure 4.15: This is the web form where we can import data from other Open Data Infrastructure
Step 3: Adding a polygon field in the dataset
4.5. CASE STUDIES 41
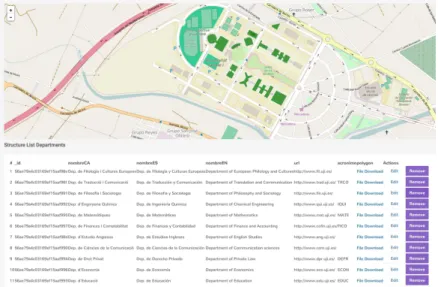
Figure 4.16: When we import a dataset without any spatial data, it only displays a table with the information
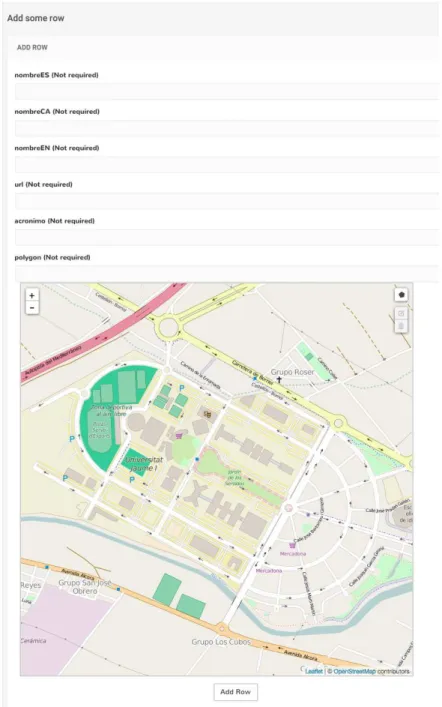
In Figure 4.17, we need to add a new field with a polygon type.
Figure 4.17: If we add a new field to an existing dataset, you have to edit each of their values manually.
Step 4: Drawing polygons for the dataset
42 CHAPTER 4. OPEN DATA DEVELOPMENT
Figure 4.18: Sequence of figures where is shown the process of edition of a polygon.
In Figure 4.18 there is a sequence of figures as we can modify a polygon by clicking the mouse. If we click on the polygon icon, we activate the mode of creation a polygon. Now, we can click in different places and the last click must be the same than the first. When you finish, the first polygon dissapears and the second polygon conforms. In addition, the GeoJSON input is updated. Finally, if we want to modify a polygon, we have two options, if you double click on a vertex will disappear. We can also drag a vertex to change its position.
4.5. CASE STUDIES 43
Figure 4.19: Final result when we have edited the dataset entirely.
We are done. We were able to update the dataset of UJI departments in our system by adding a new field of polygon spatial type.
4.5.2 Waste Containers
Step 1: Creating the waste containers dataset
The first step is to create the waste containers dataset as shown in Figure 4.20
Figure 4.20: This is the view where we can create a new dataset.
44 CHAPTER 4. OPEN DATA DEVELOPMENT
Field Type Value
type text represents the type of a container
count number represents the number of containers in this point point point represents the location of a container
Table 4.3: Description of each field of waste containers dataset.
Figure 4.21: This is the web form where we can add a new field in the dataset.
4.5. CASE STUDIES 45
46 CHAPTER 4. OPEN DATA DEVELOPMENT
Step 2: Consuming the waste containers dataset
Figure 4.23: This is the documentation of waste containers dataset.
Now that we have the dataset ready, we create an app for ios but first we have to consult the documentation for information dataset. We want to consume this information in our mobile application. Figure 4.23 and Figure 4.24 show the documentation. The mobile app requires only two requests:
• Get containers /api/WasteContainer
4.5. CASE STUDIES 47
Figure 4.24: This is the fields of waste containers dataset.
For simplicity, the test program was developed in iOS for iPhone. The source code is available in this link:
https://github.com/agescura/UJIWasteContainers
48 CHAPTER 4. OPEN DATA DEVELOPMENT
Chapter 5
Open Data Feedback
The feedback has helped us to detect errors. In our case the feedback was focused on a developer who uses our datasets. The classmates did the feedback of the open data.
5.1 Test
We are going to develope an mobile app that shows the Almassora’s drugstores information. To do this project we need an dataset of drugstore from our Open Data with specific information of each drugstore as shown in Figure5.1and Figure
5.2.
The functions we designed to build the applications are as follows:
• To get drugstore name list.
• To get each drugstore information.
• To get the nearest drugstore.
5.1.1 To get drugstore name list
To get the drugstore list we can use the next request:
http ://< servername >/api / drugstoresAlmassora /
50 CHAPTER 5. OPEN DATA FEEDBACK
Figure 5.1: This is the documentation view of the drugstore dataset.
1. Access the documentation and access to open data dataset drugstore.
2. Study the attributes of this dataset.
Exercise: Do you like dataset documentation?
5.1.2 To get each drugstore information
Exercise: Make a request to return only one drugstore.
5.1.3 To get the drugstores are within a certain distance
of our location
5.2. RESULTS 51
Figure 5.2: This is the documentation view of the drugstore dataset.
2. How you can make special requests.
Exercise: Use /nearest to get the nearest drugstore.
5.2 Results
The following are the most relevant of the comments.
• The documentation is clear, but they needed a tutorial with some example of use of dataset.
52 CHAPTER 5. OPEN DATA FEEDBACK
test the queries.
Chapter 6
Conclusions and Future Work
6.1 Conclusions
This work has been divided into two distinct parts. Firstly, we performed an analysis of the principles of Open Data and GIS components applied to Open Data Infrastructure. Followed have made a comparison with different Open Data Infrastructure that are running today. Secondly, we have developed a proposal for Open Data Infrastructure in Universitat Jaume I based on the above analysis and adding more functionality as the different components GIS.
The following are the improvements we have made:
• The information of each dataset is displayed both in a table and on a map if it contains spatial data. The structure of each dataset is also shown in the documentation.
• It can handle information for each dataset, such as creating a new dataset, edit its content and add new fields. In addition, we can import information from an external repository.
• You can use spatial data in datasets, points or polygons. We can display information on a map, and through, the REST API, we can perform spatial queries, as obtained, for example, the central point or the envelope of all points.
We have considered three GIS components:
54 CHAPTER 6. CONCLUSIONS AND FUTURE WORK
• To manage spatial data. The management of geographic information using the format GeoJSON. Thanks to this format we can edit the geographic information.
• To display spatial data. Leaflet.js using a map we were able to visualize the geographic information.
• To process spatial Analysis. Using Turf.js have been able to make a spatial analysis inserted in our REST API Open Data Infrastructure.
Finally, what contributions can have our proposal?
We have seen two case studies, departments and waste containers, two possible examples of how it can serve our proposal.
In the case of departments in section 4.5.1, we have imported information on the current UJI Open Data. We added a polygon field and then we edited each of the values for a polygon that emulates an apartment. The result is a spatial dataset with the information they had each department and the polygon that have added. This information can now be used through our API or it can be exported in CSV format or JSON.
In the case of waste containers in section 4.5.2, we have created a dataset with a point field and have added a few values. The result is a spatial dataset with a series of points. With the API running, we have created a mobile application that consume this data. Thus, with this example, we have seen what would be the life cycle of an Open Data Infrastructure.
6.2 Future Work
As future work we have estimated the following points
• To add more data types like a circle, a color, or other types.
• If we deploy the Open Data Infrastructure in Universitat Jaume I, we need to know what kind of metadata we need.
6.2. FUTURE WORK 55
datasets even a row of a dataset. There may be responsible for the dataset for drugstores and each drugstore could manage their own information. This technique is called ACL. An access control list (ACL) is a list of permissions attached to an object. An ACL specifies which users or system processes are granted access to dataset information. [ACL, 2016].
Figure 6.1: Open Data Login Example
• We need to add the recommendations of the feedback in section 5.2.
• In section 4.2 we decided some restricts. The system only allowed one file type in a single dataset and it only allows in a dataset a unique type of geographic data, ie a single point, line or polygon. We should eliminate these restrictions.
• Often the best way to improve an application is to keep usage statistics. We need to implement a statistics page.
56 CHAPTER 6. CONCLUSIONS AND FUTURE WORK
each polygon. The process divides the intersections between polygons and add each attribute. Something like Figure 6.2
Bibliography
[Oscar Cortés, 2013] Oscar Cortés Abad, Citizenship and public policy: The chal-lenge of Open Government, Revista DO Direito Unisc, Santa Cruz Do Sul Nº39, 2013, p. 67-69.
[S. Martí i Puig, 2011] Salvador Martí i Puig, The Indignados: new Spanish Social Movement against the crisis, The Ocuppy Handbook. NY: Back Day Bokss, 2011. p. 209-217.
[Manuel Villoria et al., 2012] Manuel Villoria, Gregg G. Van Ryzin, Cecilia F.Lavena, Social and Political Consequences of Administrative Corruption: A Study of Public Perceptions in Spain, Public Administration Review, Vol 73, Iss 1, 2012. p 85-94.
[AIMC, 2015] Asociación para la investigación de medios de comunicación, El móvil es el principal dispositivo de conexión a internet para 9 de cada 10 internautas, estudio realizado al consumo de internet en movilidad. [updated september 15, 2015; cited february 17, 2016]. Recovered from http://www.aimc.es/El-movil-es-el-principal.html
[Domingo et al., 2010] A Social and Creative Revolution. Web 2.0, Carlos Domingo, Jaime González y Oriol Lloret, Telos: Cuadernos de comunicación e innovación, No. 74, 2008, pp. 134-141.
[Rubio, 2014] Gobierno abierto: más allá de los principios, Rafael Ru-bio Núñez, Nueva Revista número 145, November 2013. Recov-ered from http://www.nuevarevista.net/articulos/gobierno-abierto-mas-alla-de-los-principios
58 BIBLIOGRAPHY
[Lathrop, Ruma, 2010] Daniel Lathrop, Laurel Ruma, eds. Open Government: Collaboration, Transparency, and Participation in Practice, O’Reilly Media, Inc. 2010.
[EC, 2011] The European Commission. Open data An engine for innovation, growth and transparent governance. Brussels, December 12, 2011 http://eur-lex.europa.eu/LexUriServ/LexUriServ.do?uri=COM:2011:0882:FIN:EN:PDF
[Wikipedia, 2016] Open Data, Wikipedia. 2016 [cited february 17, 2016] Recovered from https://en.wikipedia.org/wiki/Open_data
[Suarez, 2012] Juan Antonio Suárez López, José Miguel Lorente Garcia, Integración de las infraestructuras de datos espaciales en la publicación de datos gubernamentales, Instituto Ge-ográfico Nacional. [cited february 17, 2016]. Recovered from http://www.ign.es/resources/jiide2012/poster/2.integracionide.pdf
[Patrice McDermott, 2010] Patrice McDermott, Building open government, Gov-ernment Information Quarterly 27 (2010): 407-408; Jon Gant and Nicol Turner-Lee, Government Transparency: Six Strategies for More Open and Participatory Government, Washington, D.C.: The Aspen Institute and James L. Knight Foundation, 2011, 16.
[Borglund, 2014] Erik Borglund, Tove Engvall. Open Data? Data, information, document or record? Records Management Journal, Vol. 24, No. 2, 2014. pp 163-180.
[SunlightFoundation, 2010] Ten principles for Opening Up Government Informa-tion [www.sunlightfoundaInforma-tion.com]
[Garcia, 2014] Jesús García García. Open Government: Transparency, Participa-tion and CollaboraParticipa-tion in Public AdministraParticipa-tion. Revista Innovar Journal, vol 24, núm. 54, October 2014, pp 75-88.
[Open Knowledge, 2014] Open Data Handbook [http://opendatahandbook.org/guide/en/]. [updated october, 2014; cited january 4, 2016]. Recovered from
BIBLIOGRAPHY 59
[Olaya, 2011] Víctor Olaya, Sistemas de Información Geográfica. Open Source Geospatial. Recovered from
[geojson.org, 2008] The GeoJSON Format Specification [http://geojson.org/]. [updated 2008; cited january 6, 2016]. Recovered from http://geojson.org/geojson-spec.html
[json.org, 2008] JavaScript Object Notation [http://json.org/]. [updated 2008; cited january 6, 2016]. Recovered from http://www.json.org/
[Newman et al., 2010] Greg Newman , Don Zimmerman , Alycia Crall , Melinda Laituri , Jim Graham & Linda Stapel, User-friendly web mapping: lessons from a citizen science website. International Journal of Greographical Infor-mation Science, 24:12, 2010 1851-1869.
[Wikipedia, 2016] Geoportal, Wikipedia. 2016 [cited february 17, 2016] Recovered from https://en.wikipedia.org/wiki/Geoportal
[Linkedgeodata.org, 2016] Linkedgeodata. 2016 [cited february 17, 2016] Recov-ered from http://linkedgeodata.org/
[esri, 2015] GIS and Open Data, better understanding our world. 2015.
[den Broek et al., 2013] Walking the extra byte: A lifecycle model for linked open data, Tijs van den Broek, Anne Fleur van Veenstra, Erwin Folmer. Pilot linked open data Nederland. Deel 2 De verdieping, pp. 94-110, 2013.
[Zuiderwijk et al., 2012] The potential of metadata for linked open data and its value for users and publishers, Anneke Zuiderwijk, Keith Jeffery, Marijn Janssen. JeDEM 4(2): 222-244, 2012.
[Techtarget, 2015] Guide to SOA and the cloud [cited january 25<, 2016]. Recov-ered from http://searchsoa.techtarget.com/definition/REST
[Iscar, 2015] Node.js Do’s and Don’ts, trabajo fin de grado. Universitat Politècnica de València, Escola Tècnica Superior d’Enginyeria Informàtica. 2015.