Determinants Of Firm Terminal Value: The
Perspective Of North American And
European Financial Analysts
Pedro M. Nogueira Reis, Grupo Visabeira, SGPS, SA, PortugalMário Gomes Augusto, University of Coimbra, Portugal
ABSTRACT
Company valuation models attempt to estimate the value of a company in two stages: (1) comprising of a period of explicit analysis and (2) based on unlimited production period of cash flows obtained through a mathematical approach of perpetuity, which is the terminal value. In general, these models, whether they belong to the Dividend Discount Model (DDM), the Discount Cash Flow (DCF), or RIM (Residual Income Models) group, discount one attribute (dividends, free cash flow, or results) to a given discount rate. This discount rate, obtained in most cases by the CAPM (Capital asset pricing model) or APT (Arbitrage pricing theory) allows including in the analysis the cost of invested capital based on the risk taking of the attributes. However, one cannot ignore that the second stage of valuation that is usually 53-80% of the company value (Berkman et al., 1998) and is loaded with uncertainties. In this context, particular attention is needed to estimate the value of this portion of the company, under penalty of the assessment producing a high level of error. Mindful of this concern, this study sought to collect the perception of European and North American financial analysts on the key features of the company that they believe contribute most to its value. For this feat, we used a survey with closed answers. From the analysis of 123 valid responses using factor analysis, the authors conclude that there is great importance attached (1) to the life expectancy of the company, (2) to liquidity and operating performance, (3) to innovation and ability to allocate resources to R&D, and (4) to management capacity and capital structure, in determining the value of a company or business in long term. These results contribute to our belief that we can formulate a model for valuating companies and businesses where the results to be obtained in the evaluations are as close as possible to those found in the stock market.
Keywords: Firm Value; Determinants of Terminal Value; Cash Flow; Life Expectancy
1. INTRODUCTION
ne of the problems in business valuation models, widely used by the academic and financial community, is related to the calculation of continuing value of (VC) , also called terminal value (VT) or residual (VR). This component is present in the main business valuation models - examples of which are the models based on discounted cash flows and dividends (Dividend Discount Model, DDM, and Discounted Cash Flow, DFC) as also based on the results (Residual Income Models, RIM). In this last group we can find the Market Value Added (MVA) or Refined Economic value added (REVA). That above mentioned component usually represents a large portion of the assessed value of the firm (Copeland et al., 2000; Buus, 2007). Berkman et al. (1998) concluded that the weight of the terminal value of the company in its overall valuation ranged between 53 and 80%, thus assuming a high importance in the final evaluation of the securities.
According to the traditional models of assessment, estimating the value of a company or business is usually divided into two stages: i) prediction of dividends, or cash flows over a definite period (short period of great predictability), usually 5 to 7 years where the predictions are more easily achievable, and the volatility is not too
O
significant factor and ii) the prediction of a residual or terminal value, something loaded with great unpredictability with regards to its estimate either using mathematical modeling of constant or growth perpetuity of a particular attribute. For illustrative purposes only, if we consider a constant perpetuity of a flow of 100 monetary unit (m.u.); for example, a discount rate of 10%, the present value of these flows, would be 1000 m.u. After 20 years, the discounted value of that annuity is 851 m.u., after 40 years is 978 m.u. and after 50, 991 m.u. Therefore, the current financial modeling does not take into account the life expectancy of the company. In the example shown only after 50 years the residual value of the company would be 99.1% of perpetuity.
Reis and Augusto (2013a), using a database of Coface Mope with about 242,661 records on bankruptcy, dissolution, and cease of activity occurring in Portugal from 1900 until April 2012, through the date of incorporation and the record date of dissolution or insolvency, we managed to set a mortality table. According to the authors, 30% of companies “die” in their first 5 years. Their average life expectancy at birth is 12.3 years, with a standard deviation of 11 years reaching a maximum of 169 years. Most companies survive up to 14 years (70% of cumulative frequency). These results highlight the fragility of valuation models based on the estimation of RV taking into account a perpetuity or a multiple of the results.
In our view, the scientific and financial community has come to accommodate these and other variables in the models for the evaluation of companies in a less appropriate way. In this sense, Shaked and Kempainen (2009) argue that the valuation methods applied by financial advisers vary and generate some controversy as to its application. However, Petersen and Plenborg (2009) concluded that the assessments undertaken by the investment banking community would have many errors in the calculation of VT and the growth rate implied. In the same sense, Martins (2011) presents a case study which concludes that any changes, no matter how insignificant, to the rate of growth of the residual value, can significantly influence the value of the company. Buus (2007) argues that errors in setting the duration of competitive advantage, a feature of the definite period, not shown in the models through an appropriate length of that period, lead to transmit to the second stage errors from that first assessment. Roosenboom (2012 ) confirms that the assessment tools most commonly used by institutional investors prior to an IPO are multiples of performance, DCF and DDM, all experiencing a positive bias analysis in relation to the market equilibrium price. Underwriters use that price (outcome evaluation) with an intentional discount in order to establish the preliminary offer price. Imam et al. (2013) confirm that the valuation techniques mostly used by analysts are multiples, such as the price earnings ratio and enterprise value vs ebitda and DCF at cash flow level. However, they empirically document that RIM models, which use the book value and ROE (return on equity), present better results when compared to the models used by analysts. Thus, they conclude that the book value of equity is a fairly reliable measure of firm value. This finding, while contrary to previous studies such as, for example, Demirakos et al. (2004) and Imam et al. (2008), reaffirms the importance of RIM models. However, it is nonetheless worth noting that there are many disparities in the results of studies which have examined the methods of business valuation as well as substantial differences between evaluations and the stock markets.
Buckley (2003) by studying the difference between the fundamental value of the company and its market value, concludes that when the fundamental value differs from market value and this information is held by the directors/administrators (managers), situations of arbitration are generated that can go through share buybacks or increased capital to capture this difference. When this information is held by other stakeholders, competitors, for example, may lead to mergers and hostile takeovers. The power of valuation and its reliability allows us to dilute the difference between the fundamental value (calculated by discounting the future cash flows) and the market value. The quality and timeliness of financial information provided by companies reduce errors in business assessment, marks Jiao (2011).
Indeed, the evaluation models (DDM, RIM, and DCF), by considering few attributes of the company for formulation, leave into the risk premium, considered in calculating the cost of equity, the aggregation, and residual concentration of the whole risk (e.g., risk of the economy, risk associated with inaccurate information or lack thereof, liquidity risk, risks associated with reasons of “force majeur,” and risk associated with possible irrational behavior by investors), not directly assessed or observed in the economy and that influences the valuation of a company (Damodaran, 2009).
Moreover, one cannot ignore that in the assessment models for traditional companies the residual value of the company represents a significant portion of its value. According to estimates by Berkman et al. (1998), this varies between 53 and 80% of the company. Thus, we need to pay particular attention in the estimation of this portion, lest the valuation of the company will have a high level of error. In being mindful of this concern, this study seeks to collect the perception of European and North American analysts on the key attributes of the company which are believed to contribute most to its value.
Aside from the introduction, this paper comprises of four sections. Section 2 is devoted to the literature review. In Section 3 our attention turns to the study methodology, process of data collection and sample. In Section 4, we present and discuss the results obtained. Finally, in Section 5, we summarize the main conclusions.
2. LITERATURE REVIEW
The vast majority of models for evaluating companies or businesses assume that they produce flows for an unlimited period; i.e., have an unlimited life, considered in the mathematical modeling of constant or growth perpetuity of the various attributes associated with the various models. Levin and Olsson (2000) argue that after the forecast horizon, the company has a stable development for the free cash flows, dividends or residual income, also highlighting how the violation of the principle that stability implies errors in estimates of value of companies. In the same vein, Damodaran (2002) using the H model (created by Fuller & Hsia, 1984) divides the VT in two stages: the first, of extraordinary growth, where the growth rate decreases linearly to stability and, second, stabilized growth, applying here the traditional expression of the Gordon (1959) model. For Fernandez (2005) VT is calculated using a perpetuity (which may be no growth), where investment corresponds to the replacement of depreciation and amortization to maintain the assets at a level that can sustain constant cash flows. Jennergren (2008) argues that the application of VT derives from Gordon's (1959) model with a simple extrapolation of the FCF at the end of the explicit forecast period. To estimate the VT, Koller et al. (2010) use the term value driver formula (VDF) expanded, another form of perpetuity. In this formulation, the simple VDF (without perpetuity growth) corresponds to NOPLAT/WACC (operating result adjusted for tax discounted at weighted average cost of capital); i.e., a perpetuity without growth. Following the same line of thought, Berkman et al. (1998) argue that the calculation of the terminal value of FCF and its growth rate at infinity must be calculated simultaneously, since both depend on the retention rate at the beginning of FCF terminal year. Tuller (2008) argues that only in the case of capital-intensive companies, diversified in terms of product, quality managers and a strong market presence, theoretically produce cash flows lasting longer, making VT, in these cases, the only relevant component.
Morris (2009) was the first author to incorporate the probability of bankruptcy in models in order to decrease that value into the calculation of company VT. The probability of bankruptcy or the disappearance of a company justifies the deduction of an evaluation model that does not start from a premise of generation capacity for infinite flows. In the same sense, Reis and Augusto (2013a) built a mortality table for Portuguese companies reaching a formula for calculating the probability of life for each year of the company thereby contributing to an improvement and reduction of asymmetries of current valuation models. Jennergren (2013) also tries to incorporate the uncertainty assessment models by considering the risk of bankruptcy both in the sales growth rate and in the weighted average cost of capital (WACC) leveraged, but with a continuing period of stable growth associated with the terminal value. The author acknowledges the weakness of the use of an identical probability of bankruptcy for each year as Morris (2009) in its analysis. Also, the constant conflict between the values of valuation models and fair value along the formats in which they are performed, indicated by Shaked and Kempainen (2009) and Petersen and Plenborg (2009), justifying the search for other determinants which, when incorporated into traditional models of assessment will allow for a more efficient measurement of the value of a company or business.
The techniques of DCF, despite its long existence suffer a number of limitations associated with their use. The major constraints related to these models based on perpetual cash flows relate to the measurement of the length of life of the company, in calculating the discount rate to be used during this period, the definition of the flow to perpetuate, in the calculation of the growth rate of the flow to be perpetuated and also the fact that these techniques do not consider that the management capabilities can change the future cash flows with their decisions (Ikromov & Yavas, 2012).
The models shown include in discount rate of the attributes, whether results, dividends, or flows through the risk premium, a wide range of variables that potentially influence the market price. The cost of equity component of the capital cost is obtained by adding a risk premium, usually associated with the risk of a share in relation to the market study, to the return of a riskless asset. This risk premium is often obtained (although it must be based on provisional data) through a historical analysis of the difference between shareholder returns and market sovereign bonds (as a proxy of the risk-free asset). In emerging markets, this information is sparse and volatile, thus not allowing for a good measurement of this indicator. This risk premium is the additional amount that the investor requires to cover the market risk over the risk-free asset. This component has been a key part in all types of business valuation and assessment of shares by discounting the attributes considered in these models. However, this contains a set of variables related to systematic risk or other key features which are not separately treated in the models as main attributes; i.e., not autonomous in the models. In this respect Elsner and Krumholz (2013) point out deficiencies to the discount rate used in the models using the perpetuity of Gordon for the terminal value in the evaluation of companies. This rate of discount, if not properly calibrated, can produce considerable distortions and biases in the ratings.
As we study the determinants of the valuation of a company or a business, it is important to consider as a proxy of that value, the stock market value; i.e., evaluation that the market makes at every moment. Obviously, this proxy presents limitations. First, we cannot ignore that the market value is influenced by information asymmetries between the agents that set the price through supply and demand, but also because the value of the market price may not reflect a majority or minority, transactions through discounts and premiums that should be implicit, or because, in the case of the sale of a company (or only a portion thereof) not listed, references to value a comparable company in the stock market cannot reflect adequately the amount of such alienation. However, despite these limitations, the reference stock market is still the best proxy in the absence of any other as documented by Flannery and Protopapadakis (2002) and Sunde and Sanderson (2009), among others. With this premise, it is important to realize what factors determine or can determine the value of a company as measured by its market capitalization.
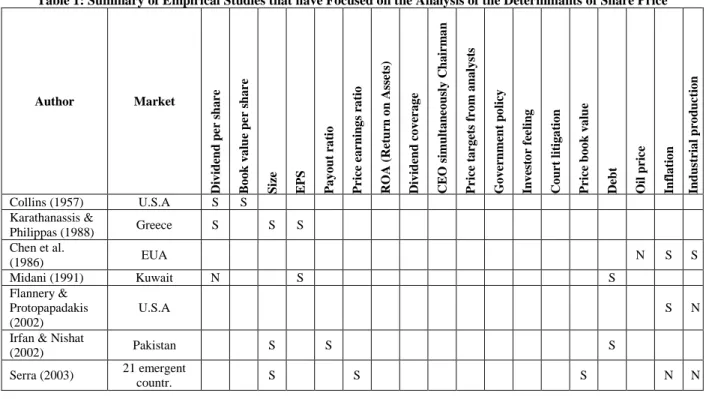
Table 1 is a summary of the empirical studies that have focused on the analysis of the determinants of the price of the shares. As can be concluded from the analysis of this table, earnings per share, dividends per share, book value per share, and price earnings ratio are shown as attributes of the company that have garnered most empirical support as determinants of the price of its shares.
Table 1: Summary of Empirical Studies that have Focused on the Analysis of the Determinants of Share Price
Author Market D iv id en d p e r sh a re B o o k v a lu e p er s h a re S iz e EPS Pa y o u t ra ti o P ri ce e a r n in g s ra ti o R O A ( R et u rn o n A ss et s) D iv id en d c o v er a g e C E O s imu lt a n eo u sl y C h a ir m a n P ri ce t a rg et s fr o m a n a ly st s G o v er n me n t p o li cy In v es to r f ee li n g C o u rt l it ig a ti o n P ri ce b o o k v a lu e D eb t O il p ri c e In fl a ti o n In d u st ri a l p ro d u c ti o n Collins (1957) U.S.A S S Karathanassis & Philippas (1988) Greece S S S Chen et al. (1986) EUA N S S Midani (1991) Kuwait N S S Flannery & Protopapadakis (2002) U.S.A S N
Irfan & Nishat
(2002) Pakistan S S S Serra (2003) 21 emergent
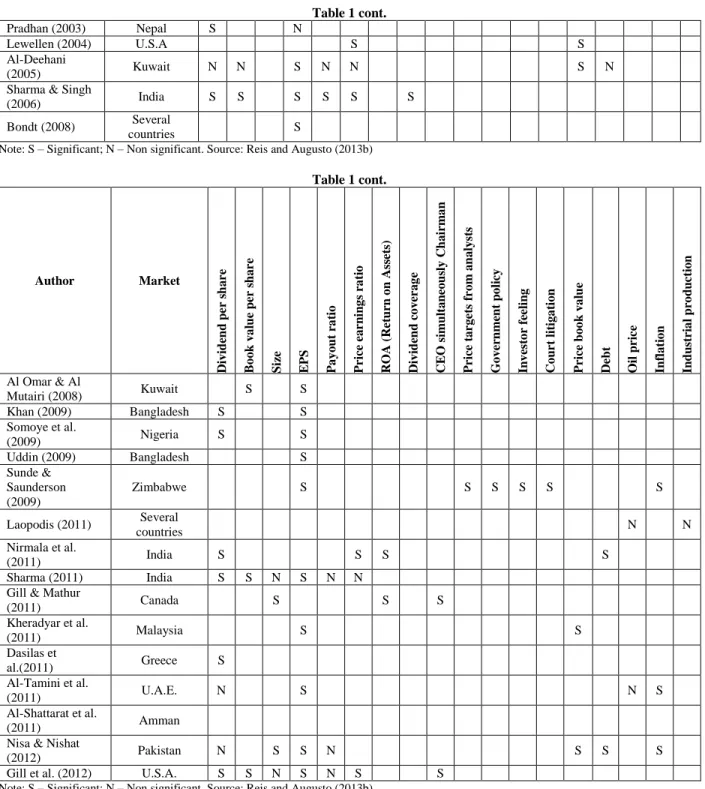
Table 1 cont.
Pradhan (2003) Nepal S N
Lewellen (2004) U.S.A S S Al-Deehani
(2005) Kuwait N N S N N S N Sharma & Singh
(2006) India S S S S S S Bondt (2008) Several
countries S
Note: S – Significant; N – Non significant. Source: Reis and Augusto (2013b)
Table 1 cont. Author Market D iv id en d p er s h a re B o o k v a lu e p er s h a re S iz e EPS Pa y o u t ra ti o P ri ce e a r n in g s ra ti o R O A ( R et u rn o n A ss et s) D iv id en d c o v er a g e C E O s imu lt a n eo u sl y C h a ir m a n P ri ce t a r g et s fr o m a n a ly st s G o v er n me n t p o li cy In v es to r f ee li n g C o u rt l it ig a ti o n P ri ce b o o k v a lu e D eb t O il p ri ce In fl a ti o n In d u st ri a l p ro d u ct io n Al Omar & Al Mutairi (2008) Kuwait S S Khan (2009) Bangladesh S S Somoye et al. (2009) Nigeria S S Uddin (2009) Bangladesh S Sunde & Saunderson (2009) Zimbabwe S S S S S S Laopodis (2011) Several countries N N Nirmala et al. (2011) India S S S S Sharma (2011) India S S N S N N
Gill & Mathur
(2011) Canada S S S Kheradyar et al. (2011) Malaysia S S Dasilas et al.(2011) Greece S Al-Tamini et al. (2011) U.A.E. N S N S Al-Shattarat et al. (2011) Amman Nisa & Nishat
(2012) Pakistan N S S N S S S Gill et al. (2012) U.S.A. S S N S N S S
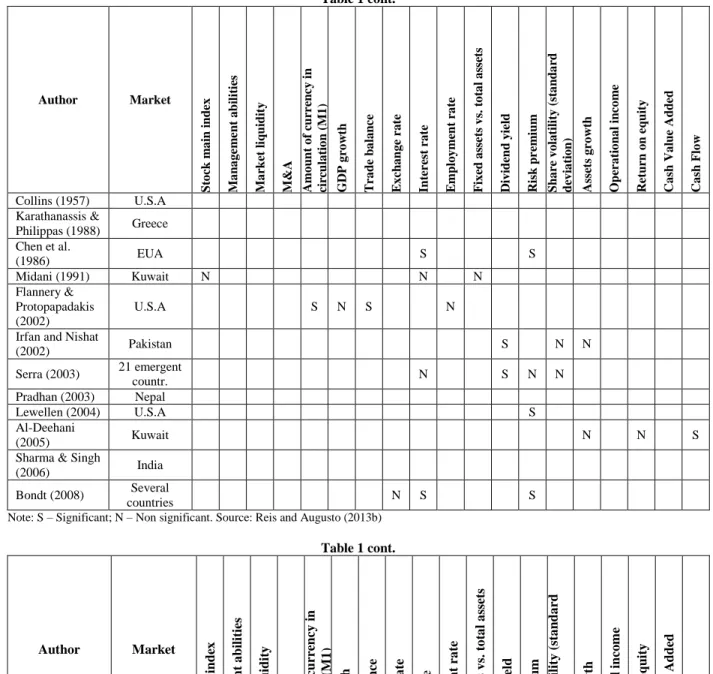
Table 1 cont. Author Market S to ck m a in i n d ex Ma n a g em en t a b il it ie s Ma rk et l iq u id it y M&A Amo u n t o f cu rr en cy i n ci rc u la ti o n ( M 1 ) G D P g ro w th T ra d e b a la n ce E x ch a n g e ra te In te re st r a te E mp lo y me n t ra te F ix ed a ss et s v s. t o ta l a ss et s D iv id en d y ie ld R is k p re m iu m S h a re v o la ti li ty ( st a n d a rd d ev ia ti o n ) A ss et s g ro w th O p er a ti o n a l in co m e R et u rn o n e q u it y C a sh V a lu e A d d ed C a sh F lo w Collins (1957) U.S.A Karathanassis & Philippas (1988) Greece Chen et al. (1986) EUA S S Midani (1991) Kuwait N N N Flannery & Protopapadakis (2002) U.S.A S N S N Irfan and Nishat
(2002) Pakistan S N N Serra (2003) 21 emergent countr. N S N N Pradhan (2003) Nepal Lewellen (2004) U.S.A S Al-Deehani (2005) Kuwait N N S
Sharma & Singh
(2006) India Bondt (2008) Several
countries N S S Note: S – Significant; N – Non significant. Source: Reis and Augusto (2013b)
Table 1 cont. Author Market S to ck m a in in d ex Ma n a g em en t a b ili ties Ma rk et li q u id it y M& A Am o u n t o f cu rr en cy i n circ u la tio n ( M1 ) G DP g ro wth Tr a d e b a la n ce Ex ch a n g e ra te Inter est r a te Em p lo y m en t ra te Fi x ed a ss ets v s. to ta l a ss ets Div id en d y ield Risk p re m iu m S h a re v o la til ity (sta n d a rd d ev ia ti o n ) As se ts g ro wth O p er a tio n a l in co m e Re tu rn o n e q u ity Ca sh Va lu e A d d ed Ca sh Fl o w Al Omar & Al Mutairi (2008) Kuwait Khan (2009) Bangladesh Somoye et al. (2009) Nigeria S S S Uddin (2009) Bangladesh Sunde & Saunderson (2009) Zimbabwe S S S S Laopodis (2011) Several countries N
Table 1 cont. Nirmala et al.
(2011) India
Sharma (2011) India N
Gill & Mathur
(2011) Canada. S Kheradyar et al. (2011) Malaysia S Dasilas et al.(2011) Greece Al-Tamini et al. (2011) U.A.E. S S S Al-Shattarat et al. (2011) Amman S S S
Nisa & Nishat
(2012) Pakistan S S
Gill et al.
(2012) U.S.A.
Note: S – Significant; N – Non significant. Source: Reis and Augusto (2013b)
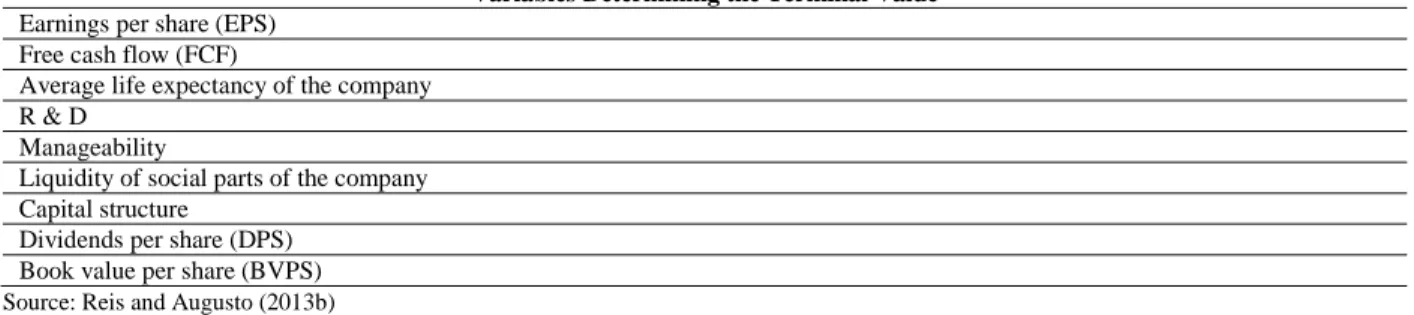
More recently, using a sample of 714 listed companies, belonging to 15 European countries, and for a period between 1992 and 2011, Reis and Augusto (2013b) show that the continuing value cannot be regarded as the present value of a constant or growth perpetuity of a particular attribute of the company, but according to a set of attributes such as free cash flow, net income, the average life expectancy of the company, the investment in R&D, skills and quality of management, liquidity of the securities, the financing structure and dividends, as Table 2 summarizes.
Table 2: Systematization of the Most Important Variables in Determining the Terminal Value or Long-Term Variables Determining the Terminal Value
Earnings per share (EPS) Free cash flow (FCF)
Average life expectancy of the company R & D
Manageability
Liquidity of social parts of the company Capital structure
Dividends per share (DPS) Book value per share (BVPS) Source: Reis and Augusto (2013b)
3. METHODOLOGY
3.1 Sample
Given the objectives of our study, the target populations focused upon were business valuation experts and companies, such as financial analysts, investor relations, financial directors, executives in investment banking, and investment departments established in North American and European markets. The scope of these two global markets which account for most of the world's stock market capitalization alongside the most dynamic places of stock transactions allows for a greater uptake of trends and perceptions of experts and professionals in this industry to provide for a more efficient analysis.
Given that the target population is vast and to ensure that an adequate selection of respondents meet the purposes of this study, four preceding questions were posed, namely:
Have you ever performed a company valuation?
Are you a CPA, financial analyst, CFO, relations investor, investment banker, or anything related with these jobs?
Are you aware of financial equilibrium horseshoe monitoring?
The answer to these four questions to potential respondents resulted in their inclusion or exclusion in our ultimate target population. Those who answered yes to the first three questions and negatively in the last were selected. Whoever responded differently would be excluded. Obviously the last question makes no sense for specialists and whoever answered in the affirmative, would be eliminated because it would mean that they accept the existence of a non-existent and invalid concept for experts.
In light of that selection, qualified respondents who answered the survey were 123, who were broken down as follows: 69 belonging to the North American market and 54 to the European market.
3.2 Research Instrument
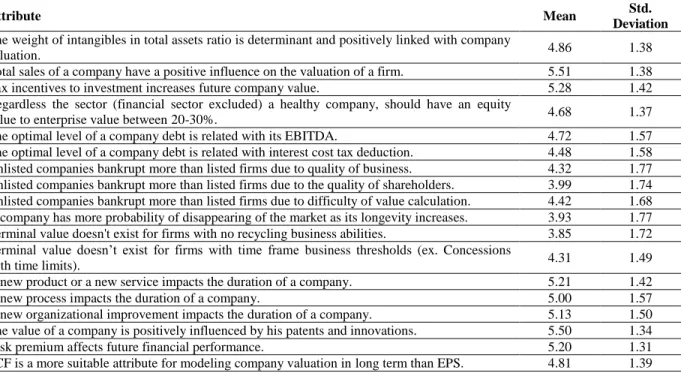
The collection of data for the empirical analysis was conducted through a questionnaire. The questionnaire was built on a platform on the internet - QuestionPro, which allows for greater flexibility both in information processing and the collection of statistics from responses, either through agility provided to the respondent by providing an intuitive and simple access to the site by insertion of multiple choice answers. The survey included a set of questions that aimed to measure the attributes of companies which have a potential impact on its value. Table 3 shows an overview of these questions as well as the mean and standard deviation obtained in the sample. In addition to the attributes tested, the survey questions also allow for further additional findings on the perception of respondents about the behaviors, trends and characteristics of firms which allows us to characterize more effectively the terminal or continuity of firms. The questionnaire used a Likert scale with 7 levels (1 = complete disagreement, ..., 7 = strongly agree ) similar to methodology used by Motwani (2013). This author used 22 variables to measure three attributes, with the aim of analyzing the factors which determine the investment of infrequent and small scale investors. Also Wua and Shen (2013) to assess social responsibility in the banking industry used a Likert scale of 5 levels. In the same vein Moro and Matthias (2013) used a Likert scale with 5 levels to measure the confidence of lenders and access to credit by SME´s. Whereas Hoffmann et al. (2013) used 7 levels between "totally agree to totally disagree" to gauge individual investor behavior during the crisis.
Table 3: Variables Used and Respective Descriptive Statistics
Attribute Mean Std.
Deviation The weight of intangibles in total assets ratio is determinant and positively linked with company
valuation. 4.86 1.38
Total sales of a company have a positive influence on the valuation of a firm. 5.51 1.38
Tax incentives to investment increases future company value. 5.28 1.42
Regardless the sector (financial sector excluded) a healthy company, should have an equity
value to enterprise value between 20-30%. 4.68 1.37
The optimal level of a company debt is related with its EBITDA. 4.72 1.57
The optimal level of a company debt is related with interest cost tax deduction. 4.48 1.58
Unlisted companies bankrupt more than listed firms due to quality of business. 4.32 1.77
Unlisted companies bankrupt more than listed firms due to the quality of shareholders. 3.99 1.74 Unlisted companies bankrupt more than listed firms due to difficulty of value calculation. 4.42 1.68 A company has more probability of disappearing of the market as its longevity increases. 3.93 1.77
Terminal value doesn't exist for firms with no recycling business abilities. 3.85 1.72
Terminal value doesn’t exist for firms with time frame business thresholds (ex. Concessions
with time limits). 4.31 1.49
A new product or a new service impacts the duration of a company. 5.21 1.42
A new process impacts the duration of a company. 5.00 1.57
A new organizational improvement impacts the duration of a company. 5.13 1.50
The value of a company is positively influenced by his patents and innovations. 5.50 1.34
Risk premium affects future financial performance. 5.20 1.31
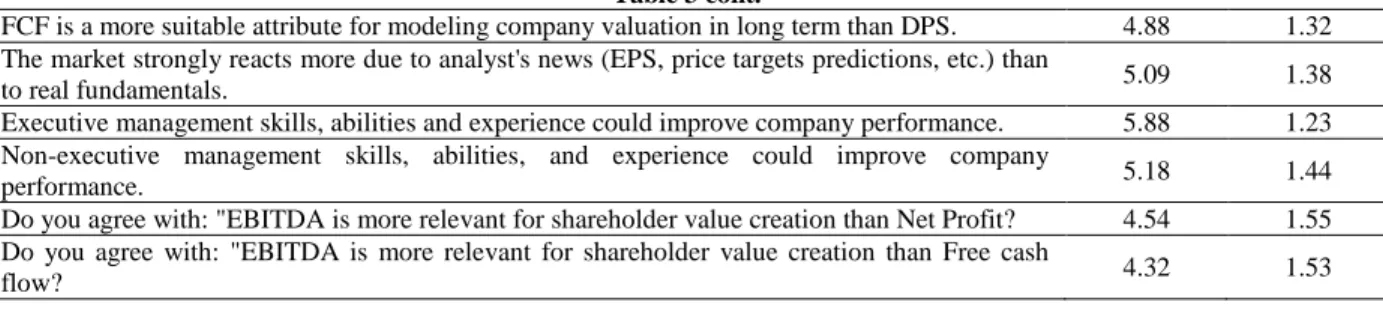
Table 3 cont.
FCF is a more suitable attribute for modeling company valuation in long term than DPS. 4.88 1.32 The market strongly reacts more due to analyst's news (EPS, price targets predictions, etc.) than
to real fundamentals. 5.09 1.38
Executive management skills, abilities and experience could improve company performance. 5.88 1.23 Non-executive management skills, abilities, and experience could improve company
performance. 5.18 1.44
Do you agree with: "EBITDA is more relevant for shareholder value creation than Net Profit? 4.54 1.55 Do you agree with: "EBITDA is more relevant for shareholder value creation than Free cash
flow? 4.32 1.53
4. RESULTS
In order to identify the starting point for our data structure, allowing for its summary and data reduction, we resorted to factorial analysis. However, first it was necessary to test its suitability.
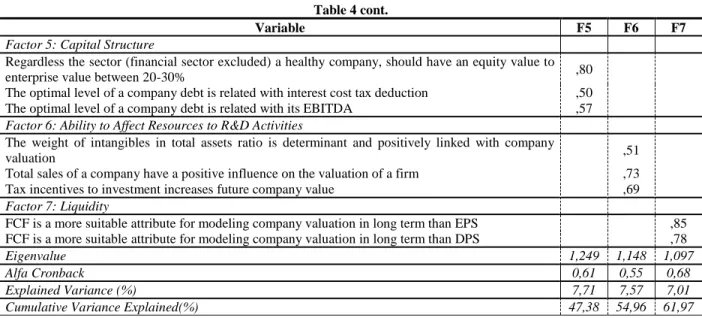
The Kaiser - Meyer - Olkin test was performed, and sample adequacy for all variables was analyzed. An overall value of 0.75 was obtained for the sample adequacy test. This value, reached the value considered acceptable in literature for this type of analysis (Hair et al., 1998). Bartlett’s sphericity significance test was also used, which led us to reject the null hypothesis; i.e., the correlation matrix used deviates from the identity matrix. In view of these results, we continued the analysis of extraction of factors. Then, the principal component method with varimax rotation was used to extract relevant factors. Based upon this analysis, 7 factors were identified with eigenvalues greater than one. These 7 factors explained 61.97% of the total variance. All factors loading greater than or equal to 0.5 are reported. The Cronbach’s alpha for each factor ranges from 0,55 for ‘ability to affect resources to R&D activities’ to 0.77 for ‘expectancy firm life and maturity’ and ‘innovation’ (see Table 4).
Table 4: Factors, Variables, and Loadings
Variable F1 F2 F3 F4
Factor 1: Expectancy Firm Life and Maturity
Unlisted companies bankrupt more than listed firms due to quality of business ,74 Unlisted companies bankrupt more than listed firms due to the quality of shareholders ,68 Unlisted companies bankrupt more than listed firms due to difficulty of value calculation ,68 A company has more probability of disappearing of the market as its longevity increases ,53 Terminal value doesn’t exist for firms with no recycling business abilities ,66 Terminal value doesn’t exist for firms with time frame business thresholds (ex. Concessions
with time limits) ,52
Factor 2: Innovation
A new product or a new service impacts the duration of a company ,63
A new process impacts the duration of a company ,68
A new organizational improvement impacts the duration of a company ,72
The value of a company is positively influenced by his patents and innovations ,57
Risk premium affects future financial performance ,70
Factor 3: Management Abilities
The market strongly reacts more due to analysts news EPS price targets predictions etc. than
to real fundamentals ,55
Executive management skills abilities and experience could improve company performance ,82 Nonexecutive management skills abilities and experience could improve company
performance ,74
Factor 4: Operacional Performance
Do you agree with EBITDA is more relevant for shareholder value creation than Net Profit ,83
Do you agree with EBITDA is more relevant for shareholder value creation than Free cash
flow ,76
Eigenvalue 5,726 2,669 1,595 1,389
Alfa Cronback 0,77 0,77 0,64 0,73
Explained Variance (%) 12,20 11,08 8,21 8,19
Table 4 cont.
Variable F5 F6 F7
Factor 5: Capital Structure
Regardless the sector (financial sector excluded) a healthy company, should have an equity value to
enterprise value between 20-30% ,80
The optimal level of a company debt is related with interest cost tax deduction ,50
The optimal level of a company debt is related with its EBITDA ,57
Factor 6: Ability to Affect Resources to R&D Activities
The weight of intangibles in total assets ratio is determinant and positively linked with company
valuation ,51
Total sales of a company have a positive influence on the valuation of a firm ,73
Tax incentives to investment increases future company value ,69
Factor 7: Liquidity
FCF is a more suitable attribute for modeling company valuation in long term than EPS ,85
FCF is a more suitable attribute for modeling company valuation in long term than DPS ,78
Eigenvalue 1,249 1,148 1,097
Alfa Cronback 0,61 0,55 0,68
Explained Variance (%) 7,71 7,57 7,01
Cumulative Variance Explained(%) 47,38 54,96 61,97
The analysis of the results, summarized in Table 4, allows us to identify seven major dimensions (attributes) which in the opinion of respondents determine the value of a business or company. In line with the results found by Reis and Augusto (2013b), based on panel data for a sample of 714 European companies, the average life expectancy and maturity of the company is assumed as a determinant of its value. The hope of future life of the company influences its value by the amount of the upcoming years which the company has forecasted to produce cash flows, results, etc. Respondent professionals reveal that greater maturity may imply a higher probability of bankruptcy. Businesses with a limited expected duration condition the perpetuity of the company because, in the opinion of the respondents, it is believed that companies that do not have the ability to reinvent their business will not survive in the future. A company's valuation is associated with the evolutionary life cycle of a product/service, where the decline phase culminates with the "death" of the firm implying therefore a finite business life. From the results obtained, respondents recognize that companies do not have an unlimited life which in turn conditions their valuation. In their opinion, the greatest factors that induce bankruptcy are the quality of the business, the quality of the shareholders and finally the difficulty related to valuation. The quality of the shareholders is linked to the monitoring carried out by this type of stakeholder. Additionally, as was expected, we conclude from the analysis that unlisted companies disappear from the market for reasons of bankruptcy more intensively than those which are listed.
In view of these results, business evaluation requires a consideration towards formulating the absence of a mathematical perpetuity in the calculation of explicit value; i.e., being out of reach of analysis means companies will have an end.
Another relevant factor in terms of the value of the company is its ability to innovate the product or service, process and organizational levels, as well as its realization in terms of new patents and consolidation of existing ones. The role of innovation in the company's valuation is also highlighted by Ferreira (2010), Forsman and Annala (2011), and Kostopoulos et al. (2011), among others. They conclude in their studies that companies with higher levels of innovation have better financial performance. In the same sense Tung (2012) emphasizes the importance of continuous product/service innovation to ensure competitiveness and thus improve performance. More recently Dadfar et al. (2013) and Augusto et al. (2014) conclude upon a positive relationship between the capability for innovation and performance, justified by the commitment and efficient management of that innovation across the entire organization. However, the results are nonetheless evidence that associated with innovation efforts, while being an inducing factor towards a valuation of the company one cannot ignore the risk premium associated with this type of investment. In fact, not all innovations can be associated with success and their investments entail a greater risk premium for the uncertainty in defining the impact of innovation in the future EBITDA of the company.
Management capabilities, as was expected, are also assumed as a foreshadowing of performance and the company valuation factor. The control effect, discipline and shareholder oversight (via non-executive director), together with the capabilities of executive managers, being encouraged by award systems, are indeed considerable for greater wealth creation. Non-executive management exercise supervisory activities thus ensuring a higher firm value although with less weight than executive management. The visibility that management has in the valuation of the company is often viewed as an intangible, goodwill, and emphasized by financial analysts in their evaluations which capture the potential of these “assets” as sometimes being more important than the core businesses. Management capacity, in line with studies by Sunde and Saunderson (2009), also presents itself as a determinant of firm value in the long run. Jian and Lee (2011) found that the market responds more favorably to the announcement of investments in the case of companies with the greatest and most reputable CEO’s showing, also in these cases, a better performance after investment than in cases of companies ran by CEO’s of a lesser reputation. Also in this regard see the recent study by Kandasamy et al. (2014) which concludes that due to the climate of uncertainty that permanently lives in the financial markets, high levels of the hormone cortisol - a major stress hormone - present in the body of the financial agents- leads them to develop a marked aversion to risk, contrary to what is expected. For the authors of this amendment, individual psychology may be an additional cause, so far ignored, for market crashes. This discovery, according to the authors, may change the concept of risk as it is currently perceived; i.e., it was expected that during marked devaluations market investors entered into the market again. This may well explain the panic effect. Managers and their management capacity are also important as they may be affected by the same stress factor.
The operational performance is in fact the quintessential inducer of growth and, consequently, the value of the company in the long run. It is, therefore, no surprise that EBITDA is one of the factors that are commonly touted more often as a determinant of firm value. Professionals favor this measure as the most important indicator of company performance (e.g., Novy-Marx, 2013; Lim & Hong 2012). Markets value the operating performance rather than net income, thus placing special emphasis on the operational capacity of a company.
The capital structure positively influences the value of the company to a financial autonomy (equity to total assets) between 20-30% relevant to corporate health. The tax shield is also a reference in establishing the debt, because it is tax efficient when compared with equity. Companies establish an optimal level of debt preferably based upon operational measure, EBITDA, demonstrating the power of creditors in control, discipline, and indirect monitoring of the company. Despite the abundant literature in this area, highlighting the pioneering work of Jensen and Meckling (1976), which argues that agency costs originated by the conflicts of interest between owners and creditors (agency costs of debt) increase with the leverage ratio which contributes to the reduction of firm value. These costs, as warns Myers (1977), have an important relevance in firms with high probability of insolvency, because in this situation the owners may even refuse to invest in value creating opportunities if it is necessary to contribute with their own fresh capital in order to do so, which drives firms into excessive debt. The results of recent research point in the same direction. As an example, referring to the work of Salim and Yadav (2012), which concludes on a negative relationship between corporate performance and short-term debt, medium-term debt, and total debt. Also Gaud et al. (2007) were able to identify a pattern for a sample of 5,000 European companies with regards to their strategies for setting a maximum borrowing threshold. They argue further that the debt overhang restricts the latitude of managers (via contractual covenants, for example) and equity can be a source of financing at lower cost when issued by exploring some windows of opportunity.
The ability to allocate resources to R&D as measured by the weight of intangibles on its assets and the tax power to deduct these expenses, which generally have a more competitive tax regime than other investments, along with the impact they have on the company's sales, we present another determinant of firm value in the long run. In this same line of thought, Cincera et al. (2010) also found the positive relationship between R&D and business performance. Also Gómez and Vargas (2012) support the same idea to conclude that the allocation of R&D increases the likelihood of the use of technology and thus favors future growth. However, O'Connor et al. (2013) conclude that managers tend to cut back on R&D in a situation of low liquidity, because the return on this investment is delayed and if the compensations are indexed to the stock returns it is likely that these expenses also suffer a reduction on behalf of the managers. The value of R&D will only be perceived in the long run. Chun et al. (2014) also consider that technological heterogeneity of companies creates the diversification effect of R&D leading to investment in this rubric and thus implying the long-term growth of the company.
Finally, analysts and professionals consider liquidity, measured by the FCF as relevant in determining the value of the company in the long run. This measure by far surpasses the results and these surpass dividends, being this order of preference by professionals and also seen as an essential attribute for liquidity. FCF serves to tackle the debt service and also to obviously cope with investment expenditure. Any excess in that rubric stimulates the growth of the company. However, Jang (2011) warns that excess liquidity may have an adverse effect on the future development of the company, as for when there is no suitable investment plan, the future of the company may be in turn ‘conditioned’. Excessive cash reserves produced by a large FCF when applied in a share buyback program can connote a lack of active investment programs, as in fact was witnessed by Lee and Suh (2011). The amount of liquidity according to Brisker et al. (2013) decreases when entering the market, as companies in this platform have access to a greater diversity and ease of access to funds, therefore not having a requirement for excessive fund reserves.
5. CONCLUSION
It was confirmed, therefore, through our analysis, the importance of a life expectancy of a company which represents its maturity, but also the conclusion that companies have a finite life and, as such, this is a major factor to be taken into account in business valuation models. By joining the conclusions from Reis and Augusto (2013b) we can say that the age of the company, its life expectancy and maturity, exert pressure on firm value. As age advances, the average life expectancy reduces, a stage of maturity is surpassed and anticipation for the period of decline or extinction should be considered in valuation models. Of course companies can submit a regeneration of its business and this may influence their assessment.
In analysis, we stress the importance of capital structure on firm value. Ghosh (2006) argues for a negative relationship between debt and the power of corporate management by the consistent effect of substitution in terms of monitoring the company. In fact, debt holders exercise a control effect of discipline and monitoring that overlaps and reduces the powers of management. Having surveillance carried out by the shareholders, reinforced if we are in the presence of an active market with a shareholder supremacy over the rest, can contribute to an increase in company value; i.e., the capital structure determines the power of either the shareholders or creditors of the company to which are added the capabilities of the executive management that keep these two stakeholders somehow aligned in their actions for management to exercise its activity without too many restrictions.
In light of the foregone exposure, the management capabilities are an extremely important factor in the long-term value of the company. No stakeholder has information as valuable as the manager/administrator. They have access at all times (with more relevance in listed public companies) to inside information regarding the gap derived from the fundamental value of the company and its market value, the perception of the future and the likelihood of the disappearance of the market. This information held by directors/administrators can even generate arbitrage situations that can undergo share buybacks or increased capital in order to capture this difference. It is thus extremely important to choose the management team and the respective capabilities for the possibility that they have to change the course of events of a company. This is then in turn an intangible asset and a substantial goodwill towards value creation of a company.
All these factors indicated above abreast of product innovation, process, or organizational as well as the company's ability to affect resources to R&D activities, create the foundation for the competitiveness and renewability of the business ensuring its longevity and its value. Consequently the operating performance measured by EBITDA and liquidity determined by the FCF are strengthened, and are therefore assumed to be relevant attributes of any valuation model and the first measurement towards establishing its value.
These results are in the line with those obtained by Reis and Augusto (2013b) based on a data panel analysis applied to a sample of 714 listed companies, belonging to 15 European countries, and for a period between 1992 and 2011. In fact, the terminal value; i.e., the value of the companies associated with longevity, is correlated with the average life expectancy of companies and their maturity associated with the quality of business that in interacting with the capital structure, good management skills, and innovation, along with a good allocation of resources to R&D activities, can generate EBITDA and, as a consequence, good liquidity, thereby ensuring the longevity of the life of the company and the creation of shareholder value over the long term in an ever more competitive world.
AUTHOR INFORMATION
Pedro M. Nogueira Reis, CFO, Ph.D. student at Faculty of Economics of University of Coimbra, Master in Business Studies - Faculty of Economics, University of Coimbra, CFO and Vice President at Grupo Visabeira, SGPS SA with a consolidated turnover of 600 million Euros and 109 companies worldwide, board member of Vista Alegre Group (listed in Portuguese Stock Index), Board Member of Banco Unico in Mozambique and 23 years of financial expertise as CFO in several companies. Pedro M. Nogueira Reis, CFO - Grupo Visabeira, SGPS, SA, Palácio do Gelo Shopping, 3º Piso, 3500-606 Viseu – Portugal. E-mail: pedro.pkings.reis@gmail.com (Corresponding author)
Mário Gomes Augusto, Ph.D., Assistant Professor with Aggregation degree at the University of Coimbra. Mario has published 36 articles in professional journals and 48 papers in proceedings of events, has 5 book chapters, published 5 books, and has 29 items of technical production. Mario has received 4 awards and/or honors and works in the area of Economics and Management; at professional activities Mario has interacted with 34 employees in co-authorship of scientific papers. Mário Gomes Augusto, Ph.D., University of Coimbra, School of Economics and Institute of Systems and Robotics, Avenida Dias da Silva, 165, 3004-512 Coimbra – Portugal. E-mail: maugusto@fe.uc.pt
REFERENCES
1. Al-Deehani, T. M. (2005). The determinants of stock prices in the Kuwait Stock Exchange: An extreme bound analysis. Investment Management and Financial Innovations, 3, 16-24.
2. Al-Omar, H., & Al-Mutairi, A. (2008). The relationship between the Kuwaiti banks share prices and their attributes. Scientific Journal of King Faisal University, 9(1), 325-338.
3. Al-Shattarat, H. K., Al-Shattarat, W. K., Al-Attar, A. M., & Al-Omoush, A. M. (2011). The effect of cash flow added (cva) on annual stock prices in Amman stock Exchange. Journal of Academy of Business and Economics, 11(3), 213-228.
4. Al-Tamini, H. A. S., Alwan, A., & Rahman, A. A. A. (2011). Factors affecting stock prices in the UAE financial markets. Journal of Transnational Management, 16(1), 3-19.
5. Augusto, M. G., Lisboa, J. V., & Yasin, M. M. (2014). Organisational performance and innovation in the context of a total quality management philosophy: An empirical investigation. Total Quality Management & Business Excellence, on-line published in February, 28. doi: 10.1080/14783363.2014.886372
6. Berkman, H., Bradbury, M. E., & Ferguson, J. (1998). The magic of earnings in terminal value calculations. Journal of Financial Statement Analysis, 3(4), 27-33.
7. Brisker, E. R., Colak, G., & Peterson D. R. (2013). Changes in cash holdings around the S&P 500 additions. Journal of Banking and Finance, 37(5), 1787-1807.
8. Buckley, A. (2003). Why is fundamental value so fundamental to directors? European Management Journal, 21(5), 635-646.
9. Buus, T. (2007). Terminal value parameters: A short note. European Financial and Accounting Journal, 2(2), 44-54.
10. Chen, N. F., Roll, R., & Ross, S. A. (1986). Economic forces and the stock market. Journal of Business, 59(3), 383-403.
11. Chun, H., Ha, J., & Kim, J.-W. (2014). Firm heterogeneity, R&D, and economic growth. Economic Modelling, 36, 149-156.
12. Cincera, M., Argilés, R. O., & Castello, P. M. P. (2010). Corporate R&D: An engine for growth, a challenge for European policy. 2nd Conference on Corporate R&D (CONCORD - 2010), JRC, European Comission.
13. Collins, J. (1957). How to study the behavior of bank stocks. The Analysts Journal, 13(2), 109-113. 14. Copeland, T., Koller, T., & Murrin, J. (2000). Valuation: Measuring and managing the value of companies
(3rd ed.). New York: John Willey & Sons.
15. Dadfar, J. J., Dahlgaard, J. J., Brege, S., & Alamirhoor, A. (2013). Linkage between organizational innovation capability, product platform development and performance: The case of pharmaceutical small and medium enterprises in Iran. Total Quality Management & Business Excellence, 24(7/8) 819-834.
16. Damodaran, A. (2002). Investment valuation: tools and techniques for determining the value of any asset. Wiley.
17. Damodaran, A. (2009). Equity risk premiums (ERP): Determinants, estimation and implications: A post-crisis update. New York - University Salomon Center and Wiley Periodicals, Inc.
18. Dasilas, A., & Leventis, S. (2011). Stock market reaction to dividend announcements: Evidence from the Greek stock market. International Review of Economics and Finance, 20(2), 302-311.
19. De Bondt, G. J. (2008). Determinants of stock prices: New international evidence. The Journal of Portfolio Management, 34(3), 81-92.
20. Demirakos, E. G., Strong, N. C., & Walker, M. (2004). What valuation models do analysts use? Accounting Horizons, 18(4), 221-240.
21. Elsner, S., & Krumholz, H. C. (2013). Corporate valuation using imprecise cost of capital. Journal of Business Economics, 83(9), 985-1014.
22. Fernandez, P. (2005). Equivalence of ten different methods for valuing companies by cash flow discounting. International Journal of Finance Education, 1(1), 141-168.
23. Ferreira, J. J. M. (2010). Corporate entrepreneurship and small firms growth. International Journal of Entrepreneurship and Small Business, 10(3), 386-409.
24. Flannery, M., & Protopapadakis, A. (2002). Macroeconomic factor do influence aggregate stock returns. Review of Financial Studies, 15(3) 751-782.
25. Forsman, H., & Annala, U. (2011). Small enterprises as innovators: Shift from a low performer to a high performer. International Journal of Technology Management, 56(2/3/4), 154-171.
26. Fuller, R. J., & Hsia, C. (1984). A simplified common stock valuation model. Financial Analysts Journal, 40(5), 49-56.
27. Gaud, P., Hoesli, M., & Bender, A. (2007). Debt-equity choice in Europe. International Review of Financial Analysis, 16(3), 201-222.
28. Ghosh, S. (2006). Leverage, managerial monitoring and firm valuation: A simultaneous equation approach. Research in Economics, 61(2), 84-98.
29. Gill, A., Biger, N., & Mathur, N. (2012). Determinants of equity share prices: Evidence from American firms. International Research Journal of Finance and Economics, 90(90), 176-192.
30. Gill, A., & Mathur, N. (2011). Board size, CEO duality, and the value of Canadian manufacturing firms. Journal of Applied Finance & Banking, 1(3), 1-13.
31. Gómez, J., & Vargas, P. (2012). Intangible resources and technology adoption in manufacturing firms. Research Policy, 41(9), 1607-1619.
32. Hair, J. F., Jr., Anderson, R. E., Tatham, R. L., & Black, W. C. (1998). Multivariate data analysis (5th ed.). NJ: Prentice Hall.
33. Hoffmann, A., Post, T., & Pennings, J. (2013). Individual investor perceptions and behavior during the financial crisis. Journal of Banking & Finance, 37, 60-74.
34. Ikromov, N., & Yavas, A. (2012), Cash flow volatility, prices and price volatility: An experimental study. Journal of Real Estate Finance and Economics, 44(1), 203-229.
35. Imam, S., Barker, R., & Clubb, C. (2008). The use of valuation models by U.K. investmentanalysts. The European Accounting Review, 17(3) 503-535.
36. Imam, S., Chan, J., & Zulfiqar, S. A. S. (2013). Equity valuation models and target price accuracy in Europe: Evidence from equity reports. International Review of Financial Analysis, 28(June), 9-19. 37. Irfan, C. M., & Nishat, M. (2002). Key fundamental factors and long-run price changes in an emerging
market: A case study of Karachi Stock Exchange. The Pakistan Development Review, 41(4), 517-533. 38. Jang, S. C. (2011). Growth-focused or profit-focused firms: Transitions toward profitable growth. Tourism
Management, 32(3), 667-674.
39. Jennergren, L. P. (2008). Continuing value in firm valuation by the discounted cash flow model. European Journal of Operational Research, 185(3), 1548-1563.
40. Jennergren, L. P. (2013). Firm valuation with bankruptcy risk. Journal of Business Valuation and Economic Loss Analysis, 8(1), 91-131.
41. Jensen, M. C., & Meckling, W. H. (1976). Theory of the firm: Managerial behavior, agency costs and ownership structure. Journal of Financial Economics, 3(4), 305-360.
42. Jian, M., & Lee, K. W. (2011). Does CEO reputation matter for capital investments? Journal of Corporate Finance, 17(4), 929-946.
43. Jiao, Y. (2011).Corporate disclosure, market valuation, and firm performance. Financial Management, 40(3), 647-676.
44. Kandasamy, N., Hardy, B., Page, L., Schaffner, M., Graggaber, J., Powlson, A. S,. Fletcher, P. C., Gurnell, M., & Coates, J. (2014). Cortisol shifts financial risk preferences. Proceedings of the National Academy of Sciences of the United States of America, online published in 18th of February of 2014, p.p. 2-6.
doi:10.1073/pnas.1317908111.
45. Karathanassis, G., & Philippas, N. (1988). Estimation of bank stock price parameters and the variance components model. Applied Economics, 20(4), 497-507.
46. Khan, S. H. (2009). Determinants of share price movements in Bangladesh: Dividends and retained earnings. Thesis for the degree of MSc. in Business Administration, 2009, School of Management Blekinge Institute of Technology. Retrieved 7-03-2014 from http://www.bth.se/fou/cuppsats.nsf/ all/7a3a58f2c2af8ba1c1257695000a3b1d?OpenDocument
47. Kheradyar, S., & Ibrahim, I. (2011). Financial ratios as predictors of stock returns. International Conference on Sociality and Economics Development IPEDR, 10, 318-322.
48. Koller, T., Goedhart, M., & Wessels, D. (2010). Valuation: Measuring and managing the value of companies (5th ed.). New York: John Wiley & Sons.
49. Kostopoulos, K., Papalexandros, A., Papachroni, M., & Ioannou, G. (2011). Absorptive capacity, innovation, and financial performance. Journal of Business Research, 64(12), 1335-1343.
50. Laopodis, N. F. T. (2011). Equity prices and macroeconomic fundamentals: International evidence. Journal of International Financial, Markets, Institutions & Money, 21(2), 247-276.
51. Lee, B.-S., & Suh, J. (2011). Cash holdings and share repurchases: International evidence. Journal of Corporate Finance, 17(5), 1306-1329.
52. Levin, J., & Olsson, P. (2000). Terminal value techniques in equity valuation - implications of the steady state assumption. (Working Paper Series in Business Administration).
53. Lewellen, J. (2004). Predicting returns with financial ratios. Journal of Financial Economics, 74(2), 209-235.
54. Lim, T. J., & Hong, N. M. (2012). Cross-section of equity returns motivated by Fama and French. Procedia Economics and Finance, 2, 2nd Annual International Conference on Accounting and Finance (AF 2012) and Qualitative and Quantitative Economics Research (QQE 2012), pp.284-291.
55. Martins, A. (2011). The valuation of privately held firms and litigation: A case study. International Journal of Law and Management, 53(3), 207-220.
56. Midani, A. (1991). Determinants of Kuwaiti stock prices: An empirical investigation of industrial services, and food company shares. Journal of Administrative Sciences and Economics, 2, 314-303.
57. Moro, A., & Matthias, F. (2013). Loan managers’ trust and credit access for SMEs. Journal of Banking & Finance, 37(3), 927-936.
58. Morris, J. R. (2009). Life and death of businesses: A review of research on firm mortality. Journal of Business Valuation and Economic Loss Analysis, 4(1), 1-39.
59. Motwani, R. K. (2013). Fundamental determinants of equity investments among infrequent small scale investors. Research Journal of Management Sciences, 2(4), 1-6.
60. Myers, S. (1977). Determinants of corporate borrowing. Journal of Financial Economics, 5(2), 147-175. 61. Nirmala, P. S., Sanju, P. S., & Ramachandran. M. (2011). Determinants of share prices in India. Journal of
Emerging Trends in Economics and Management Sciences, 2(2), 124-130.
62. Nisa, M., & Nishat, M. (2012). The determinants of stock prices in Pakistan. Asian Economic and Financial Review, 1(4), 276-291.
63. Novy-Marx, R. (2013). The other side of value: The gross profitability premium. Journal of Financial Economics, 108(1), 1-28.
64. O’Connor, M., Rafferty, M., & Sheikh, A. (2013). Equity compensation and the sensitivity of research and development to financial market frictions. Journal of Banking & Finance, 37(7), 2510-2519.
65. Petersen, C., & Plenborg, T. (2009). The implementation and application of firm valuation models. The Journal of Applied Business Research, 25(1), 1-12.
66. Pradhan, R. S. (2003). Effects of dividends on common stock prices: The Nepalese evidence. (Working paper series). Research in Nepalese Finance, pp. 1-13, Buddha Academic Publishers and Distributors Pvt. Ltd., Kathmandu.
67. Reis, P., & Augusto, M. (2013a).Business mortality table: the average of life expectancy as a fundamental instrument in calculation of the terminal or continuing value in enterprise valuation. Proceedings of 3rd Conference of International conference of Business and Management Journals (IBAM), 17-19, June, Lisbon, Portugal.
68. Reis, P., & Augusto, M. (2013b).Determinants of terminal value in the evaluation of companies: a panel data approach to the context of European companies. International Research Journal of Finance and Economics, 117(December), 118-138.
69. Roosenboom, P. (2012). Valuing and pricing IPOs. Journal of Banking & Finance, 36(6), 1653-1664. 70. Salim, M., & Yadav, R. (2012). Capital structure and firm performance: Evidence from Malaysian listed
companies. Procedia - Social and Behavioral Sciences, 65, 156-166.
71. Serra, A. P. (2003). The cross-sectional determinants of returns: Evidence from emerging markets’ stocks. Journal of Emerging Market Finance, 2(2) 123-162.
72. Shaked, I., & Kempainen, S. (2009). A review of fairness opinions and proxy statements: 2005-2006. Journal of Applied Finance, 19(1&2), 103-128.
73. Sharma, S. (2011). Determinants of equity share prices in India. Journal of Arts, Science & Commerce, 2(4), 51-60.
74. Sharma, S., & Singh, B. (2006). Determinants of equity share prices in Indian corporate sector: An empirical study. The ICFAI Journal of Applied Finance, 12(4), 21-38.
75. Somoye, R., Akintoye, I., & Oseni, J. (2009). Determinants of equity prices in the stock markets. International Research Journal of Finance and Economics, 30, 177-189.
76. Sunde, T., & Sanderson, A. (2009). A review of the determinants of share prices. Journal of Social Sciences, 5(3), 188-192.
77. Tuller, L. W. (2008). The small business valuation book (2nd ed.). Adams.
78. Tung, J. (2012). A study of product innovation on firm performance. The International Journal of Organizational Innovation, 4(3), 84-97.
79. Uddin, M. B. U. (2009). Determinants of market price of stock: A study on bank leasing and insurance companies of Bangladesh. Journal of Modern Accounting and Auditing, 5(7), 1-6.
80. Wua, M.-W. & Shen, C.-H. (2013).Corporate social responsibility in the banking industry: Motives and financial performance. Journal of Banking & Finance, 37(9), 3529-3547.