Supervisor
Diana Bonfim
“Profitability and risk of European banks – a
comparison between fixed and floating rates”
Ana Filipa Capela Cordeiro
‘Dissertation submitted in partial fulfillment of requirements for the degree of
Master in Finance, at the Universidade Católica Portuguesa, May 2019’.
Abstract
The share of floating-rate loans and fixed-rate loans varies across countries and over time. This is a study about how the movements in monetary policy interest rates defined by the European Central Bank and the changes in the yield curve of the countries influence the share of floating-rate loans. Moreover, there is also an attempt to study the impact of this type of interest floating-rate selection with the main components of profitability in banks. Using a ten-country panel and econometric models, I find that the monetary policy instruments do influence the choice of loans with variable rates. However, the effects of this choice on banks’ profitability is less significant, suggesting that it depends on other components. These conclusions contribute to the literature related with monetary policy and banks’ interest rate risk management.
Contents
Preface ... vii
1. Introduction... 1
2. The European banking sector ... 3
3. Literature review ... 9
4. Methodology and Data ... 15
4.1. Summary statistics ... 16
4.2. Econometric model ... 21
5. Empirical results ... 25
5.1. Monetary policy and country characteristics ... 25
5.2. Components of profitability ... 27
5.3. Robustness tests... 30
6. Conclusions... 33
Appendices ... 35
List of Images
Figure 1 – Short-term rate versus shadow rate ... 4
Figure 2 - Banks' balance sheet example ... 7
Figure 3 - Variable-rate mortgages in euro area countries [Hoffmann, Langfield, Pierobon and Vuillemey (2017)] ... 8
Figure 4 - GDP growth 2007-2017 ... 35
List of Tables
Table I - Summary statistics of the variables ... 17Table II - Pairwise correlations ... 20
Table III - Generalized lest squared fixed effect regression results between monetary policy and the share of new loans with floating rate (including shadow rate) ... 25
Table IV - Generalized lest squared fixed effect regression results between monetary policy and the share of new loans with floating rate (including short-term rate) ... 26
Table V - Generalized lest squared fixed effect regression results between the share of new loans with floating rate and the main profitability components (including shadow rate) ... 28
Table VI - Generalized lest squared fixed effect regression results between the share of new loans with floating rate and the main profitability components (including short-term rate) .... 29
Table VII - Robustness test for hypothesis 1 ... 31
Table VIII - Robustness test for hypothesis 2 ... 32
Table IX - Variables definition ... 36
Table X - Summary statistics of the variables by country ... 37
Table XI - Robustness test for hypothesis 1: countries with predominantly fixed interest rates (using ECB shadow rate) ... 41
Table XII - Robustness test for hypothesis 1: countries with predominantly fixed interest rates (using short-term rate) ... 41
Table XIII - Robustness test for hypothesis 1: countries with predominantly variable interest rates (using ECB shadow rate)... 42
Table XIV - Robustness test for hypothesis 1: countries with predominantly variable interest rates (using short-term rate) ... 42
Table XV - Robustness test for hypothesis 1: until 2014 (using ECB shadow rate) ... 43
Table XVI - Robustness test for hypothesis 1: until 2014 (using short-term rate) ... 43
Table XVIII - Robustness test for hypothesis 1: 2014 to 2018 (using short-term rate) ... 44
Table XIX - Robustness test for hypothesis 1, using interest rate up to 1 year ... 45
Table XX - Robustness test for hypothesis 2: countries with predominantly fixed interest rates (using ECB shadow rate) ... 45
Table XXI - Robustness test for hypothesis 2: countries with predominantly fixed interest rates (using short-term rate) ... 46
Table XXII - Robustness test for hypothesis 2: countries with predominantly variable interest rates (using ECB shadow rate)... 46
Table XXIII - Robustness test for hypothesis 2: countries with predominantly variable interest rates (using short-term rate) ... 47
Table XXIV - Robustness test for hypothesis 2: until 2014 (using ECB shadow rate) ... 47
Table XXV - Robustness test for hypothesis 2: until 2014 (using short-term rate) ... 48
Table XXVI - Robustness test for hypothesis 2: 2014 to 2018 (using ECB shadow rate)... 48
Table XXVII - Robustness test for hypothesis 2: 2014 to 2018 (using short-term rate) ... 49
Preface
The foundation of this work is related with my interest in the behaviour of the financial area, specially the banking sector. After those prominent years attached to the consequences of the crisis, it is quite interesting to understand all the actions made on this path. Were these decisions good for the financial and banking sector? There is an attempt to find some specific characteristics observed in the latest years.
Incontestably, this research would not be possible to concretize without a greater support team. Family comes first with their unconditional care and motivation. A big help with Stata and Bloomberg was given by two friends, who explained everything carefully and were not worried to waste their time as teaching me. My best friends and boyfriend were quite patient and demonstrated their fellowship and love all the time, what turned out to be an exceptional and additional strength to accomplish this work. Lastly, my supervisor is an example of professionalism and her recommendations contributed to improve the quality of the work, allowing us to work as a team.
1. Introduction
The economic recession caused by the financial crisis, tied to a disproportionate lending, produced a large negative impact in aggregate output and employment. Right after these effects on the financial and economic conditions, and because of the direct impact that interest rate changes have on economies, Central Banks took a firm stand by implementing some unconventional policies in which was included the setting of negative interest rates. In the case of the European area, European Central Bank (ECB) set a low-interest-rate policy that is currently influencing the banking sector, and which duration remains uncertain. These lower policy rates worked as a mechanism that Central Banks used in order to promote price (and financial) stability. The unconventional policy tools combine: 1) large-scale asset purchases; 2) lending facilities; 3) forward guidance; and 4) negative rates (thus going beyond the so-called zero-lower bond (ZLB)).
The low-interest-rate policy has a positive impact on the economy, as long as we are only focused on a short-term period. However, the side-effects of this interest-rate policy will only be seen slightly afterwards. Associated with this circumstance, there is uncertainty if these such low rates are a threat for the financial/ banking sector. The questions “What will happen when
interest rates return to normal levels?” and “How is bank performance going to react?” are a
concern across society. These issues are important not only for those who are embedded in financial area like banks and consumers, but for the whole citizens that can be affected by this matter.
The interest rates changes have a significant influence on the main components of bank profitability, such as return on assets, net interest income, non-interest income and provisions. Even with the higher “gap” related with customers wanting more long-term loans and quick access to savings, it is believed that banks record the necessary levels of capital to mitigate the eventual breaks in performance that higher interest rates might lead to. Nevertheless, macroeconomic conditions play a major role in the way monetary policy affects profitability of banks. If there is a contraction in the economy, that means the demand for loan and savings can decrease causing low margins and affecting profitability.
In the universe of loans, there are some that are tied to a fixed interest rate and others linked to an adjustable interest rate. A fixed interest rate is used in a fixed rate contract type, in which is charged a nominal interest rate that is constant during the entire life of the contract. On the opposite, an adjustable interest rate is linked to another classification of loan: an adjustable rate
1. Introduction
contract, meaning that this type of loan has an interest rate that changes over time, because is attached to a specific benchmark. It is still not so clear if all the actions related with the unconventional monetary policies applied by Central Banks are somehow related with the supply of loans with variable or fixed interest rates.
The traditional business of banking is characterized by short-term deposits funding long-term loans and this maturity mismatch creates an exposure to interest rate risk. However, banks have the possibility to transfer their interest rate risk to borrowers through a variable rate contract. For all that was referred above, the ambition related with this work consists in evaluating how monetary policy can affect profitability and risk behaviour in the European banking sector, comparing the differences between the European countries that use fixed and floating rates. An analysis regarding risk and profit of banks in a higher interest rate context is also a desired topic to cover.
Using a panel data that includes observations from some European countries, it is regressed a GLS model to determine whether monetary policy influences the decision between fixed and floating interest rates and how this decision affects profitability.
The dissertation is structured as follows: in Section 2 is presented an overview of the European banking sector. In Section 3 is summarized the literature review regarding the purpose of this work: monetary policy, profitability and fixed and floating rate loans. In Section 4 is detailed the methodology and data used in this work. In Section 5 the results of the empirical analysis through the econometric model are shown. Lastly, in Section 6 the conclusions of this work are summarized.
2. The European banking sector
The role of the Central Bank
Central Banks are responsible for monetary policy, determining the direction of the interest rates in the economy. Therefore, monetary policy influences the short-term interest rate directly through the central bank policy rate and the slope of the yield curve, in a more indirect manner, due to the management of market expectations about the future policy rate direction and the impact on the price of government securities. Regarding practical actions, in mid-2010 the European Central Bank (ECB) introduced the Securities Markets Programme (SMP) to provide critical liquidity injections in the European banks in order to overcome solvency problems in dysfunctional segments. Right in the end of the following year, it was implemented a mechanism called LTROs (Long Term Refinancing Operations) with the ambition to contribute for long-term liquidity and to stabilize funding conditions.
These non-standard policies implemented by the ECB had a repercussion on the slope of the yield curve, but some critics referred that it was the only way to overcome the effects of the crisis1. In fact, the influence of the yield curve became a better stimulus for the economy since
policy rates were nearly zero. For that reason, there was a commitment to guide forward policy rates and to purchase assets in a large-scale (quantitative easing). The combination of these policies has a significant impact on the yield curve at all maturities.
The traditional economic models are reliant on the official interest rates set by Central Banks and are quite efficient in normal economic times. With these unconventional policies, interest rates set by Central banks were nearly zero, the “zero lower bound”, and the effects of these policies were hard to quantify by economists. In order to find a way to measure these unconventional policies, some researchers suggested a different interest rate approach: the shadow rate2. This new tool would give the possibility to improve current economic models and
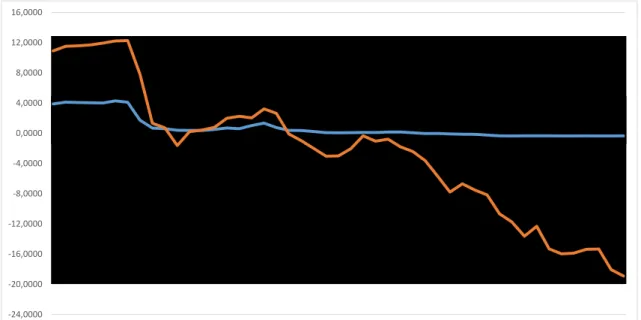
to measure the actual effects of monetary policy in the economy, as well as to track movements from several benchmark data and can even work when interest rates are in a negative path. As illustrated in Figure 1, the short-term rate and the shadow rate are different reflections of the monetary policy established by the European Central Bank between 2007 and 2018.
1 See El-Erian, M. A. (2016).
2 The shadow rate was initially found by Jing Cynthia Wu and Fan Dora Xia, from University of Chicago
academic and Merrill Lynch's, respectively. In Wu-Xia shadow rate the structural relationship between macro variables and this rate in not broken and that reveals that unconventional monetary policy did have some positive effect on the economy.
2. The European banking sector
Figure 1 – Short-term rate versus shadow rate
Impact on profitability
After the financial crisis, profitability gains improved due to a reduction in provisions associated with bad loans and asset quality also suffered an upgrade. The established monetary policies were an effective response to financial and economic issues since they created an opportunity to improve bank funding through central bank liquidity and to boost borrower creditworthiness with a reduction in the cost of debt. The higher yield curve slope turned out to contribute for an overall positive effect in Return on Assets (ROA). However, the following years, characterized by reductions in the short-term rates and also a shrink on the yield curve, led to downsize in ROA. The implementation of standard and non-standard monetary policies has also a direct impact on the diminishing of net interest income. That is because most of Credit institutions, especially small and medium-sized, have their business models reliant on income earned through interests and the actual market conditions might release a problem of income squeeze. This might be viewed in two ways:
Loans with higher yields are reaching maturity and being substituted by lower-yielding loans;
The narrow spread between short-term and long-term interest rates is generating a -24,0000 -20,0000 -16,0000 -12,0000 -8,0000 -4,0000 0,0000 4,0000 8,0000 12,0000 16,0000
mar/07 nov/07 jul/08 mar/09 nov/09 jul/10 mar/11 nov/11 jul/12 mar/13 nov/13 jul/14 mar/15 nov/15 jul/16 mar/17 nov/17 jul/18 3-month OIS ECB shadow rate
In addition, when both the short-term interest rates and the yield curve slope increases, there is a positive effect on net interest income of banks. Higher short-term rates bumps their interest rate margins, along with steeper yield curve that enables banks to raise returns from maturity transformation. On the other side, there is a negative correlation between the level of interest rates and non-interest income, partially offsetting the positive effect on net interest income. So, when the short-term rate increases, there is a reduction in non-interest income over total assets due to the effect on the valuation of securities and the same happens when the slope of the yield curve rises. Although, the interest rate structure has a positive relationship with provisions, more specifically, when interest rates increase there is a raise in loan loss provisions due to the influence in default probabilities and service costs. Thus, bank profitability improves when interest rates are high, meaning that the negative effects identified on non-interest income and provisions are neutralized by the positive outcome observed on net interest income. There is evidence that ROA increases if the short-term rate rises from 0% to 1%3 due to a tight monetary
policy and if there is a rise in the slope of the yield curve.
However, all the evidence about low interest rate periods being synchronized with lower or even negative bank profitability, does not necessarily mean a causal relationship. This relationship is a consequence of the interest rates set by central banks when the economy is facing a phase of low performance4. Given that, the low interest rate policy is bad for the profitability of a bank in
the long-term but is usually offset by the recovery of the economic conditions.
These low levels of rates enabled the increase of capital gains and the reduction of Non-performing Loans (NPL), but are also correlated with lower net interest margins (difference between interest earned on assets and interest paid on deposits) and that can be expressed in the following manners5:
I. As interest rates decline, expenses tied to interests face a lower reduction than income and that means a smaller net interest margin;
II. In more developed economies there is an opposite effect when interest rates are lower;
III. Net interest margins are affected in a negative way as long as interest rates maintain low levels.
3 See eg Borio, Gambacorta and Hofmann (2015) 4 See eg Altavilla, Boucinha and Peydró (2017). 5 See eg Claessens, Coleman and Donnelly (2017).
2. The European banking sector
Generating profit and creating credit are two prominent features of banks profitability. Hence, a bank with higher levels of profit can easily attract capital from outside investors and also generate capital inside through net earnings retained by the bank. This profit capacity enhances the bank image and boosts the economy, leading to the stability of the financial system. Due to the concern about the decline of net interest margins and profitability, banks are trying to find other sources to improve their revenue and increase their profit margins. Lengthening the maturity structure of assets, finding new sources of income through the raise of fees and commissions and using cost-cutting measures are some of the manners to overcome this issue. Additionally, banks can consciously put money into riskier assets, go for hedging activities and retain capital as a cushion against losses. There is also a concern about the risks that banks can hold. Bank’s stakeholders are the most interested in understanding how low interest rates can affect performance and that can vary across the distinct characteristics of banks such as interest rate exposure, degree of maturity transformation and use of hedging activities.
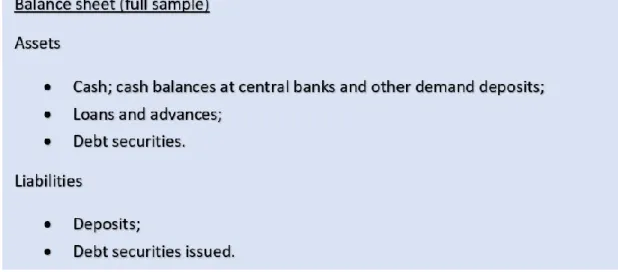
Risk management and banks’ characteristics
The impacts caused by the adjustments of interest rates affect each bank in a different way. For instance, a small bank is more affected on the short-term by changes in rates since it is linked to traditional channels that are more reluctant to negotiate prices and that are associated with floating rate loans. The characteristics that differentiate small and large banks are their balance sheet composition and their own business models. An institution with more long-term assets than liabilities is vulnerable to the rise of interest rates: as interest rates increase, a bank that has a higher percentage of long-term assets than long-term liabilities is going to experience losses due to the quicker repricing of liabilities compared to the asset side. In Figure 2 there is an example of the composition of the balance sheet of a bank.
Figure 2 - Banks' balance sheet example
Typically, banks use adjustable rates on short-term funding and that naturally means that banks might be more willing to supply floating rate loans. If it is possible to raise long-term funds with a fixed rate, banks are also capable to supply fixed rate loans, considering that an exposure to interest rate risk is kept6. Besides that, banks are also able to supply fixed rate loans and floating
rate loans in the same scale as long as they are predisposed to hedge in a deeply way and that means the analysis of bank specific characteristics is crucial to clarify banks' exposure to interest rate risk.
Fixed-rate assets and liabilities can have different maturities. In the case of floating rate assets and liabilities, it could have different repricing periods, as well as base rates of different maturities. The decision between fixed rate loans and variable rate loans is driven by demand and supply factors. On the demand side, the level of education of the borrower and its financial condition play a major role in this matter. Borrowers’ with a deeper knowledge know that a fixed rate contract originates more costs that a floating rate contract, but they are also aware of the unpredictability of an adjustable rate type of mortgage. On the supply side, bank funding and liquidity conditions are determinant. Essentially, the composition of liabilities influences the offer of a certain type of loan. Lending policies are defined by banks according to the demand conditions of each country. For instance, in a country with higher default rate, a bank might exclude giving a variable rate loan if they consider that would hurt that economy. There is also a evidence7 about countries that have more residential loans linked to adjustable rates record a
higher historical volatility of inflation and that contributes to a larger insurance through an adjustable rate contract. This happens because when banks realize that the level of volatility
6 Hoffmann et al. (2017)
2. The European banking sector
inflation is high, they try to protect themselves from inflation risk by setting higher interest rates on fixed rate loans and due to this higher costs, borrowers prefer to choose a loan with an adjustable rate.
As illustrated in Figure 3, Europe is characterized by a huge discrepancy according to the grant of fixed and adjustable rate loans for house purchase across the constituent countries. Belgium, France, Germany and Netherlands hold more loans with a fixed rate, whereas Austria, Greece, Italy, Spain and Portugal possess a bigger percentage of floating rate loans (ECB, 2009; Campbell, 2012). The share of fixed rate loans to total new loans for house purchase is also different amongst the countries, being Germany and Portugal, the ones maintaining the type of interest rate granted more constant, but in the contrary, Italy and Greece record a higher level of interest rate variation (ECB, 2009). Interest-rate risk tied to banking sector differs across countries, which have direct consequences on financial stability.
Figure 3 - Variable-rate mortgages in euro area countries [Hoffmann, Langfield, Pierobon and Vuillemey (2017)]
Moreover, the risks related to the current low interest rates environment are not the only issues that must be supervised. Experts are aware that the turning point of the level of interest rates has to be investigated, meaning that the end of this low rate environment might be a source of major risk. Because of that, the responsibility to bear interest rate risk is important, considering that the transmission of monetary is affected by the allocation of interest rate risk and that this allocation plays a major role in financial stability.
3. Literature review
More than ten years ago, the subprime borrowers in the US have run into massive defaults that led to enormous declines in portfolios with asset-backed securities (ABS), which were quite well rated. Despite the intervention by the U.S. Treasury and the Federal Reserve, this subprime crisis had a contagious effect on global financial markets (Longstaff, 2010).
The U.S. subprime crisis in 2007 led to a destruction of equity in several banks all over the world, in late 2008, culminating in the failure of Lehman Brothers. However, the bad performance was not the same across banks. Macroeconomic disparities did have a great impact in the performance of banks during the crisis since countries with account surpluses dealt with a better efficiency in its banks. Beltratti and Stulz (2012) use the variation of stock returns of large banks across the world during the period of July 2007 to December 2008 to evaluate which factors had the most importance for the weak performance of banks. As some theories, the results highlight the short-term capital market funding. Previously to the credit crisis, banks with better performance felt lower returns and fewer leverage. Only large banks from countries that had some limits on bank activities demonstrated a better performance during the crisis, in a general analysis there is no correlation between performance of banks and the differences in regulations of each countries.
The global financial crisis led to a freeze in the interbank markets as well as some liquidity actions via Central Banks. The business practices in the banking sector and the regulatory and supervisory framework suffered a huge reformulation. More specifically, the European banking industry faced a remarkable transformation since the financial crisis. Through the analysis of the bank’s financial statements, net interest income is still the most important component of revenues. Comparing to ten-years ago, the share of net interest income to total revenues has increased from 35% to more than half (52%) (Schildbach, 2017).
In line with that, Borio, Gambacorta, and Hofmann (2015) developed an analysis about the impact of monetary policy on the interest rate structure (the level of short-term rate and the slope of the yield curve), in the main components of bank profitability (net interest income, non-interest income and loan loss provisions), including ROA, where specific macroeconomic conditions and bank-specific characteristics were under control. The findings indicate the relationship between the interest rate structure and ROA is positive, meaning that profitability is improved with higher rates and a steeper yield curve.
3. Literature review
The determinants of bank profitability are divided in two categories. More internally, the bank-specific ratios, are equity over total assets, loans over total assets, non-interest earning assets over total assets. The external factors are linked to macroeconomic indicators such as GDP, money supply growth, inflation, real interest and tax rate (Demirgüç-Kunt and Huizinga, 1998). In the case of standard monetary policies, it generates different outcomes on the core factors related with bank profitability: affect positively loan loss provisions and negatively net interest income. The transmission of monetary policy to bank profitability must be in line with the unique characteristics of each bank’s balance sheet. A more accommodative monetary policy is more suitable with banks with higher operational efficiency and banks with lower asset quality. The profitability of a bank is also a consequence of a good balance sheet management such as capital, liquidity, nonperforming loans and efficiency.
The impact of monetary policy actions on stock market returns, i.e., effects on both debtholders’ net wealth and credit risk, are crucial for the stability of the financial system since debt matters to estimate bank’s value. Bank profitability is highly likely to be affected by a low interest rate environment but only for an extended period and these long-term consequences are usually offset by the favourable effects that these expansionary monetary policies have on real economic activity. In fact, expected real economic activity is needed to evaluate the impact of monetary policy on bank profitability (Altavilla, Boucinha and Peydró, 2017). Nevertheless, if expected aggregate economic and financial conditions are under control, we can observe that monetary policy conditions and bank profitability are no longer correlated. This means that the low monetary policy rates are associated with lower bank profits only in the case that the analysis does not include the control of the expected (in addition to current) economic and financial conditions.
In the initial stage of the crisis, and now taking into account the U.S. banking sector, the decrease in the federal funds rate was the main monetary policy tool used by the Federal Reserve to revitalize the economy and control inflation. Nevertheless, after 2008 the federal funds rate has been facing values close to zero and the Fed tried a different approach to increase economic stimulus. Since an additional decrease of the federal funds rate would not be effective, the Fed started to purchase assets in a large scale (the quantitative easing tool) and guide them in order to influence interest rates in a long-term perspective, consisting in their unconventional policy mechanism. These unusual monetary policy actions turned out to be difficult to analyze as the
debates regarding the importance of the shadow rate to measure and to describe the innovative monetary policy approach at ZLB. The shadow rate term structure model (SRTSM) was used as a new tool to measure the impact of unconventional monetary policy set by the Fed on the economy.
Equally important to this work is the problem of interest rate loans' choice. Campbell and Cocco (2003) show that this issue might involve many considerations. In this framework, borrowers facing low level of income and savings would probably choose a loan with a reduced interest rate at the time of its application. Since a fixed interest rate usually requires a term premium and a cost of prepayment option, a borrower facing these circumstances would go for a loan with an adjustable rate and this means facing some uncertainty regarding the periodic payments. Nevertheless, if a household has a low capacity to bear risk due to high loan-to-income ratio and low financial wealth, would likely choose a fixed-rate mortgage (FRM). A few years later, Campbell, J. Y. (2012), explains that macroeconomic outcomes might be influenced by the form of the mortgage system as it can adjust the transmission mechanism of monetary policy and the political constraints on the central bank. Consequently, the macroeconomic history of a country works as an influencer on its mortgage system. Countries with prevailing FRMs and adjustable-rate mortgages (ARMs) react differently to increases in interest rates. In a FRM system, an increase in interest rates does not change the mortgage payments of existing borrowers, only new borrowers are directly affected. Although, in an ARM system, an increase in interest rates is harmful for prevailing borrowers since their payments also increase. This might cause a borrowing constraint and in this sense, monetary policy tries to adapt its actions according to the type of mortgage system. Specifically, a history of volatile inflation is strongly associated with the use of ARMs because this macroeconomic condition makes nominal FRMs with prepayment options excessively risky for lenders and therefore too expensive for borrowers. It is also questioned why mortgage systems in southern Europe have predominantly ARMs even after the introduction of the euro but there an intuition that it might result from the difficult and expensive task to educate borrowers about mortgage contracts.
An important issue is also related with how current and future expected interest rates can affect the variation of ARM shares in terms of total new mortgages. The role played by the historic volatility of inflation, along with the cross-country variation, are critical features to take in consideration (Badarinza et al., 2017). In the demand side, a higher spread between long-term and short-term interest, stronger economic growth and less volatility of unemployment are not the favorable macroeconomic conditions to get an ARM (Ehrmann and Ziegelmeyer, 2017).
3. Literature review
Calza, Monacelli, and Stracca (2012) and Garriga, Kydland, and Sustek (2013) demonstrate that the share of ARMs in an economy in entirely related with the transmission of monetary policy because with higher ARM shares, the economy is more responsive to monetary policy.
More related with the share of FRMs and taking into account the countries where the sovereign debt crisis caused more damages, Albertazzi, Fringuellotti and Ongena (2018) developed an analysis in the euro area in order to explain the conditions that determine the local demand for credit and the characteristics of banks that supply credit. As well as with ARMs, it was found that country demand factors explain better the variation of the share of FRMs to total new mortgages. There was an effort to guarantee the equal weight of these conclusions to all country observations and due to that, they adopt an approach that includes each country demand indicators. It was found that the Historical Inflation Volatility is the more statistically significant variable. Also relevant, an increase in Outstanding Covered Bonds to GDP and in Outstanding RMBS (residential mortgage-backed securities) to GDP lead to a growth in the share of FRMs per country (the dependent variable considered in the analysis).
Hoffmann, P., Langfield, S., Pierobon, F., and Vuillemey G. (2017) state their findings are consistent with the heterogeneity with which each country is exposed being related with type of loan fixed by that country. Some banks benefit from an increase in interest rates but other can be hurt once the transmission of monetary policy is perceived in each country differently and because of that, the bank balance sheet channel is expected to be different across countries. The findings are clear: banks that operate in countries that use more fixed-rates are more affected by increases in interest rates. Thus, higher interest rates tend to have a good impact in banks that operate in countries that use variable-rate contracts in a large scale since there is a quick re-pricing of income in these assets and the present value loss is not as severe as for fixed-rate assets. In a conservative point of view, an increase in interest fixed-rates would create a maturity mismatch on the one hand, as a result of the present value of their assets being inferior against the present value of their liabilities and on the other hand due to the interest expense paid on liabilities increases faster than the interest income earned from assets. Differently from this traditional knowledge, the results demonstrate that an increase in interest rates would benefit nearly half of the banks included in the sample when it comes to net worth and income. Regarding the average share of new residential loans, in the euro area, with variable interest rate, between 2011 and 2015, it is possible to identify two distinct groups: Belgium, Germany, France, Netherlands and Slovakia characterized by a low share of variable-rate mortgages (7%
Moench, Vickery, and Aragon (2010), besides being more focused in the US, study how the unconventional monetary policy set by the Federal Reserve affects mortgage choice for new mortgages and propose that FRMs have become relatively more attractive as a result of the large-scale purchases of fixed-rate mortgage-backed securities.
Fuster, A. and Vickery, J. (2014) suggest that lenders reduce the supply of FRMs in an unreasonably way as long as loans are difficult to securitize and can be retained in portfolio. This shrinkage in FRM supply could be implemented by lenders through an increase in mortgage interest rates and fees applicable on FRMs, in order to induce borrowers to substitute FRMs for ARMs. In a more severe way, lenders could simply limit the supply of certain mortgage contracts. The share of FRMs might be reduced if there are regulatory or legislative actions that discourage securitization, such as the implementation of stringent risk retention requirements.
Banks have their liabilities attached to floating rates, so there is a preference to lend to firms also with floating rates (Kirti, 2017). By doing that, banks pass interest-rate risk to borrowers. Banks have their loans and securities financed by deposit liabilities and internal wealth. These deposit liabilities are considered short-term and consequently floating. If there is an increment in interest rates, deposit interest expense rises. With that, there will be a decrease in net income as long as banks hold merely fixed-rate assets. If there is really a mismatch between banks’ assets and liabilities, they need to be cautious about the uncertainty of the future interest rates. Having in mind Froot et al. (1993), banks and firms are risk averse as a result of financial frictions. This risk aversion is important for the exposure to interest rate risk. Changes in interest rates can be associated with asset liability management techniques and hedging activities used to diminish interest rate risk. Since there are associated costs with the hedging activity, banks make floating-rate loans to firms in order to overcome the mismatch in their balance sheet. Therefore, banks can tolerate higher risk when their access to securitization markets is more feasible and these conditions are a comparative advantage for the issuance of FRMs (Foà, Gambacorta, Guiso & Mistrulli, 2015).
Despite significant leverage, bank net interest margins have historically been very stable (Flannery 1981, English 2002, English et al. 2013).
It is complex to manage interest rate risk since it can be expressed in a few forms: repricing risk, yield curve risk and basis risk. If the rates suddenly go up in a high level, the performance of bank earnings would be affected since the short-term response is not effective as the average yield on assets and liabilities is highly affected by changes in interest rates and as so, we are in the presence of a repricing risk event (English, 2002).
3. Literature review
Basten, Guin and Koch (2018) contribute to the literature on banks’ interest rate risk management, as well as to the household mortgage choice. In line with Santomero (1983) and Kirti (2017), they argue that banks try to reduce the mismatch among their liabilities and assets by offering loans with shorter fixation periods. With the increase in interest rates, the disposable income for households is reduced, especially for those that have ARMs, and that can cause a payment failure of their mortgages. Banks might face a credit risk increment when these conditions are verified. The repricing frequency of a retail bank’s assets is typically lower than the frequency of the majority of their liabilities. Although, there is a possibility to hedge this risk exposure through interest rate swaps (Vuillemey, 2017), most of banks retain part of interest rate risk exposure on their balance sheets (Purnanandam, 2007; Hoffmann et al., 2017; Vuillemey, 2017). This might be instigated by the collateral constraints related with the hedging activities through swaps (Rampini & Viswanathan, 2010; Rampini & Viswanathan, 2013; Rampini et al, 2017). The hedge of all risks would reduce the profitability of the bank business even with fairly priced swaps.
As well as banks which did not receive government assistance in the crisis have minor levels of interest rate risk (Chaudron,2016), the impact of a change in interest rates in a bank is larger when there is a higher exposure to interest rate risk in lending activities (Beutler, Bichsel, Bruhin & Danton, 2017).
4. Methodology and Data
This paper analyses the consequences of the implementation of monetary policies on European banks by country, regarding profitability and risk, through a comparison between the use of fixed and adjustable interest rates. The steps attached to this analysis are stated below:
I. Focus on the euro area, extract from the ECB data that contains the information about which European countries mainly use fixed and floating rates;
II. Accounts for macroeconomic variables that are relevant to translate each countries’ background;
III. Uses data from the ECB countries’ balance sheet, more specifically the main profitability components;
IV. Studies the average impact of monetary policy on bank’s type of interest rate given to borrowers in some EU countries;
V. Evaluates the impact of the type on interest rate linked to loans changes on the main components of bank profitability: return on assets, net interest income, non-interest income and provisions;
VI. Examines whether a period of low interest rates might impair bank profitability; VII. Explores the main channels though which monetary policy actions might influence bank
profitability.
The analysis is mainly focused on ten EU countries8: Austria, Belgium, Finland, France, Germany,
Ireland, Italy, Netherlands, Portugal and Spain.
In terms of data selection, it was collected from different sources and covering datasets from December 2007 and September 2018, in a quarterly basis.
The analysis exploits how the share of variable-rate loans in total loans is affected by the monetary policy instituted. Furthermore, there is an attempt to link this share of variable-rate loans given by banks to households and non-financial corporations with bank profitability, through the lens of countries’ bank profitability drivers.
8 The variables intended to include in this analysis were not available for all EU countries. Because of
that limitation, the chosen countries were the ones in which was most possible to gather the wanted information.
4. Methodology and Data
A set of variables was chosen according to its specification and relevance to the purpose of this analysis and are stated below9:
1) Role of monetary policy
In this sense some financial variables are taken from Bloomberg and the last from Wu-Xia shadow rates website:
Short-term rate Yield curve Shadow rate
Short-term rate is the three-month overnight index swap (OIS); Country-specific slope is the difference between ten and two-year sovereign yields.
2) Macroeconomic outlook
There was a selection of two macroeconomic indicators sourced from Eurostat: GDP growth
HICP inflation
3) Bank balance sheet characteristics summarized by country
The main profitability components were collected from the European Central Bank: Return on assets
Net interest income Net non-interest income Provisions
This data belongs to ECB Statistical Data Warehouse and for the purpose of this work it was used the Consolidated Banking Data (CBD2 dataset), downloaded for EU countries that are subject of analysis in this work, with a quarterly frequency.
4) Risk assessment indicators
A dataset related with the monitoring of systemic risk was collected from European Central Bank:
Share of variable rate loans in total loans to households and non-financial corporations;
Annual growth rate of new loans to households and non-financial corporations.
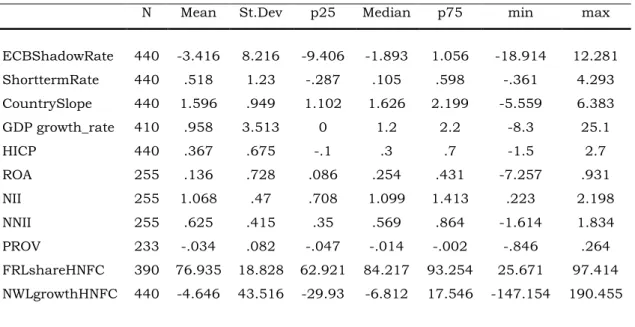
Table I displays the summary statistics for financial, macroeconomic, balance sheet and risk assessment variables used in the empirical analysis. Additionally, the average value of each variable used in this sample is clustered by country, in the Appendix.
Table I - Summary statistics of the variables
N Mean St.Dev p25 Median p75 min max
ECBShadowRate 440 -3.416 8.216 -9.406 -1.893 1.056 -18.914 12.281 ShorttermRate 440 .518 1.23 -.287 .105 .598 -.361 4.293 CountrySlope 440 1.596 .949 1.102 1.626 2.199 -5.559 6.383 GDP growth_rate 410 .958 3.513 0 1.2 2.2 -8.3 25.1 HICP 440 .367 .675 -.1 .3 .7 -1.5 2.7 ROA 255 .136 .728 .086 .254 .431 -7.257 .931 NII 255 1.068 .47 .708 1.099 1.413 .223 2.198 NNII 255 .625 .415 .35 .569 .864 -1.614 1.834 PROV 233 -.034 .082 -.047 -.014 -.002 -.846 .264 FRLshareHNFC 390 76.935 18.828 62.921 84.217 93.254 25.671 97.414 NWLgrowthHNFC 440 -4.646 43.516 -29.93 -6.812 17.546 -147.154 190.455
The interest rate metrics related with monetary policy, ECB shadow rate and short-term rate, present different values of the statistics shown above. The average ECB shadow rate is negative (-3.416) when it is compared to the moderately positive value for the short-term rate (0.518). The minimum value is negative in both variables (ECB shadow rate, -18.914 and short-term rate, -0.361) and the maximum value is also aligned, being positive in these variables (ECB shadow rate, 12.281 and short-term rate, 4.293). The standard deviation of the ECB shadow rate is more substantial than the one displayed on short-term rate (8.216 versus 0.518) which means the first rate has a greater dispersion of values during the analysed time period. The results shown above are quite discrepant, meaning that these two rates, besides trying to demonstrate the same measures in terms of central bank policy rate, exhibit different values and that is related with its ability to capture the behaviour of the market in these monetary policy circumstances.
The Country slope variable has a positive average value of 1.596 but a minimum value of -5.559 and a maximum value of 6.383. Through an analysis by country (Table X), it is possible to observe two countries with negative values concerning the minimum values of its slope: Ireland (-1.526) and Portugal (-5.5595). These are obviously associated with the sovereign downgrades of bond issued by these countries during the critical period. Sovereign bonds are affected by three main factors: aggregate risk, country-specific risk and contagion risk. The aggregate risk factor is
4. Methodology and Data
entirely related with the monetary policy changes and market uncertainty. In its turn, country-specific risk is driven mainly by changes in default probabilities on the sovereign debt.
FRLshareHNFC presents an average value of 76.935 indicating that the majority of the countries included in this sample use more variable interest rates when granting new loans to households and non-financial corporations. This is in line with the evidences in ECB (2009) and Campbell (2012). As seen on Table X, Finland has the higher average FRLshare (95.65386) and the lowest one belongs to France (40.37726). This means that Finland has their banking sector tied to variable-rate loans and France, in an opposite direction, relies on fixed-rate loan contracts given to their borrowers.
Regarding the profitability variables, the average of return on assets, net-interest income and non-net interest income show a positive value. Provisions, for instance, present a negative average value, but that is related with the sign expected for this component in the income statement since it is an expense account. That particularity about provisions means that the more negative is the value for this component, the more provisions were registered to overcome losses. In terms of the results by country, both Ireland and Portugal have the lowest average percentage on ROA (-0.532089 and -0.1113986) and the highest value belongs to Finland (0.4660846). Nevertheless, and in a general way, the return on assets of the economies included in this analysis did not exhibit a high percentage (0.136). These outcomes are in line with the low values recorded in the majority of the banks of some advanced economies, after the global financial crisis. The average net-interest income of the sample (1.068) is roughly homogenous across the countries presented on this sample. That is linked to the fact most of credit institutions, especially small and medium-sized, have their business models reliant on income earned through interest. Concerning non-net interest income, the average percentage is 0.625, but considering the analysis across countries, Belgium, Ireland and Netherlands present negative percentages about minimum values observed among this indicator. Italy has the highest average value (1.003456). When interest rates decrease, which was the case with the non-standard policies applied, non-interest income over total assets face an upturn because of the effect on the devaluation of securities. The average percentage of provisions is -0.014. However, Belgium is the only country with an average positive value in provisions (0.0019957), and having in mind what was explained above, it can mean that there was a less need to register provisions in Belgium banks’ accounts. In fact, when interest rates decrease, there is a reduction in loan loss provisions due to the shrinkage of default probabilities and service costs.
According to Gujarati (2003), when there is a high (but not perfect) correlation between two or more independent variables, a value of 0.8, we are in the presence of a multicollinearity phenomenon. In this case, it is possible to observe a correlation coefficient of 0.815 between the variables “ShorttermRate” and “ECBShadowRate”. The correlation between these two variables is the highest among all variables and it makes sense as “ShorttermRate” and “ECBShadowRate are similar measures in terms of classification.
It was found some statistically significance correlation, beside not being much strong, between the monetary policy variables and the share of loans with a floating rate, where ECB shadow rate has the highest value, 0.251.
4. Methodology and Data
Table II - Pairwise correlations
Variables (1) (2) (3) (4) (5) (6) (7) (8) (9) (10) (11) (1) FRLshareHNFC 1.000 (2) CountrySlope 0.183* 1.000 0.000 (3) ShorttermRate 0.151* -0.297* 1.000 0.003 0.000 (4) ECBShadowRate 0.251* 0.014 0.815* 1.000 0.000 0.764 0.000 (5) GDP_growthrate -0.145* -0.228* -0.080 -0.231* 1.000 0.006 0.000 0.105 0.000 (6) HICP 0.038 -0.091 0.248* 0.143* -0.012 1.000 0.460 0.057 0.000 0.003 0.813 (7) ROA -0.094 -0.385* -0.009 -0.142* 0.157* 0.116 1.000 0.159 0.000 0.890 0.023 0.014 0.064 (8) NII 0.366* 0.224* 0.315* 0.456* -0.101 -0.056 0.055 1.000 0.000 0.000 0.000 0.000 0.115 0.375 0.386 (9) NNII 0.188* -0.000 0.189* 0.170* -0.176* 0.119 0.312* 0.480* 1.000 0.005 0.994 0.002 0.007 0.006 0.058 0.000 0.000 (10) PROV -0.197* -0.135* -0.074 -0.082 0.085 0.059 -0.045 -0.331* -0.228* 1.000 0.005 0.039 0.264 0.211 0.205 0.368 0.499 0.000 0.000 (11) NWLgrowthHNFC -0.237* -0.340* 0.101* -0.135* 0.175* 0.001 0.311* -0.217* 0.003 0.012 1.000 0.000 0.000 0.035 0.005 0.000 0.988 0.000 0.000 0.968 0.854
4.2. Econometric model
In spite of the existing studies covering the impacts of monetary policy on bank’s profitability, there are not many studies in which the type of interest rates that lenders are willing to choose are included, most notably if it is taken into account the monetary policy settled as well as the effect on bank’s profitability drivers. In that sense, this empirical analysis consists on testing the following hypothesis:
H1: monetary policy influences the choice by borrowers and lenders in EU countries for floating-rate loans;
H2: the share of floating-rate loans affects the different components of profitability. We are in the presence of a panel data since there are many observations, followed over time (similar to cross-sectional data and time series). More specifically, and because this is a panel data characterized by a long period of time (large T) and for a limited set of countries (small N), this is a macro panel dataset. This is also a balanced panel data because most of the observations (N) are followed for the same number of periods (T) but there are also some missing values that can lead to an unbalanced panel data classification.
Nevertheless, being a panel data means identifying the presence of unobservable omitted variables, which is a common problem in empirical studies. If omitted variables are correlated with the explanatory variables of a certain model, it leads to inconsistency, and that is why panel data is considered to be a powerful solution.
In terms of the type of regressions, the main difference between Generalized Least Squares (GLS) and Ordinary Least Squares (OLS) is that in the first one takes the error term of the model into account and the last one ignores it. In a practical way, OLS is asymptotically as efficient as GLS except when there are auto correlated disturbances in the regression. The choice between GLS versus OLS is entirely related with the gain of asymptotic efficiency and the achievement of a smaller variance for n.
For all that was just referred, and because this is considered mostly a balanced panel data, the method that is more suitable is GLS. This conclusion was confirmed by the results between GLS with fixed effects (FE) method and OLS, being the first one more efficient. The GLS method with random effects (RE) was not considered regarding the Hausman test that allows to choose between fixed and random effects.
In the first hypothesis stated above, we use two different variables when it comes to the interest rate linked to monetary policy. The shadow rate is used as first plan, since it tends to be more
4. Methodology and Data
accurate, and the short-term interest rate is used as an alternative, just for an additional analysis and as a term of comparison.
Regarding the second hypothesis, the monetary policy metrics become part of the country controls and comprise the country-specific slope, the ECB shadow rate and the short-term interest rate, in line for all that was stated above.
The first equation for hypothesis 1 is presented below:
FRLshareH&NFC𝐣,𝐭= β1ECBShadowRatet+ β2Slopej,t+ ΩΧj,t+ εj,t (1)
FRLshareH&NFC j,t: share of new business loans with a floating rate or an initial rate fixed for a
period of up to 1 year in total new business loans to households and non-financial corporations; β1 ECBShadowRate t: the level of short-term interest rate associated with unconventional
monetary policies;
β2 Slope j,t : coefficient associated with the country-specific slope, the difference between ten-
and two-year sovereign yields of each country; ΩΧ j,t : country-specific controls, including:
- GDP growth; - Expected inflation; - Country-fixed effects;
- Annual growth rate of new loans to households and non-financial corporations. ε j,t: composite error that includes unobserved (individual) heterogeneity and time-varying error.
The second equation related with hypothesis 1 and used as contingency is stated as follows: FRLshareH&NFC𝐣,𝐭= β1Levelt+ β2Slopej,t
+
ΩΧj,t+
εj,t (2)FRLshareH&NFC j,t: share of new business loans with a floating rate or an initial rate fixed for a
period of up to 1 year in total new business loans to households and non-financial corporations; β1 Levelt: coefficient associated with the level of short-term interest rate, three-month OIS;
β2 Slopej,t : coefficient associated with the country-specific slope, the difference between ten-
and two-year sovereign yields of each country; ΩΧj, : country-specific controls, including:
- Country-fixed effects;
- Annual growth rate of new loans to households and non-financial corporations. ε j,t: composite error that includes unobserved (individual) heterogeneity and time-varying error.
Additionally, it is estimated the following equations for hypothesis 2:
ROA𝐣,𝐭= β1FRLshareH&NFC𝐣,𝐭+ ΩΧ𝐣,𝐭+ ε𝐣,𝐭 (3)
NII𝐣,𝐭= β1FRLshareH&NFC𝐣,𝐭+ ΩΧ𝐣,𝐭+ ε𝐣,𝐭 (4)
NNII𝐣,𝐭= β1FRLshareH&NFC𝐣,𝐭+ ΩΧ𝐣,𝐭+ ε𝐣,𝐭 (5)
PROV𝐣,𝐭= β1FRLshareH&NFC𝐣,𝐭+ ΩΧ𝐣,𝐭+ ε𝐣,𝐭 (6)
ROA j,t : return on assets of a country “j” at time “t”;
NII j,t : net interest income of a country “j” at time “t”;
NNII j,t : net non-interest income of a country “j” at time “t”;
PROV j,t : provisions of a country “j” at time “t”;
β1 FRLshareH&NFC j,t : share of new business loans with a floating rate or an initial rate fixed for
a period of up to 1 year in total new business loans to households and non-financial corporations;
ΩΧ j,: country-specific controls, including:
- GDP growth; - Expected inflation; - Country-fixed effects;
- The level of short-term interest rate associated with unconventional monetary policies, ECB shadow rate, and the level of short-term interest rate, three-month OIS;
- Country-specific slope, the difference between ten- and two-year sovereign yields of each country;
- Annual growth rate of new loans to households and non-financial corporations. ε j,t: composite error that includes unobserved (individual) heterogeneity and time-varying error.
5. Empirical results
5.1. Monetary policy and country characteristics
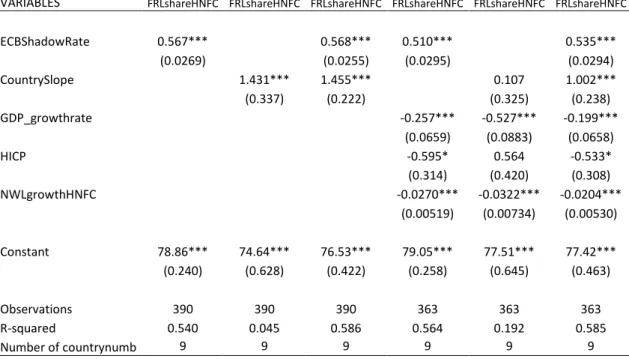
In Table III and Table IV we presented the results of the regression related with hypothesis 1. In the first table, the central variable regarding the monetary policy interest rate included is shadow rate. Analysing the results, a great significance of the variables related with the monetary policy action is observed. Those two variables, ECB shadow rate and country slope, demonstrate to have a positive and significant effect on the share of loans to households and non-financial corporations with a floating rate. The addition of the control variables does not affect the results just mentioned. The results regarding this test imply that an increase in interest rates or a steepening of the term structure tends to lead to an increase in the share of loans to households and non-financial corporations with a floating rate.
Table III - Generalized lest squared fixed effect regression results between monetary policy and the share of new loans with floating rate (including shadow rate)
(1) (2) (3) (4) (5) (6)
VARIABLES FRLshareHNFC FRLshareHNFC FRLshareHNFC FRLshareHNFC FRLshareHNFC FRLshareHNFC
ECBShadowRate 0.567*** 0.568*** 0.510*** 0.535*** (0.0269) (0.0255) (0.0295) (0.0294) CountrySlope 1.431*** 1.455*** 0.107 1.002*** (0.337) (0.222) (0.325) (0.238) GDP_growthrate -0.257*** -0.527*** -0.199*** (0.0659) (0.0883) (0.0658) HICP -0.595* 0.564 -0.533* (0.314) (0.420) (0.308) NWLgrowthHNFC -0.0270*** -0.0322*** -0.0204*** (0.00519) (0.00734) (0.00530) Constant 78.86*** 74.64*** 76.53*** 79.05*** 77.51*** 77.42*** (0.240) (0.628) (0.422) (0.258) (0.645) (0.463) Observations 390 390 390 363 363 363 R-squared 0.540 0.045 0.586 0.564 0.192 0.585 Number of countrynumb 9 9 9 9 9 9
Standard errors in parentheses *** p<0.01, ** p<0.05, * p<0.1
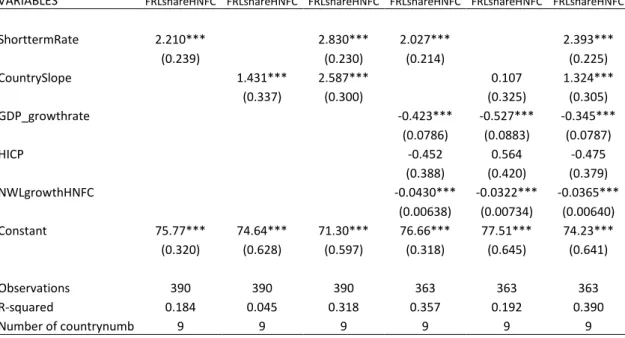
Additionally, the analysis that includes the short-term interest rate in presented in Table IV. It is found that monetary policy through the short-term rate and country slope have a positive and significant effect on the share of loans to households and non-financial corporations with a floating rate, even when these two variables are considered together a higher association is observed. Even when the country controls are included, the results do not suffer any change,
5. Empirical results
being still possible to observe a greater significance. In fact, the results are quite similar compared to the outcomes observed in Table III.
Table IV - Generalized lest squared fixed effect regression results between monetary policy and the share of new loans with floating rate (including short-term rate)
(1) (2) (3) (4) (5) (6)
VARIABLES FRLshareHNFC FRLshareHNFC FRLshareHNFC FRLshareHNFC FRLshareHNFC FRLshareHNFC
ShorttermRate 2.210*** 2.830*** 2.027*** 2.393*** (0.239) (0.230) (0.214) (0.225) CountrySlope 1.431*** 2.587*** 0.107 1.324*** (0.337) (0.300) (0.325) (0.305) GDP_growthrate -0.423*** -0.527*** -0.345*** (0.0786) (0.0883) (0.0787) HICP -0.452 0.564 -0.475 (0.388) (0.420) (0.379) NWLgrowthHNFC -0.0430*** -0.0322*** -0.0365*** (0.00638) (0.00734) (0.00640) Constant 75.77*** 74.64*** 71.30*** 76.66*** 77.51*** 74.23*** (0.320) (0.628) (0.597) (0.318) (0.645) (0.641) Observations 390 390 390 363 363 363 R-squared 0.184 0.045 0.318 0.357 0.192 0.390 Number of countrynumb 9 9 9 9 9 9
Standard errors in parentheses *** p<0.01, ** p<0.05, * p<0.1
According to the results obtained, a boost in interest rates would imply a rise of floating interest rate’s type of loans.
This outcome is consistent with the notion of the interest rate choice being affected by the unconventional monetary policy set by Central Banks and that fixed-rate loans are more attractive in a low-interest-rate policy (Moench, Vickery, and Aragon, 2010). In a low interest rate environment, households and enterprises try to grant more loans and that leads to an increase in the supply of money. Having in mind the quantity theory of money, a boost in the money supply causes higher inflation. Given that, an increase in inflation is associated with a low interest rate environment.
Therefore, this inference is also consistent with the concept that in the presence of a higher level of volatility inflation, banks protect themselves from that inflation risk through loans attached with a fixed interest rate (Campbell, 2012; Badarinza et al., 2017). So, when countries face a lower level of volatility inflation, it means that interest rates are higher, and banks are secure to provide adjustable rate loans to their borrowers.
the deposits. If banks hold more fixed-rate assets, in this variation scenario of interest rates, banks would face a maturity mismatch, and consequently a reduction in net income. To avoid that, and having in mind the risk aversion characteristic of banks, the loans with floating rates are the prime choice in terms of lending, since there is a transference of interest-rate risk from lenders to borrowers (Kirti, 2017). However, the transfer of risks from lenders to borrowers means that borrowers might be more likely to default when interest rates increase, thus increasing credit risk in the future. Banks could also use hedging activities to overcome the balance sheet mismatch but that might lead to excessive costs.
Furthermore, these results support the idea that the transmission of monetary policy is connected with the share of adjustable-rate loans in an economy (Calza, Monacelli, and Stracca, 2012; Garriga, Kydland, and Sustek, 2013).
5.2. Components of profitability
The following analysis points out the impact that the share of variable-rate loans has on the main components of profitability. The components presented are stated in percentage of total assets and are the following:
Return on assets (%ROA); Net interest income (%NII); Net non-interest income (%NNII); Provisions (%PROV).
Regarding hypothesis 2, it is also used the ECB shadow rate and the short-term interest rate in two different regressions, as part of the country control variables (Table V and Table VI, respectively).
5. Empirical results
Table V - Generalized lest squared fixed effect regression results between the share of new loans with floating rate and the main profitability components (including shadow rate)
(1) (2) (3) (4)
VARIABLES ROA NII NNII PROV
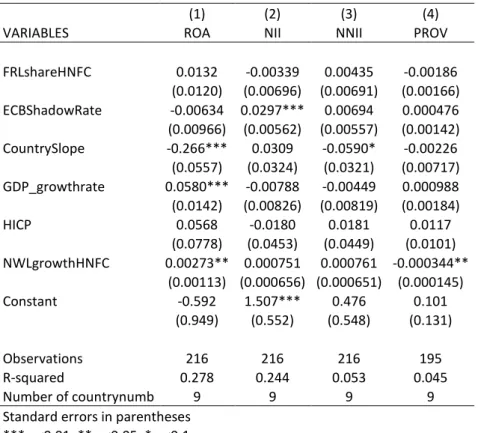
FRLshareHNFC 0.0132 -0.00339 0.00435 -0.00186 (0.0120) (0.00696) (0.00691) (0.00166) ECBShadowRate -0.00634 0.0297*** 0.00694 0.000476 (0.00966) (0.00562) (0.00557) (0.00142) CountrySlope -0.266*** 0.0309 -0.0590* -0.00226 (0.0557) (0.0324) (0.0321) (0.00717) GDP_growthrate 0.0580*** -0.00788 -0.00449 0.000988 (0.0142) (0.00826) (0.00819) (0.00184) HICP 0.0568 -0.0180 0.0181 0.0117 (0.0778) (0.0453) (0.0449) (0.0101) NWLgrowthHNFC 0.00273** 0.000751 0.000761 -0.000344** (0.00113) (0.000656) (0.000651) (0.000145) Constant -0.592 1.507*** 0.476 0.101 (0.949) (0.552) (0.548) (0.131) Observations 216 216 216 195 R-squared 0.278 0.244 0.053 0.045 Number of countrynumb 9 9 9 9
Standard errors in parentheses *** p<0.01, ** p<0.05, * p<0.1
When the ECB shadow rate is used as a control variable as well as GDP growth, expected inflation, country-specific slope and annual growth rate of new loans to households and non-financial corporations at the same time, the share of loans to households and non-non-financial corporations with a floating rate does not have significant influence on the main components of profitability (ROA, NII, NNII and PROV).
Table VI - Generalized lest squared fixed effect regression results between the share of new loans with floating rate and the main profitability components (including short-term rate)
(1) (2) (3) (4)
VARIABLES ROA NII NNII PROV
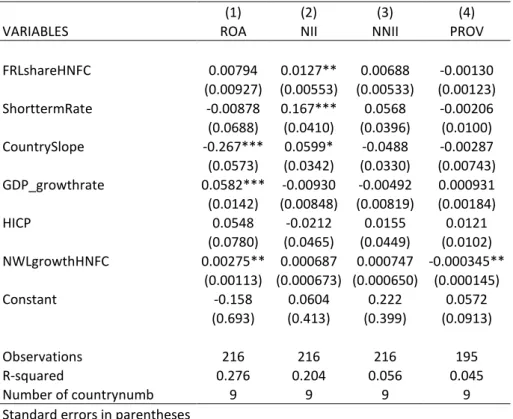
FRLshareHNFC 0.00794 0.0127** 0.00688 -0.00130 (0.00927) (0.00553) (0.00533) (0.00123) ShorttermRate -0.00878 0.167*** 0.0568 -0.00206 (0.0688) (0.0410) (0.0396) (0.0100) CountrySlope -0.267*** 0.0599* -0.0488 -0.00287 (0.0573) (0.0342) (0.0330) (0.00743) GDP_growthrate 0.0582*** -0.00930 -0.00492 0.000931 (0.0142) (0.00848) (0.00819) (0.00184) HICP 0.0548 -0.0212 0.0155 0.0121 (0.0780) (0.0465) (0.0449) (0.0102) NWLgrowthHNFC 0.00275** 0.000687 0.000747 -0.000345** (0.00113) (0.000673) (0.000650) (0.000145) Constant -0.158 0.0604 0.222 0.0572 (0.693) (0.413) (0.399) (0.0913) Observations 216 216 216 195 R-squared 0.276 0.204 0.056 0.045 Number of countrynumb 9 9 9 9
Standard errors in parentheses *** p<0.01, ** p<0.05, * p<0.1
When the short-term interest rate is considered part of the control variables, including the others mentioned above, the share of loans to households and non-financial corporations with a floating rate does not have significant influence on ROA, NNII and PROV but has a quite significant and positive effect on NII.
Different impacts in net-interest income are not conclusive. With a higher share of loans associated with a variable interest rate, it would be expected a positive sign for NII, and that is in line with the results presented in Table VI. A banks’ net interest income would increase with higher short-term interest rates, due to the increase in interest rate margins, as well as with a steeper yield curve because of the expected maturity transformation returns (Borio, Gambacorta and Hofmann, 2015). Undoubtedly, an upward level of interest rates would raise the interest payments for borrowers with variable-rate contracts and that would be traduced in more earnings for banks through interest income.
In both outcomes, we are in the presence of a poor significance for ROA, NNII and PROV. According to the results of the previous chapter, a growth in the share of variable rate loans would imply an increase in interest rates. The upper level of this rate produces different effects on these three components referred above. A general boost in profitability was the expected
5. Empirical results
outcome. However, in a higher interest rate context, more loan loss provisions are likely to be registered due to higher default probabilities of the borrowers. In fact, interest payments related with variable-rate loans rise and, with less disposable income, some consumers might fail to reimburse their loan payments. Still in this higher interest rate environment, non-interest income component would diminish as a result of the unfavourable consequence for the valuation of securities.
Nevertheless, the results on return-on-assets, non-net interest income and provisions do not demonstrate its expected strength. The main reason for the missing significance might be related to the noticeable performance of net interest income, with the share of this component relative to total revenues demonstrated an increase in the past years, and still being identified as the main component of revenues (Schildbach, 2017).
Additionally, in a variable-rate contract the interest rate risk is transferred from the lender to the borrower, but in the presence of higher interest rates, borrowers pay more on interest payments and banks need to account for loan losses as part of their provisions. The hedge of interest rate risk is done via interest rate swaps and the valuation associated is normally registered as non-interest income. Since the overall value for return on assets depend on net interest income, non-interest income and provisions, the circumstances stated in this paragraph for provisions and non-interest income are not easily capture in this analysis and that might justify the weak performance of these three components in the results.
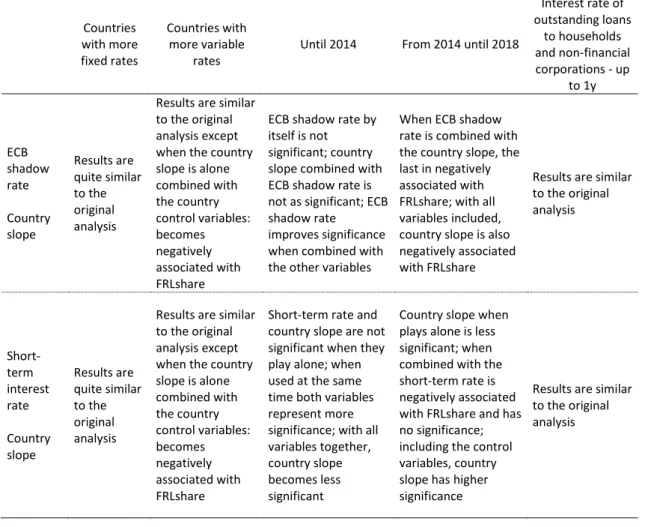
5.3. Robustness tests
We conducted a few more analysis to evaluate the previous results of this work.
First, both hypotheses were tested in countries according to their share of fixed and variables rates. That means that one of the tests focused on countries with predominantly fixed interest rates and the other one is focused on countries with predominantly variable interest rates. Second, there was an attempt to test the hypothesis referred in this work in two different time-sets: until 2014 (exclusively) and from 2014 until 2018. Finally, it was used the “interest rate up to 1 year” instead of the shadow rate or short-term level to capture the interest level related with monetary policy.
All the adjustments set are compared to the main goal of analysis disclosed in hypothesis 1 and 2. The summary of this differences are exhibited in Table VII and Table VIII, and the tables with
![Figure 3 - Variable-rate mortgages in euro area countries [Hoffmann, Langfield, Pierobon and Vuillemey (2017)]](https://thumb-eu.123doks.com/thumbv2/123dok_br/15562935.1047052/18.892.233.618.498.769/figure-variable-mortgages-countries-hoffmann-langfield-pierobon-vuillemey.webp)