UNIVERSIDADE DE ÉVORA
ESCOLA DE CIÊNCIAS E TECNOLOGIA
DEPARTAMENTO DE BIOLOGIAUNIVERSIDADE DE LISBOA
INSTITUTO SUPERIOR DE AGRONOMIA
Genetic diversity and population structure
of the sea lamprey (Petromyzon marinus L.)
across its distributional range
Catarina Sofia Pereira Mateus
Orientação: Professor Doutor Pedro Raposo de Almeida
Mestrado em Gestão e Conservação de Recursos Naturais
Dissertação
i
Acknowledgements
Gostaria de agradecer a um conjunto de pessoas e instituições que de alguma forma contribuíram para a realização deste trabalho.
Em primeiro lugar quero agradecer ao meu orientador, Professor Doutor Pedro Raposo de Almeida, pelo incentivo e entusiasmo com que me orientou durante este percurso. O seu vasto conhecimento sobre a espécie estudada nesta dissertação foi fundamental para uma discussão crítica e informada dos resultados obtidos. Obrigada por todo o apoio.
À Doutora Maria Judite Alves pelos conhecimentos partilhados na área da biologia molecular, e por me abrir sempre as portas do laboratório de genética do Museu Nacional de História Natural e da Ciência, onde a parte laboratorial da presente tese foi realizada. Obrigada pela simpatia de sempre.
Ao Bernardo Quintella pelos preciosos conselhos e pela constante disponibilidade para me ajudar. Obrigada por todas as ideias, sugestões e conversas sobre esta espécie que também te cativou desde sempre.
Ao Carlos Alexandre pela presença de sempre, e pela pronta disponibilidade que tem para com todos os elementos da equipa. Obrigada por me ouvires, especialmente agora que a minha secretária fica mesmo em frente à tua - por vezes não tens outro remédio. Acontece frequentemente eu entrar pelo gabinete a refilar com alguma coisa, e tu com a tua ponderação e calma relativizares aquilo que me está a perturbar. Obrigada pela paciência.
À Natacha Mesquita pela partilha do seu conhecimento do mundo da biologia molecular, e pela calma e confiança que me transmite.
À Sílvia Pedro pela amizade e cumplicidade, bem como pelas conversas sobre os mais variados temas.
À Ana Filipa Belo e à Esmeralda Pereira pela disponibilidade para ajudar nas mais variadas circunstâncias, mesmo quando os prazos apertam. Obrigada pelo espírito de equipa que conseguem sempre manter.
À Marta Lourenço pela ajuda nas fases iniciais do trabalho de laboratório, e pela boa disposição que trouxeste ao laboratório.
ii
À Maria Drago pela amizade e companhia, e pela paciência e palavras de encorajamento nos momentos de maior desânimo. Agradeço também a preciosa ajuda no laboratório.
À Alexandra Cartaxana, Alexandra Marçal, Diana Carvalho, Filipe Lopes, Paulo Marques e Cristiane Bastos Silveira do MUHNAC pela companhia e energia positiva.
À Mafalda Mascarenhas, Elsa Cabral, Gilda Silva, João Paulo Medeiros e Erica Sá do MARE-Centro de Ciências do Mar e do Ambiente pela amizade e boa disposição. À Professora Maria Manuela Coelho por me ter facilitado o acesso ao seu laboratório e
o uso do sequenciador para otimização dos microssatélites.
Aos Pescadores Profissionais aos quais foram adquiridas as amostras de Portugal. Ao Rolando Rodríguez-Muñoz pela aquisição das autorizações para a amostragem nas
Astúrias, e pela ajuda no trabalho de campo.
A todos os investigadores que forneceram amostras para este trabalho: Maria C. Rodicio, Mario Lepage, Jonas Andersson e Weiming Li.
À minha FAMÍLIA, por tudo! Aos meus pais, aos meus tios, ao meu avô, aos meus irmãos, e aos meus cunhados. Estão sempre aqui, muito obrigada a todos!
Para agradecer ao HUGO não chegariam as páginas desta dissertação. Obrigada pela compreensão, pela calma, por estares sempre aqui. Obrigada por aceitares os sacrifícios e desafios que a vida académica nos impõe, e por os tornares mais leves e fáceis de superar.
iii
Institutional acknowledgements
Ao MARE - Centro de Ciências do Mar e do Ambiente e ao respetivo Coordenador, Professor Doutor Henrique Cabral, pela disponibilização de todo o apoio logístico necessário à realização desta dissertação. Agradeço em particular ao Pólo MARE-Universidade de Évora e ao respetivo Coordenador, Professor Doutor Pedro Raposo de Almeida, pela integração no grupo.
Ao Ce3C - Centro de Ecologia, Evolução e Alterações Ambientais e respetiva Coordenadora, Professora Doutora Margarida Santos-Reis por me ter integrado na sua equipa.
Ao MUHNAC - Museu Nacional de História Natural e da Ciência por ter criado as condições para que pudesse desenvolver a parte laboratorial deste trabalho. Ao Governo Regional das Astúrias, Consejería del Medio Ambiente, Ordenación del
Territorio e Infraestructuras, por ter fornecido autorização para as amostragens
iv
Índice
Table of contents
ABSTRACT v RESUMO vi 1. INTRODUCTION 11.1. THE SEA LAMPREY 1
1.2.SITE SELECTION, POPULATION STRUCTURE AND STOCK IDENTIFICATION 3
1.3. OBJECTIVES 5
2. MATERIAL AND METHODS 6
2.1.SAMPLING AND DNA EXTRACTION 6
2.2.MICROSATELLITE AMPLIFICATION, GENOTYPING AND FRAGMENT SIZE DETERMINATION 7
2.3.DATA ANALYSIS 8
3. RESULTS 10
4. DISCUSSION 19
4.1.DISPERSAL AT SEA, SITE SELECTION AND EVOLUTIONARY IMPLICATIONS 19
4.2.IMPLICATIONS FOR CONSERVATION 22
v
LAMPREY
(PETROMYZON
MARINUS
L.)
ACROSS
ITS
DISTRIBUTIONAL RANGE
Abstract
Lampreys are a group of ancient vertebrates with 360 million years of existence. Throughout their evolution, they have acquired local adaptations to the colonized habitats, showing high plasticity and adaptive capacities. The sea lamprey (Petromyzon
marinus L.) is a parasitic and anadromous species that occurs in both sides of the North
Atlantic. The aims of this study were to analyse, using microsatellite markers, the genetic diversity and population structure of sea lamprey throughout its distributional range. Analyses demonstrated consistent signs of high population differentiation between European and North American samples (two-groups structure), most probably due to isolation by distance, but low differentiation among populations from the same coast. The apparent lack of homing in this species is in line with its high evolutive success, as homing may bring adults back to natal habitats that have changed, or that are intermittently unfavourable. Analyses also demonstrated higher levels of genetic diversity in North American samples.
Keywords: Anadromy, fisheries management, homing, microsatellite loci, population
vi
DIVERSIDADE GENÉTICA E ESTRUTURA POPULACIONAL DA
LAMPREIA-MARINHA (PETROMYZON MARINUS L.) AO LONGO
DA SUA ÁREA DE DISTRIBUIÇÃO
Resumo
As lampreias são organismos ancestrais com cerca de 360 milhões de anos de existência. No decorrer da longa escala evolutiva têm vindo a adquirir adaptações aos locais que colonizaram, tendo uma forte capacidade evolutiva e adaptativa. A lampreia-marinha (Petromyzon marinus L.) é uma espécie parasita e anádroma que ocorre em ambas as costas do Atlântico Norte. Este estudo teve como principal objetivo estudar a diversidade genética e a estrutura populacional desta espécie ao longo da sua área de distribuição, através do uso de microssatélites. Os resultados demonstraram forte divergência entre populações das costas Este e Oeste do Atlântico Norte, provavelmente devido à elevada distância entre populações, mas pouca diferenciação entre populações da mesma costa. A ausência de homing nesta espécie terá contribuído para o seu sucesso evolutivo, uma vez que o homing pode levar indivíduos a reproduzirem-se em habitats que se tornaram desfavoráveis ou intermitentemente inapropriados. Os resultados demonstraram também uma maior variabilidade genética nas populações americanas.
Palavras-chave: Anadromia, estrutura populacional, gestão pesqueira, homing, lampreia-marinha, microssatélites
1
1. Introduction
1.1. The sea lampreyThe sea lamprey (Petromyzon marinus L., 1758) is a parasitic and anadromous species that occur at both sides of the North Atlantic. As anadromous, they migrate to freshwater for spawning, and the life cycle is divided in two distinct phases: an adult marine phase of parasitic feeding and a freshwater larval phase (Fig. 1).The larval stage is spent entirely in fresh water and is the longest period, lasting for 2-8 years (Hardisty & Huggins 1970; Beamish & Potter 1975; Morkert et al. 1998; Quintella et al. 2003), depending on the location and the environmental conditions. During this period, the lamprey larvae (usually called ammocoetes) live burrowed in fine sediment deposits of rivers and streams, and are filter feeders, feeding on organic detritus and microorganisms, especially diatoms (Hardisty & Potter 1971a; Moore & Mallatt 1980). After this period, larvae undergo a metamorphosis, with drastic remodelling of the cephalic region and of the digestive apparatus. In the majority of Northern Hemisphere lamprey species, the main external changes associated with metamorphosis are initiated from mid-July to September (Hardisty & Potter 1971b). After metamorphosis, juveniles initiate a downstream migration to salt water, where they feed parasitically for 1.5 to 2.5 years, especially on bony fish (e.g. Silva et al. 2013). Adults return to rivers for reproduction, where they become sexually mature, and build nests, a depression in the bed of the stream which construction is initiated by the males, with later involvement of the females. Lampreys are semelparous, dying after spawning.
A landlocked form of the sea lamprey, considered a pest, can be found in the Laurentian Great Lakes region, in North America. The sea lamprey was firmly established in all of the Great Lakes by the late 1940’s and causes extraordinary damage to the fish stocks, posing serious threats to fisheries (Pearce et al. 1980;Smith & Tibbles 1980). In this sense, studies on sea lamprey in each side of the Atlantic are generally quite distinct, with European studies directed to conservation and American studies to eradication methods. No landlocked form has been reported for Europe (Kottelat & Freyhof 2007).
Though still widely distributed, the sea lamprey is now considered an endangered or rare species in some parts of its range, being the subject of important commercial
INTRODUCTION
2
fisheries during their upstream spawning migration in parts of Spain, Portugal and France. In Portugal, it can be found in all the main river basins, being more abundant in the North and Central regions of the country (Mateus et al. 2012). Fishing activity concentrates in these regions, mainly Minho and Mondego, but also Lima, Cávado, Vouga and Tagus, as well as a more reduced fishery in the river Guadiana in the south (Almeida et al. 2002; Stratoudakis et al. 2016). Fishing takes place during the anadromous movement of pre-spawners from January to April, when licensed fishing for this resource constitutes one of the main activities of many hundreds of artisanal fishers (Stratoudakis et al. 2016). The sea lamprey is classified as Vulnerable according to the Portuguese Red List of Threatened Vertebrates (Cabral et al. 2005).
Figure 1. The anadromous life cycle of the sea lamprey, Petromyzon marinus.
3
1.2. Site selection, population structure and stock identification
Anadromy occurs in c. 1 per cent of the known species of fish, but subsists as a life-history strategy quite widely across the diversity of fishes, and is widely accepted as a trait with adaptive and selective advantages, that has evolved multiple times (McDowall 2001a,b). The evolution of anadromy has provided fish with the opportunity for more rapid growth, larger size, and higher fecundity through access to richer food resources, but may result in greater mortalities resulting from predation during migration and when at sea, involves more costs related to osmoregulatory demands when shifting between fresh and salt waters, and has the tendency to disperse stocks very widely (reviewed in McDowall 2001a). Anadromy and homing are often suggested to have coevolved.Homing in anadromous fishes allows the development of local stocks adapted to local conditions (McDowall 2001a,b). Where there is precise homing of the returning fish, gene flow among populations will be much reduced, enhancing genetic differentiation among populations, and thus within-species diversity (McDowall 2001b). Homing, however, may bring adults back to natal habitats that have changed, or that are intermittently unfavourable, condemning most of their progeny (McDowall 2001a; Cury 1994).
Lampreys apparently do not show homing behaviour (Bergstedt & Seelye 1995; Waldman et al. 2008). Most molecular studies that have been developed with European and North American populations of sea lamprey are based on mitochondrial markers (e.g. Rodríguez-Muñoz et al. 2004; Waldman et al. 2008), and all demonstrate a lack of fixed differences among populations of the same coast (suggesting lack of homing), but an absence of shared haplotypes between coasts.
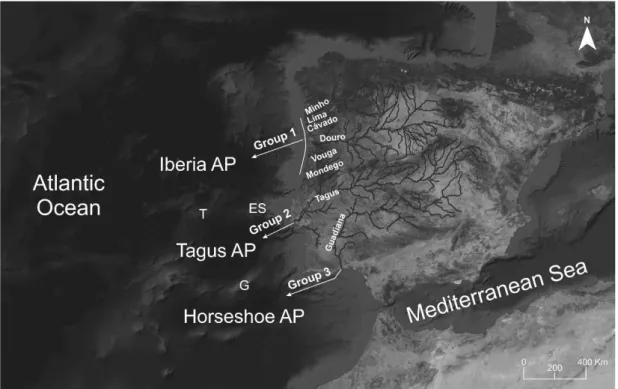
Lança et al. (2014) used morphological characters and heart tissue fatty acid signature to analyse the existence of a stock structure on sea lamprey populations sampled in the major Portuguese river basins. The authors suggest the existence of three different sea lamprey stocks in Portugal, namely North/Central group, Tagus group, and Guadiana group, possibly promoted by seabed topography isolation during the oceanic phase of the life cycle (Fig. 2). According to the authors, detected differences are probably related with environmental variables to which lampreys may have been exposed. A stock can be defined as a population or portion of a population of which all
INTRODUCTION
4
members are characterized by similarities which are not heritable, but are induced by the environment, and which include members of several different subpopulations (Marr 1957). The identification of stocks is fundamental for both fisheries and endangered species management, as individuals from a given stock are adapted to the environment where they live, and therefore must be managed according to the specific characteristics of the stock.
Figure 2. Sea lamprey groups suggested by Lança et al. (2014), probably associated to the three isolated
abyssal plains (and/or nearby continental slopes) off western Iberian Peninsula, detected by analysis of morphological characters and heart tissue fatty acid signature. Physiographic features of the west Iberia Margin are presented, as well as the seamounts and canyons that contour the three abyssal plains. Iberia AP - Iberia Abyssal Plain; Tagus AP - Tagus Abyssal Plain; Horseshoe AP - Horseshoe Abyssal Plain. T – Tore Seamount; ES – Estremadura Spur; G – Gorringe Bank. Adapted from Lança et al. (2014).
For the sea lamprey, the absence of genetic differentiation along the European Atlantic coast and the existence of distinct stocks, would imply that the oceanic phase of the life cycle is composed by a dispersion period during the juvenile migration, followed by a much less mobile adult stage, which would restrict the mixture of adult lampreys from different geographical groups. However, genetic differentiation of European populations of sea lampreys has been accessed only with mitochondrial DNA, which is especially useful to investigate historic patterns of reproductive isolation and colonization. Markers such as microsatellites, which are highly polymorphic and
5
have high mutation rates, reveal more contemporary patterns of interactions among populations, making them especially useful for the study of fine-scale population structure and capable of detecting differences among closely related populations, not revealed by the mitochondrial DNA (O’Connell & Wright 1997).
1.3. Objectives
The aims of this study are to analyse, using microsatellite markers, the genetic diversity and population structure of sea lamprey from both sides of North Atlantic, and to give new insights on the stock structure identified in Portugal, most likely promoted by geographical segregation during the oceanic parasitic phase of the life cycle.
To accomplish these objectives, the following specific tasks were established: a) Measure and compare the genetic diversity of P. marinus populations across its
distributional range;
b) Analyze the genetic differentiation among populations of P. marinus, to infer the dispersal patterns and site fidelity of the species;
c) Analyze if the geographical groups previously identified through morphological characters and heart tissue fatty acid signature are genetically distinct.
Ultimately, this study is intended to contribute for an informed management of fisheries and application of conservation measures, especially in areas where the species is considered endangered or rare.
MATERIAL AND METHODS
6
2. Material and Methods
2.1. Sampling and DNA extractionFor the majority of sites, samples were collected from commercial lamprey catches or during monitoring studies. In two sites (rivers Eo and Sella, Asturias, Spain) specimens were collected by electro fishing. Lampreys collected by electro fishing were anaesthetized by immersion in 2-phenoxyethanol (0.3 ml L-1), a piece of tissue was
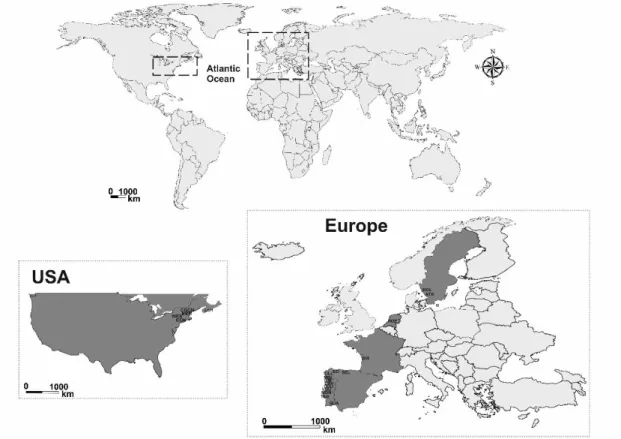
removed from the dorsal fin, and after recovery individuals were released near the capturing sites. All tissue samples were preserved in alcohol pro-analyses. A total of 20 sites were sampled, two from Sweden, one from the Netherlands, eight from Portugal, three from Spain, one from France and five from the west Atlantic North American coast (Fig. 3; Table 1).
Total genomic DNA was extracted following a standard SDS-proteinase K/phenol–chloroform protocol and stored at -20ºC. DNA concentration was measured using a Thermo Scientific NanoDrop™ 1000 Spectrophotometer and standardized to 50 ng μl-1 per sample.
Figure 3. Sampling sites from the west Atlantic North American coast and the east Atlantic coast
7
Table 1. Sampled localities, including site label as in Figure 3 and number of samples.
Site label
Country River N Provided by
ROL Sweden Rolfsan 26 Micael Söderman
ATR Sweden Atran 26 Jonas Andersson
ROE The Netherlands Roer 8 Rob Gubbels
GIR France Gironde 19 Mario Lepage
SEL Spain Sella 50 This study
EO Spain Eo 49 This study
ULL Spain Ulla 50 Maria C. Rodicio
MIN Portugal Minho 49 This study
LIM Portugal Lima 50 This study
CAV Portugal Cávado 44 This study
DOU Portugal Douro 50 This study
VOU Portugal Vouga 28 This study
MON Portugal Mondego 38 This study
TEJ Portugal Tagus 44 This study
GUA Portugal Guadiana 28 This study
LaH USA LaHave 40 Weiming Li
COCH USA Cocheco 28 Weiming Li
MER USA Merrimack 35 Weiming Li
WES USA Westfield 22 Weiming Li
CON USA Connecticut 18 Weiming Li
2.2. Microsatellite amplification, genotyping and fragment size determination
A total of 702 specimens of P. marinus from 20 sites were used in the analysis (Fig. 3 and Table 1). Initially, the following 19 microsatellite primer sets developed for P.
marinus and other lamprey species were screened using the described protocols and
further optimized: Pmaμ 2, Pmaμ 3, Pmaμ 4, Pmaμ 5, Pmaμ 7, Pmaμ 8 and Pmaμ 9 developed for P. marinus (Bryan et al. 2003; Filcek et al. 2005); Lspn 005, Lspn 013, Lspn 021b, Lspn 044, Lspn 050, Lspn 094, developed for Lethenteron sp. N (Takeshima et al. 2005); Iun 2, Iun 4, Iun 5, Iun 6, Iun 7 and Iun 13 developed for Ichthyomyzon unicuspis and I. fossor (McFarlane & Docker 2009). Twelve primer sets produced unambiguously determined bands and were polymorphic: Pmaμ 2, Pmaμ 3, Pmaμ 4, Pmaμ 5, Pmaμ 7, Pmaμ 8, Iun 2, Iun 5, Iun 6, Lspn 044, Lspn 050 and Lspn 094. These 12 loci were used for analysis and all others were rejected. The reverse primers were 5’-labelled with 6-FAM, NED, PET or VIC (Applied Biosystems®) fluorescent dyes. Microsatellite loci were
MATERIAL AND METHODS
8
containing 2 µL of 50 ng μl-1 genomic DNA, 1.0 to 3.0 mM MgCl
2, 0.2 mM dNTP mix, 0.5
µM for each primer, 1 unit of DreamTaq™ DNA Polymerase (Fermentas) and 1× DreamTaq™ Buffer. PCR conditions were as follows: initial denaturation at 94 °C for 1 min, followed by 23 to 25 cycles of 30 sec at 94 °C, annealing for 30 sec at temperatures ranging from 57 to 60 °C and 30 sec at 72 °C, and a final extension of 7 min at 72 °C. For some loci of difficult amplification, a Multiplex PCR Kit (Qiagen®) was used, with 5 µl
Qiagen Multiplex PCR master Mix, 3 µl RNase-free water, 1 µl Primer Mix (2 µM each primer) and 1 µl of 50 ng μl-1 of genomic DNA, using the following protocol: initial
activation step at 95 °C for 15 min, followed by 30 cycles of denaturation at 94 °C for 30 sec, annealing at 57 °C for 90 sec and extension at 72 °C for 60 sec, and a final extension of 30 min at 60 °C. The PCR reactions were conducted on a Bio-Rad® thermal cycler.
Samples were genotyped in an ABI PRISM® 310 Genetic Analyzer and fragments
were sized with GeneScan™-500 LIZ™ Size Standard. Allele sizes were visually determined using the software GeneMapper® 3.7 (Applied Biosystems®).
2.3. Data analysis
Microsatellite loci were tested for null alleles, large allele dropout and stuttering using MICROCHECKER 2.2.3 (van Oosterhout et al. 2004), and visually examined for correction. Genetic diversity was measured through observed heterozygosity (Ho), and unbiased expected heterozygosity (He, sensu Nei 1978), inferred using GENETIX 4.05.2 (Belkhir et al. 1996), and the mean allelic richness (AR), which was calculated and corrected for sample dimension by rarefaction using HP-Rare (Kalinowski et al. 2005).
Differentiation among populations was determined using the software GENETIX through pairwise FST, using the Weir & Cockerham's estimator (Weir & Cockerham
1984). Significance was assessed with 10,000 permutations.
The distribution of genetic variation was accessed through locus-by-locus analysis of molecular variance (AMOVA) (Excoffier et al. 1992). This analysis accomplishes three components of genetic variation: among groups (FCT), among
9
performed in ARLEQUIN 3.5.2.2 (Excoffier et al. 2005), using the allelic frequencies as the genetic distance and 20,000 permutations.
Patterns of differentiation were visualized by principal coordinates analysis (PCoA). This analysis was computed using GenAlEx 6.5 (Peakall & Smouse 2006,2012).
Population clustering was analyzed using the Bayesian model-based clustering approach implemented in STRUCTURE 2.3.4 (Pritchard et al. 2000; Falush et al. 2003). Runs were performed under the admixture model, with correlated allelic frequencies. STRUCTURE runs were performed for a number of groups (K) set between 1 and 20, with 10 replicates of each K, with an initial burn-in of 100,000 MCMC (Markov Chain Monte Carlo) generations, followed by 1,000,000 MCMC steps.
The most likely number of clusters in each dataset was inferred using a combination of two metrics: changes in LnP(D), the probability of the data given K, for consecutive K (when several values of K give similar estimates of LnP(D), the smallest of these is often the correct K, i.e., when values plateau), as suggested by Pritchard et al. (2010), and the protocol developed by Evanno et al. (2005), both obtained using STRUCTURE HARVESTER 0.6.94 (Earl & VonHoldt 2012).
RESULTS
10
3. Results
The total number of alleles per locus across populations varied from 1 to 15. Eight private alleles (alleles found in a single population) were found: one in E0, one in MIN, two in LaH, two in COCH, one in MER and one in WES, and the mean allelic richness (AR) per locus ranged from 1.00 to 7.4109. The summary statistics of the genetic diversity indices for each locus and sample are provided in Table 2.
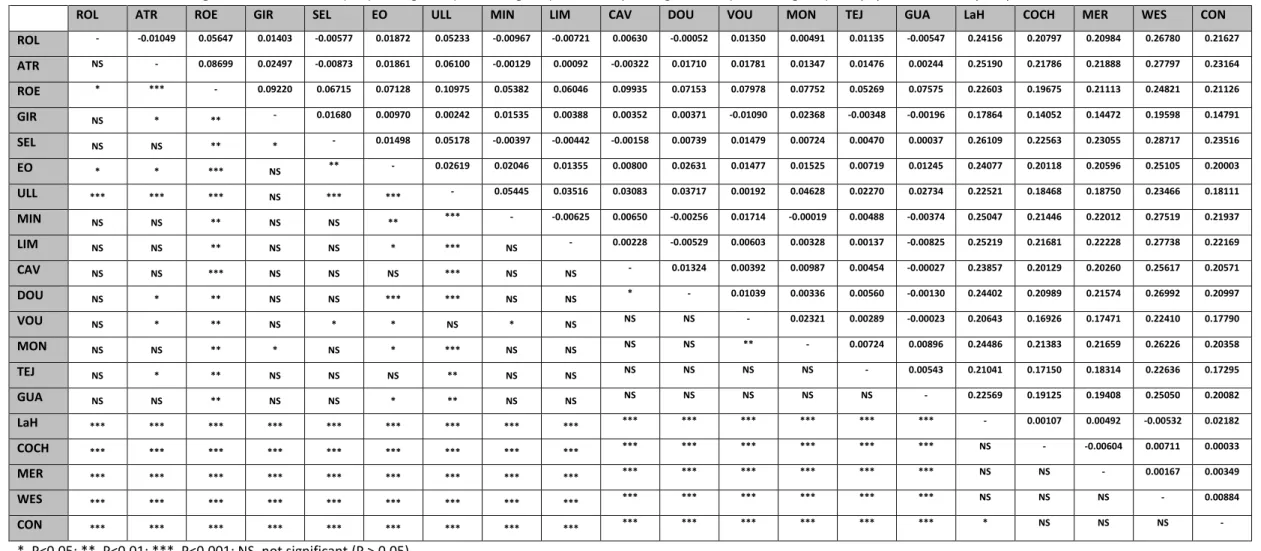
FST values between sites ranged from -0,0109 (between VOUG, Portugal and GIR,
France) to 0,28717 (between SELL, Spain and WES, USA; Table 3), with a global FST of
0.10508. A total of 120 of the 190 FST values (63%) were statistically significant, however,
many values were low, with the exception of comparisons between European and North American samples, which accounted for 62.5% of the total significant pairwise comparisons, and all being significant at the 0.1% level (P<0.001).
Genetic structure analyses were consistent with these findings, as STRUCTURE analyses demonstrated consistent signs of high population differentiation between European and North American samples (two-groups structure), but low differentiation among populations from the same coast (Fig. 4). The most likely number of clusters in each dataset was computed using a combination of estimated LnP(D) values and ΔK of the Evanno method, and indicate that the most consistent structure attained for the entire dataset is a group in each side of the North Atlantic (Fig. 4A). Pritchard et al. (2010), suggested that when one have a situation with two clear populations, and is trying to decide whether one (or both) of these is further subdivided, then one can run STRUCTURE using subsets of populations that might be subdivided. Following this, three additional runs of STRUCTURE were performed: one including the 15 European populations (Fig. 4B); another including the five North American populations (Fig. 4C); and another (Fig. 4D) with the eight populations from Portugal, to test the hypothesis of regional differentiation suggested by Lança et al. (2014). This allows detection of further structure in these populations, if present, that otherwise would be hidden due to the high differentiation between the European and North American samples. Results from these analyses revealed, however, the same groups, with further differentiation only
11
within samples, i.e, there is no further structure among populations from the same coast, or among samples from Portugal.
The principal coordinates analysis (PCoA), also revealed the existence of mainly two groups, the same detected by STRUCTURE (European and North American samples; Fig. 5).
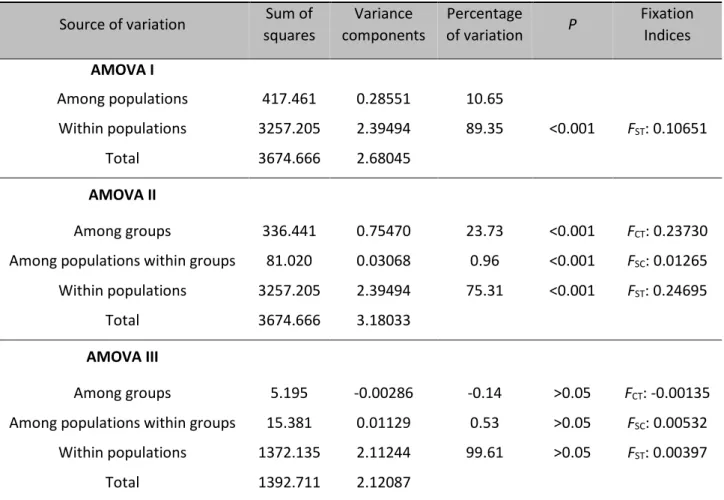
These results were in agreement with the analysis of molecular variance (AMOVA), which revealed low genetic variation among sea lamprey sites (10.7%; AMOVA I; Table 4) with variation within populations accounting for 89.3% of the total variation. When comparing the European and American samples, according to the results attained with PCoA and STRUCTURE (AMOVA II), variation between coast accounts for 23.7% of the total variation, and within populations variation is 75.3% of the total. In AMOVA III, where Portuguese populations were grouped according to the 3-stock structure suggested by Lança et al. (2014), virtually all variation, almost 100%, occurred within populations (99.6%; Table 4).
RESULTS
12
Table 2. Measures of genetic diversity assayed at twelve microsatellite DNA loci for each sampled location. Sample acronyms correspond to locations as in Table 1. Sample size (n), number of
alleles per locus (Na) with number of private alleles in parentheses, mean allelic richness (AR), unbiased expected heterozygosity (He), observed heterozygosity (Ho).
ROL ATR ROE GIR SEL EO ULL MIN LIM CAV DOU VOU MON TEJ GUA LaH COCH MER WES CON
n=26 n=26 n=8 n=19 n=50 n=49 n=50 n=49 n=50 n=44 n=50 n=28 n=38 n=44 n=28 n=40 n=28 n=35 n=22 n=18 Locus Pmaμ 2 AlRan 96-100 98-100 100 96-100 98-100 98-100 94-100 94-100 98-100 98-100 98-100 94-100 98-100 96-100 3 94-100 94-100 94-100 94-100 94-100 94-100 Na 3 2 1 3 2 2 3 3 2 2 2 4 2 3 3 4 4 4 4 4 AR 2.1925 1.9257 1 2.3528 1.9705 1.973 2.1317 2.1124 1.9878 1.9915 1.9987 2.4366 1.9955 2.1336 2.1945 2.7159 3.3925 2.8791 3.2504 2.6661 He 0.3703 0.2919 - 0.5401 0.3685 0.3737 0.4941 0.4198 0.4160 0.4303 0.4848 0.4759 0.4507 0.4825 0.4084 0.5753 0.6526 0.5975 0.6311 0.5540 Ho 0.1154 0.0385 - 0.2353 0.0000 0.0000 0.3778 0.0638 0.2200 0.0682 0.1600 0.3333 0.1111 0.1364 0.0714 0.3750 0.4643 0.3235 0.3636 0.2222 Iun 2 AlRan 114-117 111-117 114-117 114-117 111-117 111-117 111-117 114-117 114-117 114-117 111-117 114-120 111-117 114-120 114-120 105-117 114-117 105-120 114-117 114-117 Na 2 3 2 2 3 3 3 2 2 2 3 3 3 3 3 3 2 4 2 2 AR 1.9847 2.1925 2 1.9995 2.1054 2.1989 2.1295 1.9921 1.9931 1.9608 2.1143 2.2128 2.1868 2.1367 2.3809 2.3041 1.9971 2.3869 2 1.9998 He 0.3927 0.3703 0.5250 0.4908 0.4216 0.3936 0.4543 0.4342 0.4396 0.3483 0.4600 0.4994 0.3130 0.4813 0.4909 0.4538 0.4580 0.5394 0.5127 0.4966 Ho 0.1200 0.3077 0.6250 0.5789 0.4800 0.3469 0.4773 0.2500 0.4000 0.3023 0.3600 0.3929 0.2632 0.4419 0.4286 0.1143 0.2800 0.2903 0.2778 0.1333 Iun 5 AlRan 250-274 250-277 250-274 250-274 250-277 250-286 250-286 250-274 250-286 250-277 250-277 250-286 250-277 250-286 250-274 253-298 250-289 250-289 247-289 253-292 Na 4 6 3 4 5 6 5 4 6 5 5 6 5 7 4 15(1) 13 14 10(1) 10 AR 3.3837 3.569 2.8571 3.3545 3.2542 3.571 3.0558 3.3627 3.3625 3.3989 3.3107 3.5874 3.1439 3.3768 3.0914 7.054 7.4109 6.6272 5.8878 7.0938 He 0.5407 0.5566 0.6044 0.5619 0.5824 0.6181 0.4932 0.5998 0.5574 0.6053 0.5354 0.4987 0.5747 0.5909 0.5721 0.8761 0.8994 0.8644 0.8150 0.8966 Ho 0.5769 0.4615 1.0000 0.6316 0.6000 0.6531 0.4318 0.5625 0.4800 0.5909 0.6400 0.5000 0.7105 0.4773 0.5714 0.8684 0.7500 0.8667 0.7727 1.0000 Iun 6 AlRan 124-130 124-130 127 124-127 121-130 121-130 124-130 124-130 124-127 124-130 121-130 124-127 124-130 124-130 124-130 121-133 124-136 121-133 124-130 121-130 Na 3 3 1 2 4 4 3 3 2 3 4 2 3 3 3 5 5(1) 5 3 4
13
Table 2. (Continued) Measures of genetic diversity assayed at twelve microsatellite DNA loci for each sampled location. Sample acronyms correspond to locations as in Table 1. Sample size (n), number of alleles per locus (Na) with number of private alleles in parentheses, mean allelic richness (AR), unbiased expected heterozygosity (He), observed heterozygosity (Ho).
AR 2.425 2.2306 1 1.9999 2.2389 2.6358 2.3197 2.1313 1.9989 2.2552 2.3446 1.9999 2.4007 2.1295 2.2141 3.6033 3.372 3.730 2.9344 3.2891 He 0.5282 0.5271 0.0000 0.5121 0.5119 0.5157 0.5158 0.4891 0.4887 0.5277 0.5121 0.5084 0.4895 0.4543 0.5266 0.7043 0.6701 0.7002 0.5973 0.5793 Ho 0.3600 0.5769 0.0000 0.5263 0.5000 0.5306 0.5400 0.5111 0.4200 0.5455 0.5000 0.7500 0.5000 0.4318 0.4643 0.6286 0.3929 0.6061 0.6364 0.4667 Pmaμ 5 AlRan 131-137 131-137 131-137 131-137 131-137 131-137 131-137 131-137 131-137 131-137 131-137 131-137 131-137 131-137 131-137 125-139 125-137 131-137 125-139 125-139 Na 2 2 2 2 2 3 2 2 2 2 2 2 2 2 2 5 4 3 5 6 AR 1.9996 1.9997 2 1.9999 1.9997 2.2293 1.9994 1.9997 1.9997 1.9998 1.9997 1.9998 1.9993 1.9998 1.9996 3.7415 3.1567 2.9236 4.0623 4.6604 He 0.4977 0.5030 0.5333 0.5078 0.5042 0.5041 0.4978 0.5045 0.5032 0.5055 0.5042 0.5065 0.4940 0.5055 0.4987 0.7060 0.6344 0.5967 0.7433 0.7504 Ho 0.5385 0.5769 1.0000 0.4737 0.6400 0.4490 0.4800 0.6087 0.6200 0.4318 0.5200 0.3571 0.4737 0.5682 0.7143 0.4872 0.6786 0.5625 0.6190 0.4706 Lspn050 AlRan 134-152 134-152 134-152 134-152 134-152 134-152 134-152 134-152 134-152 134-152 134-152 134-152 134-152 134-152 134-152 134-154 134-154 134-156 134-154 134-152 Na 2 2 2 2 2 3(1) 2 2 2 2 2 2 2 2 2 4 4 5(1) 4 3 AR 1.9997 1.9999 2 1.9998 1.9996 2.2283 1.9997 1.9982 1.9989 1.9998 1.9962 1.9999 1.9961 1.9998 1.9996 2.8039 2.7337 2.9796 2.7224 2.8398 He 0.5029 0.5098 0.5000 0.5007 0.5018 0.4948 0.5042 0.4787 0.4887 0.5055 0.4596 0.5084 0.4561 0.5055 0.4987 0.5344 0.4494 0.4693 0.4598 0.5865 Ho 0.4800 0.5385 0.7500 0.5263 0.4800 0.4082 0.5200 0.3542 0.4200 0.5227 0.5400 0.4643 0.4211 0.3864 0.5714 0.4737 0.3929 0.5000 0.4091 0.5882 Pmaμ 7 AlRan 113 113 113 111-113 113 113 113 113 113 113 113 113 111-113 111-113 113 111-113 111-113 111-113 111-113 111-113 Na 1 1 1 2 1 1 1 1 1 1 1 1 2 2 1 2 2 2 2 2 AR 1 1 1 1.3158 1 1 1 1 1 1 1 1 1.2926 1.7506 1 1.9998 1.9952 1.9886 1.9998 1.9923 He 0.0000 0.0000 0.0000 0.0526 0.0000 0.0000 0.0000 0.0000 0.0000 0.0000 0.0000 0.0000 0.0519 0.1857 0.0000 0.5051 0.4442 0.4141 0.5021 0.4127 Ho 0.0000 0.0000 0.0000 0.0526 0.0000 0.0000 0.0000 0.0000 0.0000 0.0000 0.0000 0.0000 0.0526 0.2045 0.0000 0.2000 0.2143 0.1143 0.1364 0.2222 Lspn094 AlRan 156 156 156 156 156 156 156 156 156 154-156 156 156 156 156 156 154-156 154-156 154-156 154-156 154-156 Na 1 1 1 1 1 1 1 1 1 2 1 1 1 1 1 2 2 2 2 2 AR 1 1 1 1 1 1 1 1 1 1.2555 1 1 1 1 1 1.9991 1.9622 1.9851 1.9998 1.8873 He 0.0000 0.0000 0.0000 0.0000 0.0000 0.0000 0.0000 0.0000 0.0000 0.0449 0.0000 0.0000 0.0000 0.0000 0.0000 0.4902 0.3429 0.4012 0.5017 0.2460 Ho 0.0000 0.0000 0.0000 0.0000 0.0000 0.0000 0.0000 0.0000 0.0000 0.0000 0.0000 0.0000 0.0000 0.0000 0.0000 0.0000 0.0000 0.0286 0.0000 0.0556
RESULTS
14
Table 2. (Continued) Measures of genetic diversity assayed at twelve microsatellite DNA loci for each sampled location. Sample acronyms correspond to locations as in Table 1. Sample size (n), number of alleles per locus (Na) with number of private alleles in parentheses, mean allelic richness (AR), unbiased expected heterozygosity (He), observed heterozygosity (Ho).
Pmaμ 4 AlRan 157 157 157 155-157 157 157 155-157 157 155-157 157 155-157 155-157 155-157 157 157 157-163 155-161 155-163 157-161 157-161 Na 1 1 1 2 1 1 2 1 2 1 2 2 2 1 1 4 4 5 3 3 AR 1 1 1 1.5377 1 1 1.4053 1 1.12 1 1.12 1.2143 1.4073 1 1 3.0144 2.8646 3.332 2.9012 2.5597 He 0.0000 0.0000 0.0000 0.1024 0.0000 0.0000 0.0776 0.0000 0.0200 0.0000 0.0200 0.0357 0.0768 0.0000 0.0000 0.6297 0.5639 0.6457 0.6308 0.5270 Ho 0.0000 0.0000 0.0000 0.1053 0.0000 0.0000 0.0800 0.0000 0.0200 0.0000 0.0200 0.0357 0.0789 0.0000 0.0000 0.4615 0.3704 0.4545 0.4000 0.3333 Pmaμ 8 AlRan 164 164 162-164 162-164 162-164 162-164 162-164 162-164 162-164 162-164 162-164 162-164 162-164 162-164 162-164 160-164 156-164 156-164 160-164 160-164 Na 1 1 2 2 2 2 2 2 2 2 2 2 2 2 2 3 5 4 3 3 AR 1 1 1,75 1.9808 1.2267 1.9618 1.9998 1.2355 1.6546 1.8728 1.6546 1.993 1.7653 1.9105 1.8752 2.865 3.5476 3.1299 2.6461 2.865 He 0.0000 0.0000 0.1250 0.3713 0.0396 0.3518 0.5048 0.0412 0.1487 0.2547 0.1487 0.4305 0.1909 0.2861 0.2494 0.6018 0.6674 0.6480 0.5749 0.6190 Ho 0.0000 0.0000 0.1250 0.3684 0.0400 0.4490 0.9800 0.0417 0.1200 0.2955 0.1600 0.5357 0.1053 0.3409 0.2857 0.6579 0.5556 0.6000 0.9048 0.6875 Lspn044 AlRan 207-209 207-209 207-209 207-209 207-209 207-209 205-209 207-209 205-209 207-209 207-209 207-209 207-209 207-209 207-209 205-217 205-217 205-217 205-217 205-217 Na 2 2 2 2 2 2 3 2 3 2 2 2 2 2 2 6 7(1) 6 6 6 AR 1,9999 1.9989 2 1.9999 1.9975 1.9997 2.1191 1.9998 2.1196 1.9973 1.9998 1.999 1.9998 1.9983 1.9998 4.4584 4.6942 4.4585 4.0013 4.8884 He 0.5098 0.4827 0.5250 0.5121 0.4709 0.5043 0.5036 0.5049 0.5125 0.4681 0.5048 0.4857 0.5063 0.4796 0.5065 0.7649 0.7736 0.7650 0.7357 0.8085 Ho 0.6154 0.4615 0.6250 0.5263 0.5400 0.4694 0.5400 0.5306 0.5000 0.4545 0.5800 0.3571 0.5000 0.4545 0.6429 0.7297 0.8519 0.8182 0.8636 0.9375 Pmaμ 3 AlRan 216-226 216-226 216-224 216-226 216-226 216-226 216-226 216-234 216-224 216-226 216-226 216-226 216-226 216-226 216-226 216-228 218-228 218-228 218-228 216-228 Na 3 3 2 3 4 4 3 5(1) 3 3 4 4 4 4 3 6(1) 5 4 4 4 AR 2.6617 2.4091 2 2.3157 2.6309 2.2445 2.4115 2.5797 2.1197 2.1351 2.4409 2.9522 2.8707 2.5097 2.3854 3.7971 3.3274 3.0203 2.8104 2.8709 He 0.5724 0.5098 0.5250 0.5391 0.5545 0.5235 0.5405 0.5263 0.5145 0.4982 0.5428 0.6010 0.5818 0.5368 0.5409 0.6089 0.4922 0.4791 0.4165 0.4778 Ho 0.5769 0.5769 0.8750 0.6842 0.5200 0.5918 0.4490 0.5208 0.5400 0.5000 0.5200 0.5556 0.5789 0.4318 0.4643 0.5750 0.5000 0.5143 0.5000 0.6111 All loci AR 1.89 1.86 1.63 1.99 1.87 2.00 1.96 1.87 1.86 1.91 1.91 2.03 2.00 2.00 1.93 3.36 3.37 3.29 3.10 3.30
15
Table 3. Pairwise estimates of genetic differentiation (FST) among sites (above diagonal) and corresponding P values (below diagonal). For populations’ acronyms, please check Table 1.
ROL ATR ROE GIR SEL EO ULL MIN LIM CAV DOU VOU MON TEJ GUA LaH COCH MER WES CON
ROL - -0.01049 0.05647 0.01403 -0.00577 0.01872 0.05233 -0.00967 -0.00721 0.00630 -0.00052 0.01350 0.00491 0.01135 -0.00547 0.24156 0.20797 0.20984 0.26780 0.21627 ATR NS - 0.08699 0.02497 -0.00873 0.01861 0.06100 -0.00129 0.00092 -0.00322 0.01710 0.01781 0.01347 0.01476 0.00244 0.25190 0.21786 0.21888 0.27797 0.23164 ROE * *** - 0.09220 0.06715 0.07128 0.10975 0.05382 0.06046 0.09935 0.07153 0.07978 0.07752 0.05269 0.07575 0.22603 0.19675 0.21113 0.24821 0.21126 GIR NS * ** - 0.01680 0.00970 0.00242 0.01535 0.00388 0.00352 0.00371 -0.01090 0.02368 -0.00348 -0.00196 0.17864 0.14052 0.14472 0.19598 0.14791 SEL NS NS ** * - 0.01498 0.05178 -0.00397 -0.00442 -0.00158 0.00739 0.01479 0.00724 0.00470 0.00037 0.26109 0.22563 0.23055 0.28717 0.23516 EO * * *** NS ** - 0.02619 0.02046 0.01355 0.00800 0.02631 0.01477 0.01525 0.00719 0.01245 0.24077 0.20118 0.20596 0.25105 0.20003 ULL *** *** *** NS *** *** - 0.05445 0.03516 0.03083 0.03717 0.00192 0.04628 0.02270 0.02734 0.22521 0.18468 0.18750 0.23466 0.18111 MIN NS NS ** NS NS ** *** - -0.00625 0.00650 -0.00256 0.01714 -0.00019 0.00488 -0.00374 0.25047 0.21446 0.22012 0.27519 0.21937 LIM NS NS ** NS NS * *** NS - 0.00228 -0.00529 0.00603 0.00328 0.00137 -0.00825 0.25219 0.21681 0.22228 0.27738 0.22169 CAV NS NS *** NS NS NS *** NS NS - 0.01324 0.00392 0.00987 0.00454 -0.00027 0.23857 0.20129 0.20260 0.25617 0.20571 DOU NS * ** NS NS *** *** NS NS * - 0.01039 0.00336 0.00560 -0.00130 0.24402 0.20989 0.21574 0.26992 0.20997 VOU NS * ** NS * * NS * NS NS NS - 0.02321 0.00289 -0.00023 0.20643 0.16926 0.17471 0.22410 0.17790 MON NS NS ** * NS * *** NS NS NS NS ** - 0.00724 0.00896 0.24486 0.21383 0.21659 0.26226 0.20358 TEJ NS * ** NS NS NS ** NS NS NS NS NS NS - 0.00543 0.21041 0.17150 0.18314 0.22636 0.17295 GUA NS NS ** NS NS * ** NS NS NS NS NS NS NS - 0.22569 0.19125 0.19408 0.25050 0.20082 LaH *** *** *** *** *** *** *** *** *** *** *** *** *** *** *** - 0.00107 0.00492 -0.00532 0.02182 COCH *** *** *** *** *** *** *** *** *** *** *** *** *** *** *** NS - -0.00604 0.00711 0.00033 MER *** *** *** *** *** *** *** *** *** *** *** *** *** *** *** NS NS - 0.00167 0.00349 WES *** *** *** *** *** *** *** *** *** *** *** *** *** *** *** NS NS NS - 0.00884 CON *** *** *** *** *** *** *** *** *** *** *** *** *** *** *** * NS NS NS - *, P<0.05; **, P<0.01; ***, P<0.001; NS, not significant (P > 0.05)
RESULTS
16
Figure 4. STRUCTURE bar plots generated from 12 microsatellite loci for A) the entire dataset of 20
populations from both sides of North Atlantic; B) European populations, composed of 15 sites; C) Five North American populations; and D) Eight populations from Portugal, to test the hypothesis of regional differentiation, following Lança et al. 2014. The most likely number of clusters in each dataset was computed using a combination of estimated LnP(D) values and ΔK of the Evanno method, as represented by the charts. These analyses indicate that the most consistent structure attained is a group in each side of the North Atlantic, as additional structuring in subgroups composed by samples from the same coast results in the same number of groups, with further differentiation within samples. Each individual is represented by a vertical bar, and sampled locations are indicated below plot.
17
Figure 4. (Continued) STRUCTURE bar plots generated from 12 microsatellite loci for A) the entire dataset
of 20 populations from both sides of North Atlantic; B) European populations, composed of 15 sites; C) Five North American populations; and D) Eight populations from Portugal, to test the hypothesis of regional differentiation, following Lança et al. 2014. The most likely number of clusters in each dataset was computed using a combination of estimated LnP(D) values and ΔK of the Evanno method, as represented by the charts. These analyses indicate that the most consistent structure attained is a group in each side of the North Atlantic, as additional structuring in subgroups composed by samples from the same coast results in the same number of groups, with further differentiation within samples. Each individual is represented by a vertical bar, and sampled locations are indicated below plot.
RESULTS
18
Table 4. Locus-by-locus analysis of molecular variance (AMOVA). Source of variation Sum of
squares Variance components Percentage of variation P Fixation Indices AMOVA I Among populations 417.461 0.28551 10.65 Within populations 3257.205 2.39494 89.35 <0.001 FST: 0.10651 Total 3674.666 2.68045 AMOVA II Among groups 336.441 0.75470 23.73 <0.001 FCT: 0.23730
Among populations within groups 81.020 0.03068 0.96 <0.001 FSC: 0.01265
Within populations 3257.205 2.39494 75.31 <0.001 FST: 0.24695
Total 3674.666 3.18033
AMOVA III
Among groups 5.195 -0.00286 -0.14 >0.05 FCT: -0.00135
Among populations within groups 15.381 0.01129 0.53 >0.05 FSC: 0.00532
Within populations 1372.135 2.11244 99.61 >0.05 FST: 0.00397
Total 1392.711 2.12087
In AMOVA I all populations were included (n=20), in AMOVA II the same populations were grouped into the two clusters suggested by the STRUCTURE analyses (i.e., European and North American populations), and in AMOVA III individuals from Portuguese populations (n=8) were assembled into the three groups suggested by Lança et al. (2014).
Figure 5. Principal coordinates analysis plot (PCoA) computed by GenAlEx. The percentage of
variation explained by each axis is shown, with most variation explained by axis 1. Samples’ acronyms as in Table 1.
19
4. Discussion
4.1. Dispersal at sea, site selection and evolutionary implications
Anadromous sea lamprey populations from the west and east coast of the North Atlantic show significant genetic differentiation and a strong geographic clustering, i.e., a two-groups structure, with restricted dispersal between, and fidelity to, the east and west coast of the Atlantic. This suggests that European and North American populations are isolated and there is an absence of gene flow between both sides of the Atlantic, probably due to the long distance between coasts. These results are in accordance with a previous study using mitochondrial DNA (Rodríguez-Muñoz et al. 2004), that showed an absence of genetic exchange among sea lamprey populations spawning in the west and east Atlantic coasts.
Analysis were performed to clarify if there is further differentiation within the American and European populations, but at this scale the results revealed low genetic differentiation among locations of the same coast (although some significant pairwise comparisons), and no geographic clustering. This suggests a lack of natal homing, in agreement with the results of Waldman et al. (2008), where no structure was revealed between sea lampreys collected from 11 North American east coast rivers (some of them included in this analysis). Using a portion of the mitochondrial DNA control region, these authors found no significant differences in haplotype frequencies among them, with almost 99 per cent of haplotypic diversity occurring within populations. Bryan et al. (2005) also found no significant genetic differences among anadromous populations of sea lamprey along the North American Atlantic coast, and Rodríguez-Muñoz et al. (2004) found the same lack of structure along the European Atlantic coast.
The apparent lack of natal homing in sea lamprey is observed in other anadromous lamprey species, like for instance the Pacific lamprey (Entosphenus
tridentatus), where no geographic structure was detected among 20 locations from west
coast of North America, using nine microsatellite loci (Spice et al. 2012). These authors, however, suggest limits to dispersal at sea, which precludes panmixia in this species. This assumption was based in the somewhat higher and often significant FST values
DISCUSSION
20
lampreys are panmictic will be dependent on their dispersal capabilities at sea. The sea lamprey is apparently another case of restricted dispersal at sea in some areas of its distribution, namely in the western Iberian Peninsula, where significant morphological and physiological differences were found between adults from different geographical groups, segregated by seabed topography (Lança et al. 2014). This differentiation is most likely the result from the influence of environmental factors to which lampreys may have been exposed during the oceanic trophic phase of the life cycle. Indeed, in the present study no genetic structure was attained for the exact same populations, meaning that the oceanic phase of the sea lamprey life cycle is most likely composed by a dispersion period during the juvenile migration, followed by a much less mobile adult stage, which will restrict the mixture of adult lampreys from different geographical groups. Adaptation in the larval stage also seems to occur to some extent. Almeida et al. (2008) analysed the morphological variability of sea lamprey larvae from the main Portuguese river basins, and found morphometric segregation of populations (the total classification rate estimated from cross-validation procedure was 54.8%), meaning that during the long larval phase individuals also adapt to the environmental conditions encountered in the natal stream.
These results indicate local adaptation of i) sea lamprey populations inhabiting the east and west coast of the North Atlantic, with genetic differentiation detected both at mitochondrial DNA (Rodríguez-Muñoz et al. 2004) and microsatellite loci (this study), and ii) groups of populations from western Iberian Peninsula, differentiated at the morphological and physiological levels, as result of ecological factors (Almeida et al. 2008; Lança et al. 2014), rather than derived from a genetic basis (this study).
The apparent lack of natal homing in anadromous lampreys contrasts to strong natal homing in other anadromous fish, like salmonids. McDowall (2001a) suggested that homing raises adaptation of stocks to favourable local spawning conditions, allowing the evolution of local adaptations. Even though homing is generally regarded as adaptive advantageous, it seems that lampreys have evolved in the direction of regional adaptations, instead of natal site fidelity. Indeed, even though homing makes fish return to habitats of known spawning success, it may become disadvantageous. Cury (1994), in a review about reproductive behaviours, such as natal homing, referring
21
to marine turtles and salmon, species that return very accurately to their natal sites, explains that individuals cannot respond, in terms of adaptability, to changes in their spawning habitat. If, for natural or anthropogenic reasons, the spawning site becomes unsuitable, the individuals do not attempt to breed at alternative areas, and spawn at sites that are unfavourable for successful production of progeny. In this sense, the author considers that “strays are essential for long-term dynamics by exploring and fixing new environmental solutions that later may become possible for the species” (Cury 1994). In the study of Lança et al. (2014), classification results revealed a few of such individuals, similar to the “strays” of species exhibiting homing, i.e., individuals that were classified in other geographical groups, which, for instance if their hosts have carried them far from their natal rivers, can explore other areas nearby. According to the exposed above, lampreys seem to present regional panmixia, with local adaptations at the morphological and physiological levels, but apparently no genetic segregation, which seem to provide adaptive advantage for the species survival in the long-term. Also, it is known that parasitic lampreys may be displaced over hundreds of kilometres by host fishes (Johnson et al. 2015), and thus returning to the natal stream would imply high energetic costs, which lampreys, not homing, can invest in reproduction (such as gonadal production, upstream migration and nest construction).
In the absence of homing, Waldman et al. (2008) suggested that lampreys use a strategy referred to as ‘suitable river’, to complete its life cycle. According to this strategy, and because many rivers are unsuitable for sea lamprey reproduction, instead of returning to natal streams, sea lamprey use chemical cues to locate spawning habitat that is suitable for larvae. The perception that there are populations of conspecifics in upstream catchments (“kin recognition”) through body odours or pheromones released incidentally or deliberately by populations upstream was also recognized as a strategy to relocate and exploit favourable spawning habitats by McDowall (2001a). Lamprey larvae release unique bile acids that function as migratory pheromones detectable by adults in marine waters (e.g. Li et al. 1995; Bjerselius et al. 2000; Polkinghorne et al. 2001) and then reproductively mature males release a bile acid that acts as a potent sex pheromone, inducing preference and searching behaviour in ovulated female lampreys (Li et al. 2002). This strategy allows ammocoetes to “advise” the former generations to
DISCUSSION
22
spawn where they occur, because it means that, at that moment, the habitat conditions are favourable, and allows adult lampreys to locate suitable spawning and rearing habitat. Another advantageous characteristic of this strategy is that the attraction is not species specific, as pheromones emitted by larvae are conserved among lamprey species (e.g. Fine et al. 2004; Robinson et al. 2009).
The great capacity of adaptation, both in the larval and adult phases, seems to bring lampreys adaptive advantages, as it enhances the plasticity of the species to adapt to inconstant environments. Also, the absence of homing, but instead the kin recognition allows the selection of watersheds with suitable spawning and rearing habitat. The cues for initiating upstream migration are another issue of great interest among the lamprey community, and temperature and flow appear to be the key triggers for upstream migration (Moser et al. 2015). Studies have demonstrated that migratory activity increases with increased stream discharge, which may be a mechanism to ensure that lamprey passage is facilitated through difficult areas (reviewed in Moser et al. 2015). In basins where the available water is reduced in the months with higher temperatures, like the Guadiana basin, in southern Portugal, river flow reduction in drought years can reduce the watershed attractiveness of the basin to migratory adults. This southern basin constitutes a geographical group with unique morphological and physiological characteristics as adults (Lança et al. 2014), but the absence of homing allows some individuals to enter nearby watersheds. This plasticity allows lampreys to respond positively to, for instance, potential effects of climate change, moving northwards and shifting the species distribution.
4.2. Implications for conservation
Populations from the west Atlantic coast revealed higher levels of genetic diversity than European samples (see Table 2). This is in agreement with findings from Bryan et al. (2005), where the authors found evidence for a genetic bottleneck in River Mondego, using eight microsatellite loci, and significant differences in allele frequencies between Mondego and North American anadromous populations.
23
This scenario may be due to the distinct threats faced by populations from both sides of the Atlantic. P. marinus is considered threatened in the European countries holding the main populations (i.e. France, Spain and Portugal), where it has been fished for centuries during their upstream spawning migration, and is considered a gastronomic delicacy with high socioeconomic value (Almeida et al. 2002; Mateus et al. 2012; Stratoudakis et al. 2016). Overfishing, together with habitat loss, are the main threats to this species in the Iberian Peninsula (Almeida et al. 2002; Mateus et al. 2012), and both have led to a large reduction in population size, and consequently, the populations are more prone to genetic bottlenecks due to the loss of variation. Therefore, these populations require special conservation and management actions, especially in what concerns fishing regulations and habitat restoration. In Portugal, actions directed to the conservation of diadromous fish are being conducted, both intended to recover stretches of habitat that became unavailable after construction of impassable barriers (Pereira et al. 2016), and directed to sustainable fisheries (Stratoudakis et al. 2016), to guarantee the long-term persistence of the species.
The identification of stocks, and whether they have a genetic basis, or rather are derived from environmental factors, is key for the management of fisheries. Conservation priorities for sea lamprey were defined as the effective articulation between fisheries management and habitat recovery, to guarantee cost-effective monitoring and sustainable long-term exploitation (Stratoudakis et al. 2016).
REFERENCES
24
5. References
Almeida PR, Quintella BR, Dias NM, Andrade N (2002) The anadromous sea lamprey in Portugal: Biology and Conservation perspectives. In: Moser, M., J. Bayer, & D. MacKinlay (eds.) Symposium Proceedings of the International Congress on the Biology of Fishes – The Biology of Lampreys. Vancouver, University of British Columbia: 49-58.
Almeida PR, Tomaz G, Andrade NO, Quintella BR (2008) Morphological analysis of geographic variation of sea lamprey ammocoetes in Portuguese river basins. Hydrobiologia 602: 47−59. Beamish FWH, Potter IC (1975) The biology of the anadromous Sea lamprey (Petromyzon
marinus) in New Brunswick. Journal of Zoology 177: 57–72.
Belkhir K, Borsa P, Chikhi L, Raufaste N, Bonhomme F (1996) GENETIX 4.05, logiciel sous Windows TM pour la génétique des populations. Laboratoire Génome, Populations, Interactions, CNRS UMR 5000, Université de Montpellier II, Montpellier (France).
Bergstedt RA, Seelye JG (1995) Evidence for lack of homing by sea lampreys. T. Am. Fish. Soc., 124(2): 235–239.
Bjerselius R, Li W, Teeter JH, Seelye JG, Johnsen PB, Maniak PJ, Grant GC, Polkinghorne CN, Sorensen PW (2000) Direct behavioral evidence that unique bile acids released by larval sea lamprey (Petromyzon marinus) function as a migratory pheromone. Canadian Journal of Fisheries and Aquatic Sciences 57: 557- 569.
Bryan MB, Libants SV, Warrillow JA, Li W, Scribner KT (2003) Polymorphic microsatellite markers for the landlocked sea lamprey, Petromyzon marinus. Conservation Genetics 4: 113–116. Bryan MB, Zalinski D, Filcek KB, Libants S, Li W, Scribner KT (2005) Patterns of invasion and
colonization of the sea lamprey (Petromyzon marinus) in North America as revealed by microsatellite genotypes. Molecular Ecology 14: 3757–3773.
Cabral MJ, Almeida J, Almeida PR, Dellinger T, Ferrand de Almeida N, Oliveira ME, Palmeirim JM, Queiroz AI, Rogado L, Santos-reis M, eds. (2005) Lisbon: Livro Vermelho dos Vertebrados de Portugal. Instituto de Conservação da Natureza.
Cury P (1994) Obstinate nature: an ecology of individuals: thoughts on reproductive behaviour and biodiversity. Canadian Journal of Fisheries and Aquatic Sciences 51: 1664– 1673. Earl DA, VonHoldt BM (2012) STRUCTURE HARVESTER: a website and program for visualizing
STRUCTURE output and implementing the Evanno method. Conservation Genetics Resources 4: 359– 361.
Evanno G, Regnaut S, Goudet J (2005) Detecting the number of clusters of individuals using the software STRUCTURE: a simulation study. Molecular Ecology 14: 2611–2620.