EVALUATION OF TEACHING PERFORMANCE IN HIGHER
EDUCATION: STUDENTS PERSPECTIVES AND TEACHING
MANAGEMENT INDICATORS
N. Jesus Silva
1, C. Costa Lobo
1, C. Santos Pereira
2, N. Seabra Durão
21
Universidade Portucalense, Infante D. Henrique/INPP (PORTUGAL)
2Universidade Portucalense, Infante D. Henrique/IJP (PORTUGAL)
Abstract
This study is part of a research project whose main objective is to identify, select, evaluate and synthesize the available evidence on Quality Indicators in Higher Education. There is, an advance in the establishment of Quality evaluation standards in Higher Education. Higher education institutions have undergone profound changes in the last 40 years, in particular in the Teacher Performance Evaluation. In the recent past, such as massification and democratization, were necessary and useful, although it is still necessary to anticipate structural and functional changes that increase the quality and social equity of Higher Education.
In this work, the parameters resulting from pedagogical surveys in a Portuguese higher education institution in the north of the country will be presented, surveys for the 2015/2016 school year, presented to 1751 students, in a total of 11 degrees and 18 master's degrees. It is analyzed the performance of a group of 68 teachers, working full time, teachers evaluated by students. This paper presents the instruments made profitable by the students in the last three academic years, allowing the identification of the indicators regarding the qualifications and competences of the faculty in the following areas: research, teaching, university management and transfer and knowledge valorization. This paper describes the procedures resulting from the descriptive analysis (frequency analysis, descriptive measures and association measures) and inferential analysis (ANOVA one-way, MANOVA one-way, MANOVA two-way and correlation analysis) discussing the results regarding the impact of teacher performance on student satisfaction.
Keywords: Teaching performance, higher education, students perspective, indicators of teaching management.
1 INTRODUCTION
Education and training in a university higher education environment, rather than a set of school, institutional or organized learning stages, give rise to a constant process of evolution and personal reorganization.
In many cases, the higher education teacher learns to teach for himself, which has produced a set of myths and fallacies about teaching in the context of higher education - such as teaching to master content and Quality of teaching can not be assessed. The higher education teacher, in deciding the processes and practices he performs in the preparation of a study plan, in the management of the classroom, and in the promotion of useful social resources to students, often follows his Intuition, between routines and experiences lived as a student. This observation learning, through prolonged contact with the teaching profession, will affect the understanding and its teaching practices. However, the adequacy of the teacher model does it yourself, it has been questioned. Firstly, it is a model that does not always respond to the needs imposed by the proposals under the Bologna Process, or the need to train graduates with competences relevant to the professional challenges of the future. In the assumption that it is crucial to favor the development of strategies that can support the teaching staff in the management of students' motivations and expectations, captivating and progressively stimulating their interest in learning and effectively enhancing their academic adjustment and academic success, this paper reports results from Application of a Pedagogical Inquiry. This research is carried out with the intention of continuing the intervention with the community of higher education teachers, with the aim of promoting and operationalizing the skills of critical analysis of the teaching-learning process, exploration and monitoring of teaching practices.
2 METHODOLOGY
The purpose of this section is to describe the procedures used to collect data that are the basis for this research. The main feature of the scientific method is an organized research, strict control of the use of observations and theoretical knowledge.
For the present study, we used the methodology of quantitative research, since it is more appropriate to determine the opinions of the students based on structured questionnaires.
The undertaken study was descriptive and inferential. Data collected for quantitative research through the use of questionnaires requires special care because it is not enough to collect responses about the issues of interest, it is also important to know how to do statistical analysis for proper results validation.
The quantitative study was based on an online questionnaire (for each curricular unit attended by the student) with 3 sections to evaluate: the curricular unit (section 1), the teaching activity (section 2) and the student's performance in the curricular unit (section 3). It should be noted that all questions are of the closed type [1].
The objective of this study is to analyze the performance evaluation of a set of 68 teachers (section 2), in a full-time working regime, teachers evaluated by students (average response rate of students in the 1st / 2nd year, 85.45% and 60.095%, respectively). Teaching activity is evaluated according to 9 items using a 7-level Likert scale, in which level 1 represents the lowest and the 7th highest. The following characteristics were also included in the study: gender, department, years of service in the institution, professional category, academic degree, work area, number of courses taught and annual school service (in number of hours). This option allowed, besides the characterization of the teachers, to evaluate if these personal characteristics affect their performance. The procedures used for the treatment of the data were the descriptive analysis (frequency analysis, descriptive measures and association measures) and inferential analysis (ANOVA one-way, MANOVA one-way parametric and nonparametric, and correlation analysis- Spearman's rho and Pearson correlation). The data were treated using the IBM SPSS Statistics 24.0 software.
3 ANALYSIS AND DISCUSSION OF RESULTS
Portucalense University (UPT) is a private higher education institution, located in Oporto, in the north of Portugal. It is organized in four Departments: Law, Economics, Management and Informatics, Heritage and Tourism and Psychology and Education that teach 1st and 2nd cycle programs and post graduations, structured according to the Bologna Process. More than acquiring theoretical knowledge, the students have the chance to develop practical work and research projects, developing different kinds of skills that prepare them for jobs in future career and for living in a competitive global society. Courses are structured so as to respond flexibly to changing labor market needs, through various teaching methods empirically based on significant case studies whenever applicable. UPT has its own dedicated staff and also counts on the input of practicing professionals from different industrial and commercial sectors, through the medium of guest seminars on various themes, thereby promoting its relationships with the corporate world with the goal of preparing students for future professional demands. Teachers with a teaching service at UPT are attached to the teaching service according to their scientific area. Of the set of 68 teachers studied, we found that the majority are female (63.8%). It should be noted that 92.8% of these teachers are PhDs. Regarding the professional category, 96.6% are auxiliary teachers. It should also be noted that half of the full-time teachers teach at least 6 units annually, with an approximate average of 319 hours of school service. Finally, it should be noted that 68.1% of these teachers have been working for more than 3 years in this Institution of Higher Education, which shows stability regarding the teaching staff.
The items (n = 9) corresponding to the evaluation of the teacher's performance, carried out by the students, expressed their opinion for each teacher with regard to the curricular units attended, in each semester. Thus, for each semester, students evaluated whether the teacher used adequate teaching strategies and methodologies (item 1), showed clarity and ability to systematize the presentation of the subject (item 2), whether it was able to stimulate motivation and interest Of the students (item 3), a favourable learning climate was created (item 4), conditions were created for the active participation of the students (item 5), materials were available to support the study (item 6) (Item 7), there was a commitment to promote the quality of teaching (item 8), and finally, if the teacher showed availability for the clarification of questions (item 9). For each item, the descriptive measures, mean (M) and
the average student scores were higher than 5, that is, above the "neutral" position (neither agreement nor student disagreement). Moreover, the standard deviations are reduced (ranging from 0.589 to 0.862) and are identical for all items, so that student evaluations are homogeneous. As an example, the ability to stimulate students' motivation and interest (item 3, 2ºS) was the item that presented the lowest average evaluation (M= 5.12, SD= 0.838) and complied with the agreed assessment rules with students (item 7, 1ºS) presented the highest average evaluation (M= 5.51; SD= 0.592). Hence, the overall average scores of teachers in the 1st and 2nd grades (M= 5.37, SD= 0.67 and M= 5.21, SD= 0.85), respectively.
In order to evaluate the possible existence of association between two variables, the association measures were calculated: Pearson correlation coefficient r (for quantitative variables) and Spearman rs rho coefficient (when at least one is measured on an ordinal scale). Then, we performed the correlation analysis - Spearman's rho and Pearson correlation (after verification of the Normality assumption through the Kolmogorov-Smirnov test, with Lilliefors correction, for the variables involved) [2,4]. To evaluate the effect of a qualitative independent variable (factor) on a quantitative dependent variable, we used the one-way ANOVA and to evaluate the effect of one or more qualitative independent variables on more than one quantitative we use MANOVA. Parametric ANOVA and MANOVA require the simultaneous verification of two conditions, that of Normality of the quantitative variables (using the above test) and that the variances / matrices of population covariance are homogeneous (Levene test and M-Box test, in the case of ANOVA and MANOVA respectively) [2,3]. By their greater importance, the analyses corresponding to items 3, 6, 7, 8 and 9 will be explained hereinafter.
3.1 Relationship between average annual evaluation of teachers, the number
of curricular units taught and the number of hours of teaching
There is no correlation between the average annual evaluation and the number of Curricular Units taught (rs = -0.024, p-value = 0.847> 0.05). There is no correlation between the average annual evaluation of teachers and the number of hours taught (r = 0.005, p-value = 0.967> 0.05). The evaluation of teachers' performance by students is not influenced by the number of units taught and the number of hours taught. Students evaluate cross-sectional, and similarly, teachers who have many Curricular Units in their service distribution, or few.
3.2 Influence of the number of years of service and of the scientific area in the
average evaluation of the teacher in the first semester and in the average
evaluation of the teacher in the second semester
There is no correlation between the average evaluation of teachers in the first semester and the number of years of service (rs = -0.024; p-value = 0.848) and there is no correlation between the teachers' average evaluation in the second semester and the number of Service (rs = 0.030, p-value = 0.813). This information indicates that the number of years of service of teachers does not influence the average evaluation of teachers in any of the semesters. The experience factor (years of service) is not an item that influences the students' evaluation of teachers when completing pedagogical surveys.
3.3 Influence of the area of technical skills of the teacher in the average
evaluation of the teacher's performance in the first semester and in the
average evaluation of the performance of the teacher in the second
semester
Before applying MANOVA, it was tested whether the variables related to teacher evaluation in the 1st Semester and 2nd Semester followed a normal distribution (using the Kolmogorov-Smirnov test with Lilliefors correction), and it was possible to conclude that yes, with A p-value greater than 0.2.
However, when the M-Box test was performed on the homogeneity of the covariance matrices, we rejected this hypothesis (p-value = 0.003 <0.05) and therefore the conditions of applicability of MANOVA are not guaranteed.
For this reason, as usual, it was decided to proceed directly to the realization of two ANOVAs. In the case of ANOVAS, the homogeneity of the variances (p-value = 0.625 and p-value = 0.899 respectively for the evaluation in the 1st and in the 2nd Semester) was verified, according to Table 1 and Tabel 2.
Table 1. Average Evaluation of Teachers in the First Semester (ANOVA).
Sum of Squares df Mean Square F Sig. Between Groups 2,211 6 ,368 ,963 ,459
Within Groups 20,271 53 ,382
Total 22,482 59
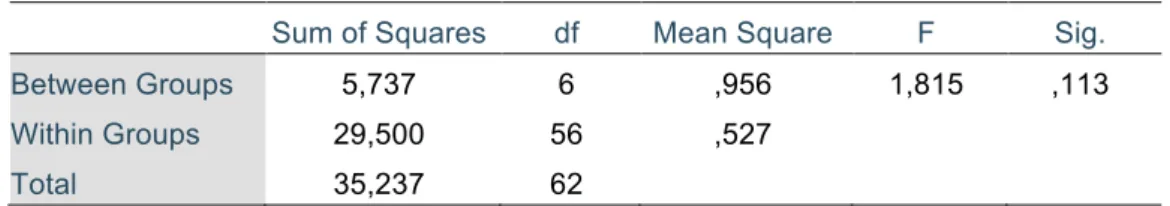
The scientific teaching area to which teachers are assigned does not influence their evaluation in the 1st or 2nd semester (p-value = 0.459> 0.05 and p-value = 0.113> 0.05, respectively). For students, it is not determinant, for the performance of teachers, their scientific area.
Table 2. Average Evaluation of Teachers in the Second Semester (ANOVA).
Sum of Squares df Mean Square F Sig. Between Groups 5,737 6 ,956 1,815 ,113
Within Groups 29,500 56 ,527
Total 35,237 62
3.4 Influence of teaching experience on the student's appreciation of the
teacher's ability to stimulate student motivation and interest in the first
and second semesters
There is no correlation between the number of years of service of the teacher and item 3 (teacher experience) in the first semester (rs = -0.013; p-value = 0.919) and there is no correlation (association) between the number of years of service of the teacher and item 3 in the 2nd Semester (rs = -0,059; p-value = 0,637). The teacher´s number of years of experience, has no association with students' perception of their ability to stimulate student motivation and interest in any semester. For students, the teacher's ability to stimulate student motivation and interest is not correlated with the teacher's years of service.
3.5 Influence of the department to which the teacher belongs, in the student's
appreciation of the teacher's ability to provide support materials for the
study and on the teacher's ability to comply with the evaluation rules
agreed with the students
Before applying MANOVA to evaluate whether the department factor to which the teacher belongs influences the dependent variables (items 6 and 7), it was tested whether the variables related to these items, in the 1st Semester and in the 2nd Semester, followed a Normal distribution (Kolmogorov-Smirnov test with Lilliefors correction). This assumption was only verified for the 1st Semester (p-value> 0.2).
As to the homogeneity of the covariance matrix, the Box M test was performed on the homogeneity of the covariance matrix, and the covariance matrices were homogeneous in both semesters (p-value = 0,326> α = 0, 05 and p-value = 0.629> α = 0.05).
As the normality assumption is violated for the variables in the 2nd Semester, the analysis for the two semesters is justified separately.
For the first semester, the assumptions of the application of MANOVA are verified, it was soon possible to confidently use the output of the "Multivariate tests" to test the assumptions related to MANOVA.
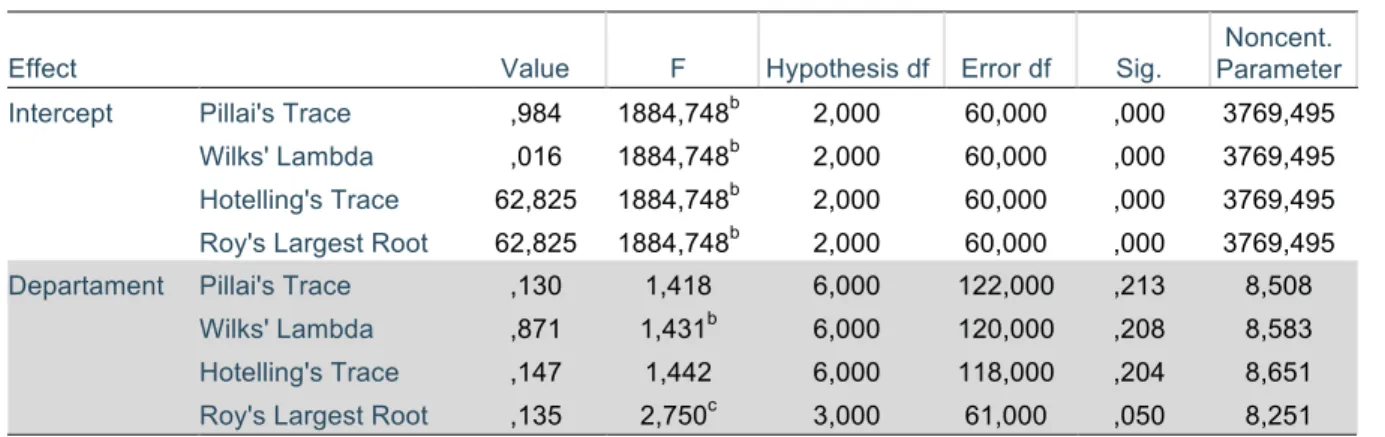
As there are several possible test statistics and in this type of fundamental analysis to identify which one has the most convenient use, the choice fell on the Roy's Largest Root statistic that is indicated when the quantitative variables (items) are strongly correlated (in this case, r = 0.955 with a significant correlation at the 0.01 level). Therefore, for the Roy's Largest Root statistic, where p-value = 0.05, it is possible to conclude that the department factor to which the teacher belongs has no influence on the
ability of the teacher to provide study support materials (item 6) and On the student's ability to comply with the assessment rules agreed with the students (item 7) in the 1st Semester.
Table 3. Multivariate tests, 1st semester.
Effect Value F Hypothesis df Error df Sig. Parameter Noncent. Intercept Pillai's Trace ,984 1884,748b 2,000 60,000 ,000 3769,495
Wilks' Lambda ,016 1884,748b 2,000 60,000 ,000 3769,495 Hotelling's Trace 62,825 1884,748b 2,000 60,000 ,000 3769,495 Roy's Largest Root 62,825 1884,748b 2,000 60,000 ,000 3769,495 Departament Pillai's Trace ,130 1,418 6,000 122,000 ,213 8,508
Wilks' Lambda ,871 1,431b 6,000 120,000 ,208 8,583 Hotelling's Trace ,147 1,442 6,000 118,000 ,204 8,651 Roy's Largest Root ,135 2,750c 3,000 61,000 ,050 8,251 Then, two ANOVAs were performed on the two dependent variables. Analyzing the values obtained for p-value, we verified that the factor does not have a significant effect on item 6 (p-value = 0.420), as does item 7 (p-value = 0.742). That is, it can be concluded that the department to which the teacher belongs has no influence on the teacher's ability to provide support materials for the study (item 6) and on the teacher's ability to comply with the evaluation rules agreed with the students (item 7) in the 1st Semester.
In the data regarding the second semester, and once one of the conditions of applicability of the parametric MANOVA is violated, because the normality assumption is not verified, the non-parametric MANOVA was applied to a factor. To do so, it was necessary to resort to the orders of the observations rather than the original values.
The hypothesis of applying the non-parametric MANOVA has been verified. Therefore, the results of the Multivariate tests can be relied upon to test the hypotheses related to MANOVA (see Table 4).
Table 4. Multivariate tests, 2nd semester.
Effect Value F Hypothesis df Error df Sig. Parameter Noncent.
Intercept Pillai's Trace ,720 74,627b 2,000 58,000 ,000 149,255
Wilks' Lambda ,280 74,627b 2,000 58,000 ,000 149,255
Hotelling's Trace 2,573 74,627b 2,000 58,000 ,000 149,255
Roy's Largest Root 2,573 74,627b 2,000 58,000 ,000 149,255
Department Pillai's Trace ,211 2,322 6,000 118,000 ,037 13,931
Wilks' Lambda ,799 2,292b 6,000 116,000 ,040 13,753
Hotelling's Trace ,238 2,262 6,000 114,000 ,042 13,574
Roy's Largest Root ,153 3,003c 3,000 59,000 ,038 9,008
In this case, the appropriate (more robust) statistic is based on the Pillai trace, calculated from the orders, and follows a chi-square distribution [3]. Thus, the observed chi-square was 13,082, for which a p-value of 0.96 corresponds. Since p-value = 0.96> 0.05, we hypothesized that the Department to which the teacher belongs has no influence on the teacher's ability to provide support materials for the study (item 6) and on the capacity of the teacher Comply with the evaluation rules agreed with the students (item 7), in the 2nd Semester.
3.6 Influence of the number of Curricular Units taught and the number of
hours taught in the student's appreciation of the teacher's commitment to
promoting the quality of teaching (item 8), in the 1st Semester and 2nd
Semester
Given the scale of measurement of the variables under analysis (1 ordinal on 1 scale, and 1 scale on 1 scale), the influence of the variables, Curricular Units taught and number of hours taught, on the variable related to item 8 ( For both semesters), through correlation analysis (Spearman and Pearson, respectively). Once again, there was no influence of either the number of curricular units or the number of hours taught, in the student's evaluation of the teacher's commitment to promoting the quality of teaching (item 8), since all P-value are at least 0.470.
It is observed that for the students it is not important the number of Curricular Units taught and the respective number of hours, in counterpart to the commitment of the teacher in the promotion of the quality of teaching. From the perspective of the students, whether teachers teach several Curricular Units and have several hours of teaching, or do not have, there is no impact on teaching commitment and their promotion of quality.
3.7 Gender influence in the student's appreciation of the availability of the
teacher to clarify students' doubts (item 9)
Once again, the normality assumption (p-value = 0.2> 0.05) was validated, which allowed the use of parametric one-way ANOVA for each semester (see Table 5 and Table 6).
In the case of ANOVAS, the homogeneity of the variances was verified (Levene test p-value = 0.379 and p-value = 0.375 respectively).
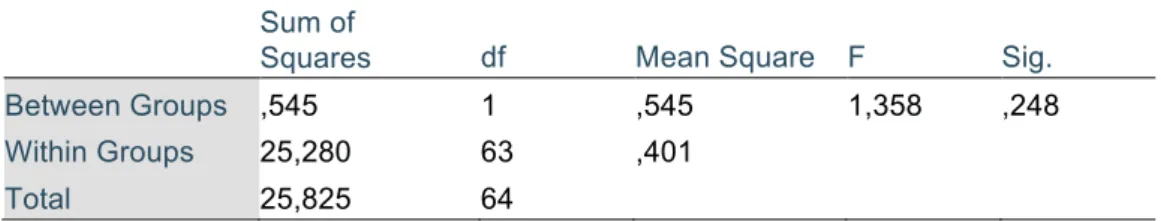
Table 5. Availability of the teacher to clarify students' doubts - 1st semester (ANOVA).
Sum of
Squares df Mean Square F Sig. Between Groups ,545 1 ,545 1,358 ,248
Within Groups 25,280 63 ,401
Total 25,825 64
The gender of the teacher does not influence the availability of the teacher to clarify doubts, regardless of the semester (p-value = 0.248 and p-value = 0.343, respectively). For students, clarification of doubts by teachers is not directly related to gender. From the point of view of the students, and from a gender perspective, it has no influence on the clarification of doubts, that is, whether teachers are male or female, this is not a reason for clarifying or not doubting.
Table 6. Availability of the teacher to clarify students' doubts – 2nd semester (ANOVA).
Sum of
Squares df Mean Square F Sig. Between Groups ,462 1 ,462 ,912 ,343
Within Groups 30,896 61 ,506
Total 31,357 62
4 CONCLUSIONS
The Portuguese higher education system has been undergoing a profound reform, in accordance with the European-wide strategy for the modernization of Higher Education promoting the knowledge-based economy and society.
A series of measures have been introduced in the last years for the accomplishment of what is known of the Bologna process, namely with the aim to guaranteeing quality evaluation, and modernizing higher education. This research report is a contribution to this greater concern: the quality assurance
of evaluation processes. One of the main objectives of the application of pedagogical surveys at Portucalense University is to gather students' opinions about the teaching activities, the functioning of the Curricular Units and the teaching staff, in a context of continuous improvement.
Given the results, it can be verified that there is no correlation between the teachers and the number of Curricular Units and the number of hours taught, there is no correlation between the number of years of service and the scientific area. Scientific area of the teacher) does not influence the average evaluation of the teacher in the first semester nor the average evaluation of the teacher in the second semester. Regarding the work area, this does not influence the average evaluation of the teacher in the first semester nor the average evaluation of the teacher in the second semester; And in terms of the number of years of service, this has no influence on the student's appreciation of the teacher's ability to stimulate the motivation and interest of students in the 1st and 2nd semesters; As for the department, it has no influence on the student's appreciation of the teacher's ability to provide materials to support the study and on the teacher's ability to comply with the evaluation rules agreed with the students; In reference to the number of Curricular Units taught and the number of hours taught do not influence the student's appreciation of the teacher's commitment to promoting the quality of teaching, both in the first semester and in the second semester; The last item under study refers to gender, having no influence on the student's appreciation of the availability of the teacher to clarify the doubts of the students.
The participation rate of the students in this initiative of the management bodies of the UPT is low, creating difficulty in the generalization of these results. It is concluded that it is a challenge in the first instance for students to realize how important the completion of pedagogical surveys is.
Only through a longitudinal study can we truly know the predictive potential of the selected variables. To this goal, it would be necessary to reach a larger number of courses to conclude if the observed pattern of results would be maintained. The low number of studies in this area (eg, [5], [6], [7], [8], [9]) also made this study more complex, either in terms of the current wording of the research hypotheses, Either on the methodological choices and the critical analysis of the results.
However, it is explicit the relevance of this study, because it allows us to know in depth the pedagogical reality at the University Portucalense Infante D. Henrique and to signal the students' perception of the performance of the teaching community of this university. With this work it becomes explicit the pertinence of considering the construction of new instruments to evaluate the quality of pedagogical performance.
REFERENCES
[1] Hill, M. e Hill, A. (2008). Investigação por questionário. Edições Sílabo.
[2] Maroco, J. e Bispo, R. (2005). Estatística Aplicada às Ciências Sociais e humanas. Climepsi Editores.
[3] Marôco, J. (2014). Análise estatística com o SPSS Statistics (6ª edição). ReportNumber. [4] Murteira, B., Ribeiro, C. Silva, J., Andrade e Silva, J., Pimenta, C. e Pimenta, F. (2015).
Introdução à estatística (3ª Edição). Escolar Editora.
[5] Simão, V., Santos, S. & Costa, A. (2003). Ensino Superior: uma visão para a próxima década. Lisboa: Gradiva.
[6] Escudeiro, N., Escudeiro, P., Barata, A. & Costa-Lobo, C. (2011). Enhancing students team work and communication skills in international settings. Information Technology Based Higher Education and Training (ITHET), 1-8. DOI: 10.1109/ITHET.2011.6018683.
[7] Costa-Lobo, C. & Taveira, M.C. (2009). Adaptação à Carreira no Ensino Superior: abordagem sócio-cognitiva. 1st international conference of Psychology and Education. Covilhã:
Departamento de Psicologia e Educação da Universidade da Beira Interior.
[8] Costa-Lobo, C. (2007). Avaliação da aprendizagem e planeamento pedagógico. Textos pedagógicos do Instituto Superior de Engenharia do Porto.
[9] Jesus-Silva, N., Medeiros, A. M., Caramelo-Gomes, J.; Costa- Lobo, C. (2016). Quality in higher education: analysis and discussion of evaluative standards internal consistency. Proceedings of ICERI 2016. ISBN: 978-84-617-5895-1