A work project, presented as part of the requirements for the award of a Master Degree in Management from the NOVA – School of Business and Economics
SATA SGPS FINANCIAL SUSTAINABILITY
ANTÓNIO PEDRO RODRIGUES DE CAMPOS GOMES 3494
A project carried out on the Master in Management Program, under the supervision of Professor Luís Rodrigues
2
ABSTRACT
The purpose of this direct research is to assess the viability and sustainability of SATA SGPS in the market of aviation despite the public service’s conditioning. This analysis, based solely on public information available, indicates a misleading management of the Azorean Airline, in particular, towards its fleet distribution, financial situation and the unsustainable international branch. In the period of 2007-16, the firm deteriorated financially and operationally, leading to an airline in need of restructuring if its goal is to be sustainable in the long run. Abandoning its major international routes and redesigning its fleet composition seems the most viable answer.
3
INTRODUCTION
The current Portuguese airline outlook is haunted by a common aspect: financial vacillation. Neither one of the two big players in this industry manages to make a profit in the end of the fiscal year even with a rising number of passengers travelling through Portuguese Airports in 2016 (+14,3%) reaching 45,3 million according to the National Institute of Statistics of Portugal (INE). What is the major factor behind this? Is it sustainable to bear the existence of two national airlines or even just one? May the fact that both SATA and TAP be state-controlled deeply affect their financials, strategies and long-term viability? Would it bring synergies to avoid agent costs from regional powerful groups or/and from costs optimization?
An airline survives by the control of its costs as well as defining a strong and thorough strategy so that it can actually create real value. Does a relatively small country as Portugal need two major players in this industry to fulfill all needs of its People? And is it really hopeless to have a national airline with financial strength even if it needs to maintain some public service’s routes?
To reach some credible results, this research aims to deeply analyze the key numbers of SATA Airlines in the period 2007-2016, in form of all annual reports available. Regarding the chosen period of research, 2007 was chosen due to being able to give insights of the company without much correlation to the financial crisis that affected Portugal and the world in the meantime. Moreover, in the analysis of each branch, the period studied will be only from 2007-15 due to unavailability of 2016. In the end, we seek to conclude whether SATA is able to make a sustainable profit, remain financially strong and still perform its duty as a public servant.
LITERATURE REVIEW
The matter this thesis intends to go into is included in one of the oldest discussion in economics: what is the role of the state in the real economy. John Maynard Keynes defended the intervention
4
of the government on the economy in order to regulate it because it was unable to regulate itself (Winch, 1989). On the other hand, Friedrich von Hayek (1994), another famous economist opposed fiercely to Keynes Theory and stated in his book, The road to Selfdom, that “The successful use of competition as the principle of social organization precludes certain types of coercive interference with economic life”.
As time went by, new theories were formulated and, especially, towards economic development. The Harrod-Domar Model, formulated in the 40’s, stated in its computations that the economy cannot generate high levels of employment and growth rates naturally and, therefore, state intervention is required. Albert Hirshmann (1958) declared that the state had two main functions in the development process: the state must begin with measures capable of incentivise and make pressure so that actions come up and then the state must be actively prepared to balance those actions in order to maintain its dynamics and growth.
During the period when these theories were created, SATA Airlines was also founded. As currently, the company belongs 100% to the Azorean Government, it flags the necessity to stay in the state sphere to be able to sustain its operations for all Azoreans and the Archipelago. But is this so? Which theory applies today to this case? Classic or Liberal?
More recently, Socha (2011) argued that the privatization of a regional airline would bring three main economic gains: Operating efficiency would improve (since the private business model aimed for profit often moves towards deeper exploitation of revenue streams and to minimizing costs), new management styles and marketing skills would be applied to a more consumer-oriented approach, and lastly, there would be better investment decisions. On the other hand, the same author claims that privatizing a regional airline would most probably bring a deterioration of
5
workers’ salaries and job conditions while at the same time reducing maintenance costs to the lowest and eventually fire employees.
Effectiveness has always been the goal for all airlines. The airline industry is characterized mostly by huge fixed-costs and by economies of scale. By saying so, it is vital that an airline learns how to rationalize its fleet to the most in order to push its aircrafts’ capacity to the top. (Spurling, 2010). A recent research by Chou, Lee, Chen and Tsai (2016) analysed the operational efficiency of 35 airlines in the world. Results have shown that airlines ought to focus its input resources in order to improve its productivity.
Lately, Zoltaszek and Pisarek (2016) analysed 29 airlines in Europe and the research pointed out that it is more difficult for big airlines to achieve full efficiency than smaller ones. Furthermore, what research also shown is if inefficient airlines desire to improve their efficiency, they will much probably be pushed to reduce severely their inputs to achieve that goal.
Smaller airlines tend to be more profitable, not only on an operational but also on a net basis (Airline Business, 2005).
The airline industry in the world has undergone a major change in the second half of the XX century, switching from a monopolized to a more deregulated industry. This first started in the USA with the Airline Deregulation Act signed by President Carter and this eliminated the Civil Aeronautics Board (CAB), a public entity which regulated the commercial airlines and stipulated which fares were to be applied and where the airlines were allowed to fly to. This act opened doors for the Low-cost Carriers (LCC) like Southwest Airlines to thrive and pushed down other well-established airlines to the ground just like Pan Am. In Europe, with the goal of a common market, it eventually followed the same path as the USA and advanced in the 1990’s. However, many problems arose from this in EU like national carriers may find it impossible to adapt to the new
6
liberalized environment, risking jobs and services; uneconomic services can be lost by lack of profitability; regional airlines may become underdeveloped; and safety and security may be put to the second plan in order to ensure profitability and competitive advantage (ICAO, 2003).
Recently, the industry has witnessed the appearance of many LCC in the market, reshaping the outlook for the industry.
The rules of state aid to airlines have changed and it is only allowed the firms to be rescued once. Additionally, alongside the financial help, there must be a long-term plan in order to ensure the sustainability of the company in the long-run. According to the ECB president, “I do not believe that continued state support to an airline is in the long-term interest of the consumer-taxpayers. Where airlines are subsidized, consumers rarely enjoy low prices […] this is because the lifetime support often has the effect of delaying restructuring” (Monti, 2003).
Finally, a recent study showed that depending on the business model, certain airlines are better positioned to achieve profits than others: LCC (Ryanair) are currently very successful with their operational management, “mixed” business model (Air Berlin) falls short to attain profit since it does not specialize in routes, passengers or fares; and lastly, Full-Service Carriers, FSC (TAP) should specialize in certain areas to achieve profit and in TAP’s case, focus on the triangle Europe, South America, Africa where it has competitive advantage (Marques, 2015).
ECONOMIC POSITION OF AZORES
The Azores is one of the two archipelagos which belong to the Portuguese Republic besides Madeira. These islands were first discovered in the fourteenth century by the Portuguese and have remained its territory ever since. Nowadays, these nine Azorean islands represent circa 2.2% of the global Portuguese GDP, almost €3.8B per year, having grown 1.7% in 2015 and 0.7% in 2014. The Azorean economy is mainly based on primary sector’ activities just like livestock and cattle
7
raising, dairy products, farming and even tea production. In 2014, the average Azorean family got an available gross income over 11.300€, more than the average of Portugal, 11.225€.
The size of the population has been decreasing, reaching over 245.700 in 2015, 0.2% less than the previous year. At the same time, over half of it (56%) is located in one single island, São Miguel, the capital of the archipelago, and rest spread-out through the remaining eight islands.
In the recent years, Azores has experienced an exponential increase in tourism in the region not only from Portuguese citizens but also from international public. According to SREA, nearly half a million people visited the Archipelago in 2015 (~440.000 people), a figure that rose 23.5% when compared to the previous year. Of these 440.000 visitors, over 60% chose to visit the capital São Miguel. From 2014 to 2015, the number of visitors increased 32% and 11, 5% to São Miguel and to the remaining islands, respectively. Out of these tourists, circa 50% are Portuguese while nearly 40% come from European countries and the remaining from the rest of the world. With these data, we can assume that the Azores as a touristic destination is not just an escape for the Portuguese public but also to Europeans, especially. The Azores registered a total of M1.33 overnight stays in 2015, 19% more than in the previous year.
Regarding data from the aviation industry, Azores registered over 18.400 airplane movements during the year of 2015, whilst only 9.1% of those were originated from international traffic. Moreover, out of these global movements, 72% refers to interisland regional flights and only 19% comes from flights related with continental Portugal, therefore, we can conclude that the vast majority of flight movements in the airports of Azores is related to inter-island flights. The aircraft traffic in the archipelago as gone up by 7.4% in 2015 when compared with 2014 (ANAC, 2016) Another crucial aspect that has a significant effect on the economy is the substantial number of Azorean emigrants spread all over the globe especially in North America. Since 1960, the regional
8
government registered an outflow of 182.332 Azoreans to other countries, especially to Canada and USA accounting for 43% and 53% respectively. From this figure, it is estimated that out of the 4.5M Portuguese people living abroad, 1.5M come from the Azorean diaspore spread all over America. Another fact that must be mentioned in this subject is that these numbers do not account for the illegal emigration that occurred during the dictatorship period lived in Portugal from 1926-1974.
Summing up, there is an unquestionable market of people who have connections to the Azores and have reasons to travel to and back more often.
SATA SGPS SITUATION
SATA SGPS is a Portuguese Airline founded in 1947 with the aim to serve the people from the Azores to easily connect the nine islands that constitute this Portuguese archipelago. For hundreds of years, the Azores inhabitants felt far from the great metropolis such as Lisbon and even São Miguel. Thus, today we can easily see a different evolution and economic situation in each of the Azores’ islands, making clear a disparate wealth distribution among the islands.
SATA was founded by a group of notorious islanders, however, in 1980, the Azorean Government purchased the company, turning it into public control. During the period between 1980 to this date, the company’s equity was sold and bought several times, having existed a moment when the regional government only held 50% of the company while the other half belonged to Bensaúde Group, the largest economic group of the archipelago. Today, the Azorean Airline is totally controlled by the regional government. Moreover, it has never felt so much competition as in the present days, greatly due to the liberalisation of the Azores-Portuguese mainland routes.
9
Functional Structure
SATA SGPS is a firm totally owned (100%) by the Azorean Regional Government which holds full equity of SATA Air Açores, firm that is responsible for the air transportation within the nine islands of Azores, Madeira and Canaries Islands. This last firm holds 100% equity in four other firms: SATA International, SATA Gestão de Aeródromos, SATA Express and SATA Azores Express. SATA International is the airline which serves the market of North America from the Azores and Europe (Portugal). SATA Gestão de Aeródromos is the subsidiary whose responsibility is the management of aerodromes in the Archipelago. Finally, SATA Express and SATA Azores Express are tourism operators to Canada and USA respectively.
Brands
SATA is an acronym for Serviço Açoriano de Transportes Aéreos. This brand is used in all companies of SATA SGPS which makes it not only a symbol of SATA itself but also of Azores. Along with the name the airline carries a logo with it: an Azor, an endogenous bird species natural from the Azores which is in the origin of the name of the Archipelago. The current logo was introduced in 2009 as a way of modernization and to follow along with the industry.
Routes
The Azorean airline has currently 21 routes distributed not only among its nine islands but also to the Portuguese mainland, Europe and North America. Along the last three years, the company has pursued a downward trajectory in this rubric, coming from 25 routes in 2014 to 21 in 2016.
Fleet
SATA Group’s current fleet size is thirteen aircrafts. SATA International uses seven Airbuses: three A320-200, three A310-300 and one A330-223 while SATA Air Açores uses six Bombardier aircrafts: two Q200 and four Q400.
10
Financial Information
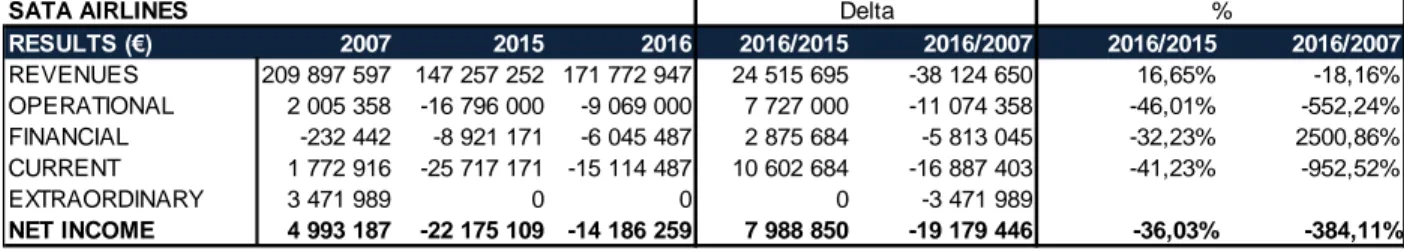
SATA Airlines is financially fragile as the financials show quite straightforwardly that its operational, financial result and net income are often negative and volatile as seen in table 1.
Table 1. SATA Airlines' consolidated results
What is observed is that SATA Airlines as a whole has severely deteriorated its financials during the period in study, especially on the operational and financial results. The financial cost is a rubric that has pushed the company down quite harshly and, therefore, is the main cause of the financial result being so critical. Regarding the operational state, the airline has been decreasing its flights and routes due to managerial decisions in order to counter the financial situation the firm is facing in the last reported years.
Looking at the balance strength, we are able to see debilities when regarding its balance:
Table 2. SATA Airlines' consolidated Balance
Again, just like the financials’ results, the outlook of the balance is better on 2007 than on 2016. The situation worsened in almost every field with the equity becoming negative, driven by a long series of negative net incomes that sank the rubric “transited results”. Moreover, Liabilities
SATA AIRLINES RESULTS (€) 2007 2015 2016 2016/2015 2016/2007 2016/2015 2016/2007 REVENUES 209 897 597 147 257 252 171 772 947 24 515 695 -38 124 650 16,65% -18,16% OPERATIONAL 2 005 358 -16 796 000 -9 069 000 7 727 000 -11 074 358 -46,01% -552,24% FINANCIAL -232 442 -8 921 171 -6 045 487 2 875 684 -5 813 045 -32,23% 2500,86% CURRENT 1 772 916 -25 717 171 -15 114 487 10 602 684 -16 887 403 -41,23% -952,52% EXTRAORDINARY 3 471 989 0 0 0 -3 471 989 NET INCOME 4 993 187 -22 175 109 -14 186 259 7 988 850 -19 179 446 -36,03% -384,11% Delta % Balance (€) 2007 2015 2016 2016-2015 2016-2007 2016-2015 2016-2007 EQUITY 32 707 848 -78 465 106 -94 609 772 -16 144 666 -127 317 620 20,58% -389,26% Transited results 4 650 935 -78 463 867 -102 683 278 -24 219 411 -107 334 213 30,87% -2307,80% Shareholders' equity 18 000 000 18 000 000 18 000 000 0 0 0,00% 0,00% Reserves 244 786 858 528 944 423 85 895 699 637 10,00% 285,82% LIABILITIES 105 312 909 247 600 644 254 604 525 7 003 881 149 291 616 2,83% 141,76% Loans 46 864 450 161 133 971 160 823 735 -310 236 113 959 285 -0,19% 243,17% ASSETS 138 020 757 169 135 538 159 994 753 -9 140 785 21 973 996 -5,40% 15,92% Delta %
11
increased sharply, almost +€150M in 9 years’ time. This implies higher debt and external dependence, mostly due to the renewal of the fleet and to the payment of the constant negative results. The amount of loans represents circa 63% of the total liabilities in 2016, a figure that illustrates the representation of this concern in the firm’s liabilities. Finally, the level of assets rose although very gently. It would be expected a higher value due to the renewal of a part of the fleet but it did not. The amount of assets has, therefore, relatively stagnated.
ANALYSIS OF PORTUGUESE COMMERCIAL AVIATION
The Portuguese market in commercial aviation has been going through some transformation, still adapting to the rising number of tourists visiting the country (21.3M tourists in 2016, +11.1% than 2015). Regarding the number of passengers moving across Portuguese Airports, it has gone up 14.3% to 45.3M in 2016 while the Portuguese airlines only account for 12.6M of that total, having decreased 1.3% less than 2015. Moreover, the number of seats available by Portuguese airlines was 16.7M in the same period, making the occupancy rate (or passenger load factor) register around 75% while the average industry registers 80.2% (IATA, 2016).
The Portuguese market of civil aviation can be compelled into three companies which dominate it: TAP Portugal SGPS, SATA SGPS and AirAtlantic SGPS.
SATA SGPS is 100% state-controlled while TAP is only 51% controlled and AirAtlantic is 100% private capital equity. Furthermore, each airline has a different strategy and position in the market: SATA is a regional airline that focuses on the Azorean people and on enabling some transatlantic routes between Europe and North America; TAP dominates nationally by establishing itself as a national airline with a European position, with numerous routes to and from almost every European capital, some South America cities and also African cities with historical and demographic ties with Portugal; and AirAtlantic is mostly focused on the charter business.
12
Financially, we can observe a common pattern among two of the three companies (since only SATA and TAP have publicly available information): volatility, low results and high debt. This is a fact that distresses the industry in Portugal, conditioning its sustainability in the short term. Looking at the Profit & Losses’ Statement (P&L) of these Airlines, it is possible to support many conclusions, not only in the final 2016 statement but also on the evolution since 2007. As we can see stated in table 1, SATA Airline’s revenues in 2016 are slightly above €170M while TAP’s are nearly €3.3B. Already by these data, we can assume a clear dominant company in the current market. Then, the EBITDAs of these two airlines are quite low, considering the value of revenues and the industry average, with TAP declaring over +€70M and SATA +€1,7M with the extent that both firms, for the last two years, have been declaring negative results and both are in a positive comeback. Regarding now the statements of financial position, the outlook is again weak and susceptible to hazards. According to table 3, analyzing the evolution of the balance in these airlines:
Table 3. Consolidated Balance of SATA & TAP in 2007, 2015 and 2016.
ANALYSIS OF SATA’S OPERATIONAL TOP LINE
This analysis will compare two periods – the short-run one comparing the last available reported the year 2016 with the previous year 2015 and the long-run one comparing the same last
available report with 2007. In fact, these two periods can give us useful insights about the relative position of the Azorean airline regarding pre-crisis values and current growth rates.
BALANCE (€) SATA TAP SATA TAP SATA TAP
LIABILITIES 254 604 525 2 126 723 000 247 600 644 1 904 344 000 105 312 909 1 920 855 697 DEBT 97 069 093 993 115 000 116 695 464 942 167 000 1 350 371 764 533 044 ASSETS 159 994 753 1 657 086 000 169 135 538 1 374 029 000 138 020 757 1 968 854 286 EQUITY -94 609 772 -469 637 000 -78 465 106 -530 315 000 32 707 848 47 998 589 TRANSITED RESULTS -102 683 278 -647 884 000 -78 463 867 -478 015 000 4 650 945 23 941 975 2016 2015 2007
13
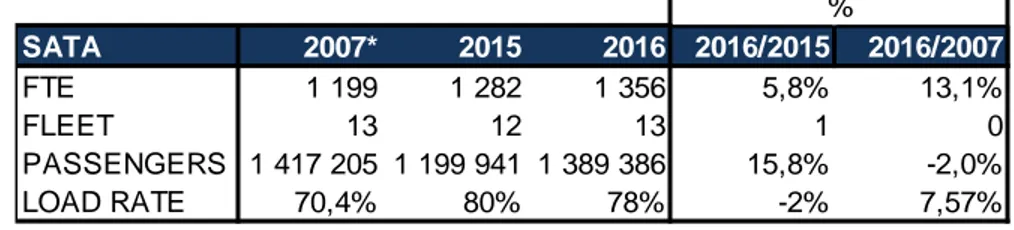
SATA Airlines has 1.356 collaborators in 2016, 5.8% more FTEs than 2015 (1.282 workers) and 13.1% more than 9 years previously in 2007. So, we may infer a 1.38% annual increase of the workforce during 2007-16, thus giving us a conclusive upward variation (see table 4).
Table 4. Consolidated KPIs of SATA Airlines.
Lastly, the load factor is a major key performance indicator (KPI) since it allows us to perceive the operational efficiency of an airline’s routes, mixing a number of passengers transported, routes, aircrafts, flights and size of the aircrafts used.
In SATA’s situation, it has evolved in a positive way going from a load factor of circa 70.4% in 2007 to 78% in 2016 (see table 4). This can say a lot of what has been achieved until now – a positive improvement in the operational efficiency of the airline’s routes. Moreover, SATA is consolidating this ratio since the value in 2014 was the same as in 2016 and in 2015 it registered an even higher load factor. This situation was obtained by a decrease in number of routes, number of flights and a different fleet with another capacity.
By the data we have just analyzed, we can infer an upgrade in terms of operational efficiency since the number of passengers transported per year has decreased during the long-term period in study while the load factor improved. However, the workforce has increased, a factor that may induce a loss of productivity since the revenue per FTE went from circa €175m in 2007 to €127m in 2016.
SATA 2007* 2015 2016 2016/2015 2016/2007
FTE 1 199 1 282 1 356 5,8% 13,1%
FLEET 13 12 13 1 0
PASSENGERS 1 417 205 1 199 941 1 389 386 15,8% -2,0%
LOAD RATE 70,4% 80% 78% -2% 7,57%
*Mix between INT and AA
14
FINANCIAL RESULT
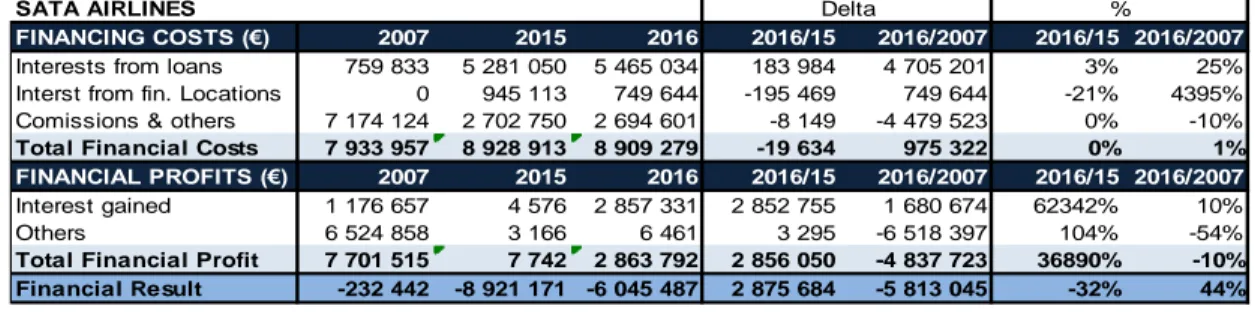
In the end of 2016, SATA airlines registered as financial result over -€6M. This figure is mostly driven by a high value of interest paid from loans, accounting for a cost of nearly €5.5M just in this last fiscal year reported and a decreasing financial profit in the period of study.
Table 5. Consolidated Financial Result of SATA Airlines in 2007, 2015 and 2016.
DEBT ANALYSIS
Looking at SATA’s situation, it registered as total consolidated debt in 2016 almost €161M, less €0.3M than 2015, - 0.2% when compared with the homologous period.
Table 6. Consolidated Debt of SATA Airlines in 2007, 2015 and 2016.
Out of these €161M, 60% was classified as short-term debt. This proportion has changed in comparison with 2015 since there was a higher presence of short-term debt representing over 72%. This heavy figure may imply that the company is highly dependent on external financing to survive since short-term debt usually is used to cover up operational malfunctions.
Nine years earlier, SATA had a different profile in debt proportion, having only circa 40% on short-term, exactly the opposite that happened in 2016. In this period, the short-term debt turned
SATA AIRLINES
FINANCING COSTS (€) 2007 2015 2016 2016/15 2016/2007 2016/15 2016/2007
Interests from loans 759 833 5 281 050 5 465 034 183 984 4 705 201 3% 25% Interst from fin. Locations 0 945 113 749 644 -195 469 749 644 -21% 4395% Comissions & others 7 174 124 2 702 750 2 694 601 -8 149 -4 479 523 0% -10% Total Financial Costs 7 933 957 8 928 913 8 909 279 -19 634 975 322 0% 1%
FINANCIAL PROFITS (€) 2007 2015 2016 2016/15 2016/2007 2016/15 2016/2007
Interest gained 1 176 657 4 576 2 857 331 2 852 755 1 680 674 62342% 10%
Others 6 524 858 3 166 6 461 3 295 -6 518 397 104% -54%
Total Financial Profit 7 701 515 7 742 2 863 792 2 856 050 -4 837 723 36890% -10% Financial Result -232 442 -8 921 171 -6 045 487 2 875 684 -5 813 045 -32% 44% % Delta SATA AIRLINES DEBT 2007 2015 2016 2016-2015 2016-2007 2016-2015 2016-2007 SHORT RUN 4 862 892 116 357 000 96 599 000 -19 758 000 91 736 108 -16,98% 1886,45% LONG RUN 7 568 861 44 777 000 64 224 000 19 447 000 56 655 139 43,43% 748,53% TOTAL 12 431 753 161 134 000 160 823 000 -311 000 148 391 247 -0,19% 1193,65% Delta %
15
into 19 times higher and the long-term over 8 times. For a regional company, this data can prove to be unbearable and SATA is just proving it right.
RESULT ANALYSIS
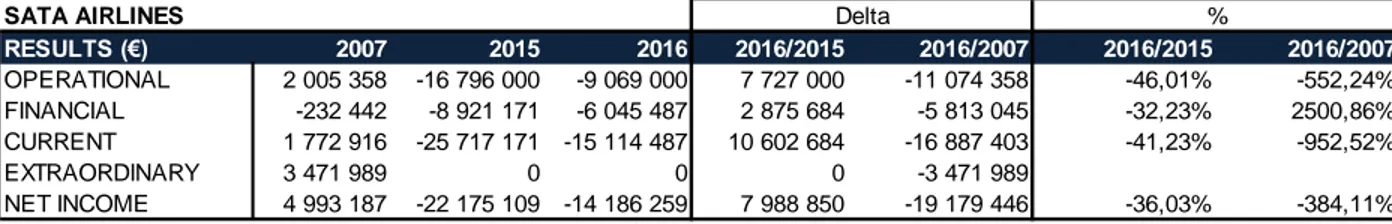
In 2016, SATA presented over -€9M in operational results, though it represents a positive comeback from the worst situation in 2015 when it registered almost - €17M (see table 7).
Table 7. SATA Airlines annual results and evolution.
Again, this shows an attempt to recover out from the negative results the airline is facing. The financial result today sits far from what was the scenario in 2007, having evolved from barely -€0.2M in the beginning to over €6M in 2016, just nine years later.
To sum up, the current result as a combination of the two results presented before follows the same path as them, going recently in an upward direction. SATA Airlines is not being well driven despite the attempt of recovery seen in the financial statements.
VARIATION OF THE FINANCIAL POSITION
Table 8. SATA Airlines consolidated balance in 2007, 2015 and 2016 and respective evolution.
The financial position of SATA Airlines has changed over the years during the period in study. Regarding the Equity, it deteriorated severely, reaching -€94.6M in 2016, which is a sign that the
SATA AIRLINES RESULTS (€) 2007 2015 2016 2016/2015 2016/2007 2016/2015 2016/2007 OPERATIONAL 2 005 358 -16 796 000 -9 069 000 7 727 000 -11 074 358 -46,01% -552,24% FINANCIAL -232 442 -8 921 171 -6 045 487 2 875 684 -5 813 045 -32,23% 2500,86% CURRENT 1 772 916 -25 717 171 -15 114 487 10 602 684 -16 887 403 -41,23% -952,52% EXTRAORDINARY 3 471 989 0 0 0 -3 471 989 NET INCOME 4 993 187 -22 175 109 -14 186 259 7 988 850 -19 179 446 -36,03% -384,11% Delta % Balance (€) 2007 2015 2016 2016-2015 2016-2007 2016-2015 2016-2007 EQUITY 32 707 848 -78 465 106 -94 609 772 -16 144 666 -127 317 620 20,58% -389,26% Transited results 4 650 935 -78 463 867 -102 683 278 -24 219 411 -107 334 213 30,87% -2307,80% Shareholders' equity 18 000 000 18 000 000 18 000 000 0 0 0,00% 0,00% Reserves 244 786 858 528 944 423 85 895 699 637 10,00% 285,82% LIABILITIES 105 312 909 247 600 644 254 604 525 7 003 881 149 291 616 2,83% 141,76% Loans 46 864 450 161 133 971 160 823 735 -310 236 113 959 285 -0,19% 243,17% ASSETS 138 020 757 169 135 538 159 994 753 -9 140 785 21 973 996 -5,40% 15,92% Delta %
16
sustainability of the firm is at stake. It is certain that this evolution is caused by the transited results that the airline has been registering. In 2007 this rubric was +€4.65M while in 2016 it reached - €102.7M, a difference that provides us with the fact that on average the airline lost close to €12M every year during the nine years in study.
The liabilities of the company account for €254.6M in 2016, barely +2.8% than 2015 but over +141.6% when directly compared to 2007. Loans, in particular, have increased on average +14.7% annually which, again, gives the information that it highly contributed to the exponential increase in liabilities as a whole.
On the other hand, SATA’s assets rose during these nine years but much less than would be expected after looking the evolution of the liabilities, rising on average just +1.7% each year in 2007-2016. We may talk about asset stagnation due to its low variation. Nevertheless, in the short run, there has been a cut in assets, bringing the value down.
AIR AÇORES VS INTERNATIONAL ANALYSIS
Firstly, in this detailed comparison and analysis, the period of study is different: eight years instead of nine due to the unavailability of the 2016 reports of SATA International and Air Açores. Instead, the last available reports to be used are from 2015.
Financial Statement Results:
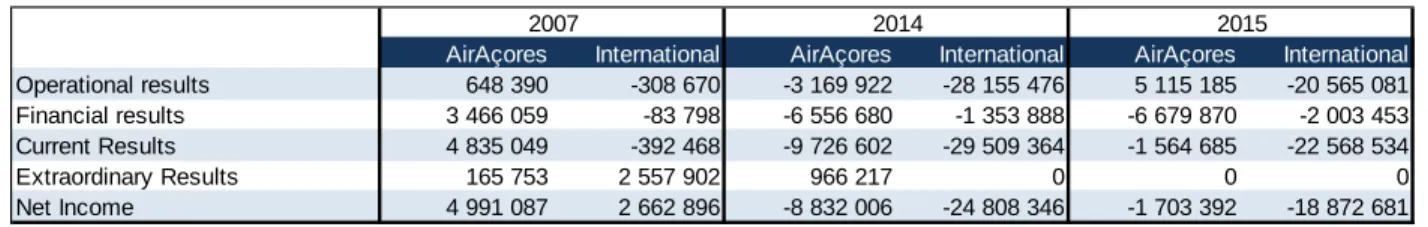
Table 9. Branches' annual results and evolution in 2007, 2014 and 2015.
In the two greatest segments within SATA SGPS, Air Açores (AA) and International (INT) we find disparity regarding the operational results. Although both branches present negative current
AirAçores International AirAçores International AirAçores International Operational results 648 390 -308 670 -3 169 922 -28 155 476 5 115 185 -20 565 081 Financial results 3 466 059 -83 798 -6 556 680 -1 353 888 -6 679 870 -2 003 453 Current Results 4 835 049 -392 468 -9 726 602 -29 509 364 -1 564 685 -22 568 534 Extraordinary Results 165 753 2 557 902 966 217 0 0 0 Net Income 4 991 087 2 662 896 -8 832 006 -24 808 346 -1 703 392 -18 872 681 2007 2014 2015
17
results, they are pushed by different causes since in AA, the negative current result is pushed down by the financial result that sinks the positive operational result achieved while in INT, the current result is mainly pushed by a big loss in the operational result, representing over 91% of the final current result, since both results are negative (operational and financial).
Passengers vs flights vs load factor:
Table 10. Branches' KPI in 2007, 2014 and 2015.
INT’s passengers figure is 40% higher than AA’s. At the same time, the respective load factor for INT and AA was 81% and 69%. The sense is that in the short-run, AA is gathering more customers while INT is losing them, while at the same time, both branches are becoming more efficient on their flights. Furthermore, compared with 2007, INT transports now less 170.000 passengers while AA transports 52.000 more. Out of this data, it can be assumed that both branches are improving operational efficiency in their flights, but INT is losing clients whilst Air Açores is gaining. On average, AA increased its number of passengers by 1.3% annually while INT lost 2.5% each year. Operational Revenues & Costs Analysis:
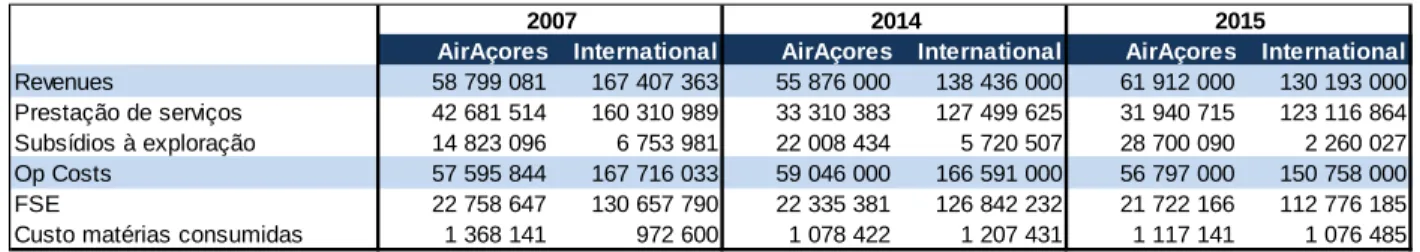
Table 11. Main rubrics of operational revenues and costs from SATA's two main branches in 2007, 2014 and 2015.
The sustainability of an airline must be measured also by its capability to sustain itself operationally. It is possible to assume that Air Açores is unable to be sustainable without public
AirAçores International AirAçores International AirAçores International
Passangers 487 121 930 084 474 490 796 026 539 188 760 792
Fleet 6 7 6 8 6 6
Occupancy rate 65% 75% 62% 79% 69% 81%
Flights 14 569 7 139 11 393 5 863 11 996 5 597
2007 2014 2015
AirAçores International AirAçores International AirAçores International
Revenues 58 799 081 167 407 363 55 876 000 138 436 000 61 912 000 130 193 000 Prestação de serviços 42 681 514 160 310 989 33 310 383 127 499 625 31 940 715 123 116 864 Subsídios à exploração 14 823 096 6 753 981 22 008 434 5 720 507 28 700 090 2 260 027 Op Costs 57 595 844 167 716 033 59 046 000 166 591 000 56 797 000 150 758 000
FSE 22 758 647 130 657 790 22 335 381 126 842 232 21 722 166 112 776 185
Custo matérias consumidas 1 368 141 972 600 1 078 422 1 207 431 1 117 141 1 076 485
18
subsidies. Regarding operational costs, the cost of provided services is the major player with 38.3% and the cost of consumed well barely 2% out of the total of €56.8M spent operationally. INT, on the other hand, reported a negative operational result and that was mainly driven by a huge level of costs. In costs, the cost of provided services is again the major player with 74.8% of the total while the cost of consumed goods just 0.7%, totalizing €150.8M.
On average, AA increased annually 0.65% its revenues in the period of study while dropped -0.17% its operational costs. On the other side, INT dropped, on average, -3.1% its revenues each year and -1.3% its operational costs in 2007-2015.
Fleet Analysis:
Table 12. Fleet composition in 2007, 2014 and 2015 in SATA International and Air Açores.
What we can retain from these data is two main things: total renovation of AA’s fleet and the decrease of the absolute number of aircrafts serving INT and the whole company.
Additionally, to fully understand the composition of the fleet, it is crucial to comprehend on which basis the aircrafts belong to the airline. In SATA Airlines there are three types of aircraft possession: Full ownership, operational leasing1 and financial leasing2. The following tables
1 Operational Leasing: contract that grants the lessee the use of an asset but not the ownership and nor its value or its future rent payments are accounted in the balance sheet of the lessee’s firm.
2 Financial Leasing: Similar to an operational leasing but with a purchase option (or in the end of the contract, the asset is transferred to the lessee), the lease life exceeds at least 75% of the economic life of the asset or the present value of the lease payment exceeds 90% of the true market value of the asset in question.
Fleet Model AA INT AA INT AA INT
AIRBUS A320 4 4 3
A310 3 4 3
BRITISH AEROSPACE ATP 5
DORNIER D228 1
BOMBARDIER Q200 2 2
Q400 4 4
TOTAL 6 7 6 8 6 6
19
represent the situation of SATA’s two commercial branches in terms of aircraft possession:
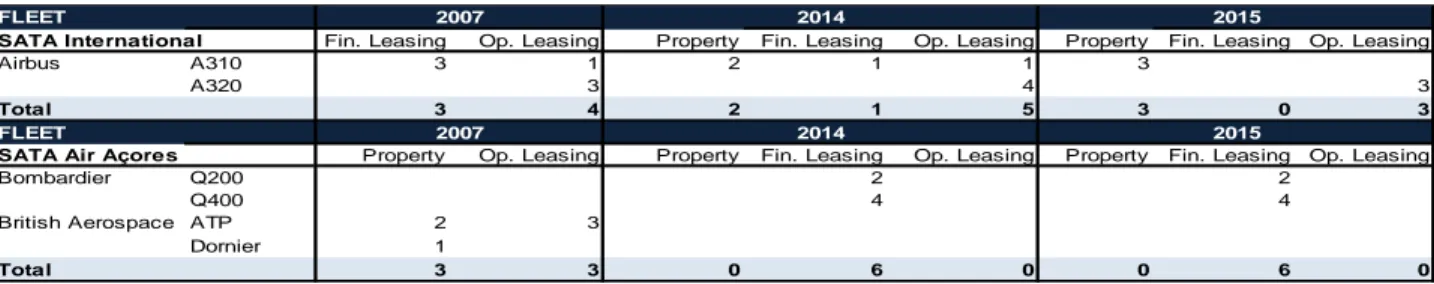
Table 13. Both branches' composition and financing.
In 2007, it is possible to see that INT was fully dependent on external leases to be able to provide its flight services while nine years later the international branch already owned three aircrafts and the other three are on operational leasing. AA replaced its whole fleet in 2010 by contracting six financial leases for six Bombardier aircrafts. What we see, on average, is that the company continues to depend on external leasing to use its aircrafts, in a worse representation than in 2007. What this brings is that the company must support a high level of interest and rent payments which push the airline's results down.
The value of financial leases for SATA International accounted for the following aircrafts in the studied period:
Table 14. SATA International's financial locations rent due in 2007, 2014 and 2015.
Lately, INT has increased sharply its responsibilities, in particular, in Airbus A320s. Moreover, the company has raised its responsibilities mostly on medium-term going from €8.2M in 2007 to €54.3M in 2015.
FLEET
SATA International Fin. Leasing Op. Leasing Property Fin. Leasing Op. Leasing Property Fin. Leasing Op. Leasing
Airbus A310 3 1 2 1 1 3
A320 3 4 3
Total 3 4 2 1 5 3 0 3
FLEET
SATA Air Açores Property Op. Leasing Property Fin. Leasing Op. Leasing Property Fin. Leasing Op. Leasing
Bombardier Q200 2 2
Q400 4 4
British Aerospace ATP 2 3
Dornier 1 Total 3 3 0 6 0 0 6 0 2015 2007 2007 2014 2014 2015
Liability value - Financial leasings ($)
SATA International <1 years 1-5 years <1 years 1-5 years <1 years 1-5 years
Airbus A310 2 220 000 1 850 000 0 0 0 0
Airbus A320 9 000 000 6 365 000 7 174 000 5 347 833 7 134 000 35 599 000
Airbus A330 0 0 0 0 4 440 000 18 685 000
Total 11 220 000 8 215 000 7 174 000 5 347 833 11 574 000 54 284 000
20
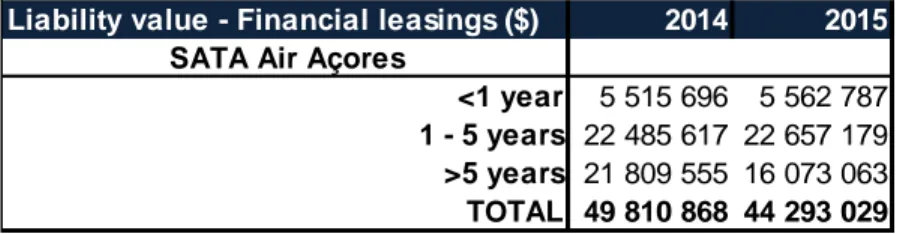
Table 15. Liability value of the financial locations of SATA Air Açores in 2014 and 2015.
On the other hand, we can observe that AA had no financial leases in 2007 but that situation changed after May 2010 when it renewed its whole fleet with the purchase in terms of financial leasing of six bombardiers. The value in the balance’s liability that respect to this operation accounted for almost €50M in 2014 and circa €44M in 2015, a value that proves to be too high in order for the company to stay sustainable. Additionally, this brings no sustainability gains whatsoever. What stays as a rhetorical question is why these aircrafts and not others? According to the market, there are airplanes that consume less than Bombardier. Moreover, why not helicopters like the case we will see of Air Greenland?
COMPARABLE AIRLINE
Air Greenland
Air Greenland (AG) is the flagship airline of Greenland, Denmark. Greenland, as the Azores, is an autonomic region with local power. Its population accounts for slightly more than 55.000 people in 2016 and its economy is supported mainly by fishing and mining.
The Greenlander airline belongs 37.5% to the Greenland autonomic government, 25% to the Danish Government and 37.5% to the Scandinavian Group SAS. This composition is also similar to SATA Airlines since it is also detained by public governments. As for SATA, Air Greenland must also perform public duty and preserve public routes within Greenland and also between Greenland and the mainland Denmark, exactly as SATA’s situation.
Liability value - Financial leasings ($) 2014 2015
SATA Air Açores
<1 year 5 515 696 5 562 787 1 - 5 years 22 485 617 22 657 179 >5 years 21 809 555 16 073 063 TOTAL 49 810 868 44 293 029
21
Currently, the Greenlander airline has 14 domestic destinations and 2 international (Iceland and Denmark). Regarding its fleet, it owns one large aircraft, an Airbus A330, one medium and seven small aircrafts. Besides, it has also included in its fleet 19 helicopters with small to medium capacity.
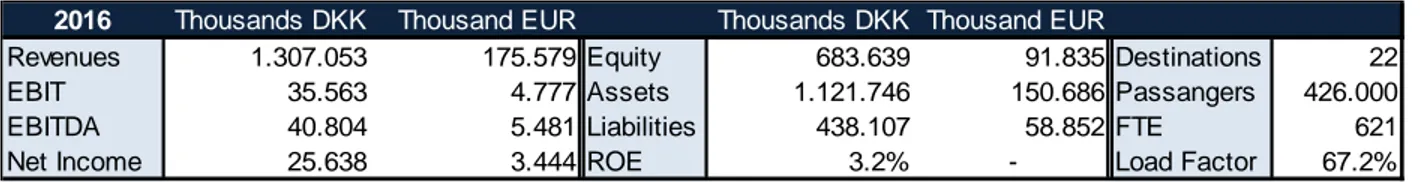
Financially, the airline is in apparently good shape as the following table shows:
Table 16. Key Information about Air Greenland in 2016 in DKK and €3.Conversion rate.
Air Greenland presents positive figures on all fronts, having a positive return on equity, EBIT, EBITDA and Net Income. Furthermore, its balance is equilibrated, being declared a strong figure of the equity of circa €92M. All these facts enable us to infer that even though the load factor of an airline is low, it can take some profit out of its operations. It is worth mentioning that although AG is state-controlled, it does not receive any type of subsidies for its operations. What can be concluded from this example is that it is possible and executable for a regional airline to be sustainable without subsidies and even with low load factor. This means that what drives this result is its fleet mainly composed of helicopters. They require less maintenance and are less costly than a conventional aircraft, pushing also the fuel consumption down.
Moreover, AG presents as debt, approximately over €0.7M in 2016, being all of this debt due in five or more years. With this, it can be obtained as an outcome, the fact that since AG has no debt in the short term, it has no operational malfunctions as SATA presents. Apart from this, AG has an operational lease obligation of slightly over €1.1M due in 2016-2019, whilst €0.5M has to be
3 Conversion Rate: 1 DKK = 0.134332 (26.12.2017)
2016 Thousands DKK Thousand EUR Thousands DKK Thousand EUR
Revenues 1.307.053 175.579 Equity 683.639 91.835 Destinations 22
EBIT 35.563 4.777 Assets 1.121.746 150.686 Passangers 426.000
EBITDA 40.804 5.481 Liabilities 438.107 58.852 FTE 621
22
paid within one year (in the short term). This lease obligation is originated from the sole Airbus A330 that the airline owns. This management decision comes from the possibility that this big aircraft may not be used in the close future due to regional airports’ upgrade in Greenland.
CONCLUSIONS
Poor financial and operational status
In the studied period, it can be seen that the three main subareas of the balance have suffered some major alterations that resulted in a worse financial position in 2016. As a matter of fact, for instance, in assets, cash has gone from a value of €42.3M in 2007 to barely €6.7M in 2016, fact that enlighten us the downgrading of SATA’s financial position since now it is less capable of protecting itself against unforeseen situations and to activate growth measures without the help of external financial help. In 2007, SATA’s non-current assets represented the biggest slice with 72.6% of the total asset value while in 2016 this percentage was only 42.3%. This data is quite important since it states the value that has the biggest probability of turning into results in the short-run.
Regarding liabilities, those are today bigger than total assets, a fact that easily leads to questions about the firm’s sustainability. By looking at the current liabilities, we see another alarming fact – 2007’s current liabilities represented 38.2% of total liability while in 2016 it represents 71.0%. Besides, the amount of current debt has increased sharply which makes the management of the airline even more unsustainable to this date.
Lastly, equity is perhaps what is more alarming. It evolved from a positive figure in 2007 of €32.7M to an astonishing negative value of -€94.6M greatly due to a drop in retained results. Inferring from it, this may be a crucial indicator for possible bankruptcy.
23
In terms of productivity, the average revenue per employee has dropped almost €50m (-27.6%) per FTE to circa €127m in nine years. Although revenues have been decreasing, the workforce has gone up without any reasonable cause such as an expansion, deepening the loss of general productivity and consequently sustainability.
From these results, we can also compute ratios such as ROE and ROA that give us insights about the profitability of a company. SATA’s ROE and ROA are, respectively, -15% and -8.9% in 2016. As a company, the management is far from using the shareholders’ money correctly, since the ROE is deep below zero. This fact can be easily justified with the airline being owned by the government and, therefore, there is little focus on profit making. ROA enables us to infer about how much is the firm making out of its resources. In SATA’s case, it is extremely poor since the firm loses money. This leads us to the basic conclusion that SATA, as a group, is totally unsustainable and it is only sustained by Government financial support.
Fleet disproportion
From what we gathered from SATA and Air Greenland, some outcomes can be drawn: fleet disproportion. From what is known, large aircrafts like Airbuses consume more fuel and need more maintenance than a smaller one, apart from being extremely more expensive. In 2016, SATA Airlines had seven airbuses and six bombardiers but SI performed around 5.600 flights while AA 12.000, more than double. The proportionality is not balanced and is forcing the airline to enormous costs which in reality does not need. It is particularly interesting that although AA has to perform more than double the flights INT does, with a lower load factor, it is able to make an operational profit in 2015 while INT sinks into -€20.6M. Misleading managerial choices of the fleet is perhaps the rock that keeps pushing SATA down as a group and will continue to do so if nothing changes in run short-run. Wiser decisions on fleet such as less or less-costly aircrafts would
24
certainly make the airline thrive just like the example of Air Greenland that, even though in a smaller scale, focus its operation in regional flights and offers international flights through its sole large aircraft, an A330.
SATA Açores’ sustainability
On the other hand, the national branch of the airline, Air Açores, has proven to have the capability of being sustainable not only in the short but also in the long-run. Regarding the operational, financial and current result, SATA Air Açores proves to be sustainable. If it was not because of the heavy financial result the Group bears, this branch would be not only sustainable but also profitable. This branch has the potential to be even more profitable if its fleet is redesigned. Looking at Air Greenland example, helicopters can be a surprising alternative for regional air transportation in low load factor areas. A different fleet may bring more efficiency, not only in terms of fuel consumption, maintenance and acquisition costs.
On the other hand, SATA International proves to be the one that presents the most unsustainable state. In 2015, this branch presented a negative figure in retained results of -€86.3M downgrading its position since 2007 (also negative). It can be seen that current assets have relatively decreased while current liabilities have increased sharply, going towards a more unsustainable estate. When looking at the operational, financial and current results, this branch proves again unsustainable since none of these managed to stay above zero nor in 2007 or 2015. Thus, there is no sign that shows any chance of sustainability on INT at any level.
REFERENCES
Zoltaszek, Agata and Pisarek, Renata. 2016. “Effectiveness of National Airlines in Europe – The DEA Approach”. University of Szczecin Working Paper 111-114
25
Socha and Kavka and Necas. 2011. “Airlines Privatization Aspects”. Harry Coanda Air Force Academy Scientific paper 1186-1189
Member states of ECAC and EU and European Commission. 2003. “European Experience of Air Transport Liberalization”. Paper presented at the ICAO Conference on Air Liberalization 1-9 Teles, S. 2014. “Critérios determinantes na formulação e na implementação da estratégia no sector do transporte Aéreo”. PhD Paper iii-vi and 275-279
Hayek, Friedrich. 1994. “The road to Selfdom”. University of Chicago Press p.42
Winch, D. 1989. “The political power of economic ideas: Keynesianism across Nations”. Princeton University Press pp. 107-127
Spurling, D. 2010. “Introduction to aviation Economics. Demand, Cost, Pricing and Adoption”. Universal Publishing pp. 257-266
Harrod, R.F. 1939. “Essay in Dynamic Economics”. Blackwell Publishing for the Royal Economic Society. The Economic Journal, Vol 49 No 193. pp 14-33
Hirshmann, A. 1958. “The strategy of Economic Development”. Yale University Press pp.167-190
Marques, R. 2015. “The Future of Airline Business Models: Which Will Win?”. Nova School of Business and Economics Masters Dissertation pp. 41-66
SATA Airlines Consolidated Annual Report. 2016. SATA Airlines Website SATA Airlines Consolidated Annual Report. 2007. SATA Airlines Website
SATA Air Açores & SATA International Annual Report. 2015. SATA Airlines Website SATA Air Açores & SATA International Annual Report. 2007. SATA Airlines Website Air Greenland Annual Report. 2016. Air Greenland Website (retrieved on 30.12.2017)