Joana Lapão Rocha
Capacidade de absorção de uma suspensão
aditivada de pedra calcaria
Joana Lapão Rocha
Capacidade de absorção de uma suspensão
aditivada de pedra calcaria
Dissertação apresentada à Universidade de Aveiro para cumprimento dos requisitos necessários à obtenção do grau de Mestre em Engenharia do Ambiente realizada sob a orientação científica do professor Luís António da Cruz Tarelho, Professor Auxiliar do Departamento de Ambiente e Ordenamento da Universidade de Aveiro.
o júri
presidente Professor Doutor António José Barbosa Samagaio
Professor associado do Departamento de Ambiente e Ordenamento da Universidade de Aveiro
vogais Professor Doutor Luís António da Cruz Tarelho
Professor auxiliar do Departamento de Ambiente e Ordenamento da Universidade de Aveiro
Professor Doutor João António Labrincha Batista
Professor associado do Departamento de Engenharia Cerâmica e do Vidro da Universidade de Aveiro
agradecimentos Agradeço, em primeiro lugar aos meus orientadores ao professor Pavel Machac ao professor Luís Tarelho, pela disponibilidade oferecida assim como pelas orientações científicas.
Da mesma forma, agradeço também ao Pedro pela toda ajuda oferecida durante o decorrer do trabalho.
Aos meus pais que muita força me deram durante todo o percurso escolar. Um muito muito obrigado.
A todos os amigos que estiveram presentes, que muito ajudaram quando o trabalho parecia lutar comigo.
Um especial obrigado aos amigos, Carla, Pipas, Anita, Rubi, e claro a Charlie que me acolheram, dando me um confortável local para trabalhar nos momentos que anteciparam a entrega da tese.
Um especial obrigado as amigas que me acompanharam nas noitadas de trabalho, porque por vezes sem elas não seria possível de o realizar.
E as amigas Pipas e Carla por me ajudar com o que menos gosto, merecem um enorme obrigado pela grande simpatia e disponibilidade.
E também um grande obrigado ao joãozinho por a ultima revisão dada e também pela companhia de sextas á noite.
palavras-chave Dessufurização de efluentes gasosos, dióxido de enxofre, pedra calcária, absorção.
resumo Este trabalho apresenta os resultados das pesquisas relativas à capacidade de absorção de suspensões de calcário aditivado, com base na revisão de
literatura e da aplicação de modelos matemáticos específicos.
Neste trabalho estão resumidas informações sobre a evolução histórica das emissões de enxofre na República Checa assim como também uma abordagem global. São apresentadas as legislativas validas relativas as emissões de dióxido de enxofre.
Além disso, com base na pesquisa teórica são apresentadas informações sobre as tecnologias disponíveis e utilizadas para reduzir o conteúdo de enxofre nas emissões.
São mostradas tecnologias primárias de dessulfurização (por dessulfurização de carvão ou gás energético), bem como tecnologias secundárias de
dessulfurização do gás de combustão.
Para o processo húmido de dessulfurização (usando calcário) é dedicado um capítulo separado devido a extensiva informação recolhida que incluem (excepto caracterização de aparelhos tecnológicos) informações sobre o processo e parâmetros já feito sobre as experiências com aditivos.
Na parte experimental é descrita o método usado no laboratório para avaliar a eficiência de remoção de dióxido de enxofre, por suspensões calcárias com diferentes concentrações de aditivos com um reactor em regime descontínuo. É dedicada atenção a uma série de aditivos especialmente os orgânicos (di) ácidos com o objectivo de concluir qual a sua influência e adequação ao uso industrial.
Os dados medidos foram avaliados e organizados em tabelas e gráficos que, em detalhe, se discutiu a comparação dos resultados obtidos para cada parâmetro.
O conjunto de dados recolhidos em laboratório espera se serem capazes de ajudar no problema de dessulfurizacao húmida dos gases de combustão.
keywords Wet flue gas desulphurization, sulphur dioxide, limestone, absorption, organic acids
abstract This work presents the results of research concerning the absorption ability of additived limestone suspension, based on the literature review and the application of specific mathematical models.
In this work is summarized information about historical development of sulphur emissions in Czech Republic as in a global approach.
Here is adumbrated the valid legislative concerning sulphur dioxide emissions. Further, is in the form of summarized literary background research, and information about available technologies used for reducing the sulphur
emissions. Here are shown “prime” technologies (for desulphurization of coal or energetic gas) as well as “secondary” technologies desulphurization of
combustion gas.
For wet flue gas desulphurization (using limestone) is devoted a separated chapter due to its extensiveness that include (except characterization of technological apparatus) available information about the process parameters and about already done experiments with additives.
In the experimental part is described the sample base and the built-up laboratory device for measurement of “breakthrough curves of SO2 of absorptive suspension on batch reactor.
The attention is devoted to the series of additives specially the organic
(di)acids with the aim to pass judgment on its influence and fitness to industrial use.
The measured data was first evaluated and than well-arranged graphs and tables, in detail, discussed by comparison of results for every parameter. Data collection obtained on the laboratory work is able to help on the problem of wet flue gas desulphurization method.
2 Theoretical Framework ... 3
2.1 Legislation in the Czech Republic for the protection of air quality... 3
2.1.1 Existing provisions... 3
2.1.2 Sulphur dioxide emission limits ... 5
2.1.3 Emission limits for solid fuels ... 5
2.1.4 Emission limits for liquid fuels... 6
2.1.5 Emission limits for gas-fired sources ... 7
2.2 Categorization of sources of air pollution ... 8
2.3 Sulphur dioxide ... 9
2.3.1 Sources of sulphur dioxide ... 10
2.3.2 Impact of sulphur dioxide on the environment... 11
2.3.3 Evolution of sulphur dioxide emissions ... 14
2.3.3.1 Global emissions of sulphur ... 14
2.3.3.2 Emissions in the Czech Republic... 17
2.4 Desulphurization processes... 19
2.4.1 Coal desulphurization ... 19
2.4.1.1 The physical separation of pyritic sulphur... 19
2.4.1.2 Myer process ... 20
2.4.1.3 Gravimelt process... 20
2.4.1.4 Biological sulphur removal ... 20
2.4.2 Flue gas desulphurization ... 21
2.4.2.1 Rectisol ... 21
2.4.2.2 Flue gas desulphurization ... 22
2.4.2.3 Dry methods ... 23
2.4.2.3.1 Flue gas desulphurization using limestone in pulverized coal boilers... 23
2.4.2.3.2 Active soda ... 24
2.4.3 Semi dry lime method... 25
2.4.4 Wet methods ... 25
2.4.4.1 Lime-sludge suspension type ... 25
2.4.4.2 Lime-gypsum suspension type ... 26
2.4.4.3 Limestone - gypsum suspension type... 26
2.4.5 Regenerable processes ... 27
2.4.5.1 Sodium sulphite process ... 27
2.4.5.2 Magnezit process... 27
2.4.5.6 The dual alkali process...29
2.4.5.7 The Walther & Cie...29
2.4.5.8 Biological flue gas desulphurization (BIO-FGD) ...29
2.5 Wet limestone method ...30
2.5.1 Technology of wet desulphurization using limestone...31
2.5.2 Smoke stack ...32
2.5.3 Heating and combustion ...32
2.5.4 Wet scrubber ...33
2.5.5 Centrifugal pumps ...35
2.5.6 Fans ...35
2.5.7 Waste water from the wet limestone methods ...35
2.6 Parameters affecting the desulphurization process ...35
2.6.1 Limestone...38
2.6.1.1 Physicochemical properties of limestone...39
2.6.2 Limestone bearings in the Czech Republic ...41
2.6.3 Limestone dissolution and SO2 absorption ...45
2.6.4 Gypsum ...50 2.6.4.1 Gypsum establishment...50 2.6.4.2 Destination of gypsum ...51 2.6.5 Action additives...51 2.6.5.1 Organic additives ...52 2.6.5.1.1 Organic acid ...53
2.6.5.1.2 The action of organic acids ...53
2.6.6 Consumption and the economics of additives...54
2.6.7 Degradation of additives...55
2.6.8 The influence of additives on the operation ...57
2.6.9 Additives used to inhibit the oxidation of sulphites ...58
2.7 Limestone suspension with the use of additives...58
3 Experimental framework...61
3.1 Analytical methods and devices used ...61
3.1.1 SO2 analyser Servomex Xentra 4900 ...61
3.1.2 X-ray fluorescence analysis of solids ...61
3.1.2.1 X-ray spectrometer ARL XP 9400 +...62
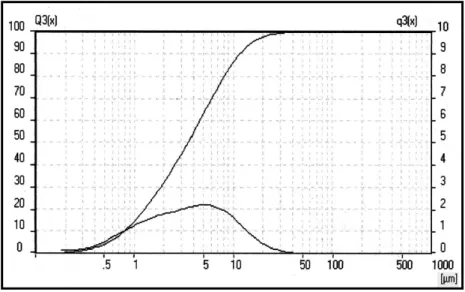
3.1.3 Laser granulometry ...62
3.1.3.1 Laser particle size analyzer - Analysette 22 ® ...62
3.3 The additives (organic acids) ... 66
3.4 Test gases ... 67
3.5 Measuring limestone solubility in water... 68
3.6 Limestone dissolution in the presence of additives ... 69
3.6.1 Device ... 69
3.6.2 Measurement procedures... 70
3.6.3 Results and discussion ... 71
3.7 SO2 absorption in limestone slurry ... 75
3.8 Infrastructure ... 76
3.8.1 Experimental procedure ... 80
3.8.2 Experimental results computing and discussion... 81
4 Conclusions ... 103
Figure 1 - Global and regional sulphur emissions in the period between 1850 to 2000. ... 14
Figure 2 - Regional sulphur emission trends between the 80s and 90s of the 20th century ... 15
Figure 3 - Sulphur dioxide emissions in the countries of the EEA-32. ... 15
Figure 4 - Change (%) in the sulphur dioxide emissions in each sector from 1990 to 2005 for EEA-32. ... 16
Figure 5 - Global sulphur emissions... 16
Figure 6 - Sulphur dioxide emission variations from 1850 to 2000... 17
Figure 7 – Sulphur dioxide total emissions in Czech Republic and Slovakia from 1840 to 1994. ... 18
Figure 8 – SO2 emissions evolution from 1990 to 2003 in the Czech Republic... 18
Figure 9 – Desulphurization unit with shower absorber diagram. ... 31
Figure 10 – Typical coal powered thermal plant design... 32
Figure 11 – Wet scrubber ... 34
Figure 12 – The decrease on the sulphur dioxide concentration by increasing L/G ratio... 36
Figure 13 – Decrease in SO2 concentration according to absorber’s height... 37
Figure 14 - Degree of desulphurization and unreacted limestone in gypsum and on the absorber’s pH as a result of the addition of adipidic acid. ... 37
Figure 15 – Limestone mining sites in the Czech Republic. ... 43
Figure 16 – Limestone solubility according to CO2 pressure... 45
Figure 17 – Dissociation degree of absorption suspension. ... 47
Figure 18 – Sulphur dioxide absorption profile during the gas-liquid phase. ... 47
Figure 19 – Concentration profile during liquid-solid phase ... 48
Figure 20 – Limestone dissolution speed at various pH and CO2 out pressure... 48
Figure 21 – pH dependence of calcite speed dissolution]... 49
Figure 22 – Gypsum precipitation according to relative saturation ... 50
Figure 23 – Action mechanism of dicarboxylic acids... 53
Figure 24 – Adipic acid degradation... 56
Figure 25 – Inhibition of adipic acid decomposition by chloridic acid... 56
Figure 26 – Granulometric analysis of grinded limestone Čertovy schody. ... 64
Figure 27 – Granulometric analysis of pure CaCO3. ... 64
Figure 28 – Granulometric analysis of grinded pure CaCO3... 65
Figure 29 – Limestone solubility on water... 68
Figure 30 – Apparatus diagram for measuring limestone dissociation. ... 70
Figure 31 – Limestone conversion compared with CaCO3.... 71
Figure 32 – The influence of temperature on limestone conversion. ... 72
Figure 36 – Pure CaCO3 conversion with and without maleic acid at different pH...75
Figure 37 – A schematic diagram of sulphur dioxide absorber reactor. ...76
Figure 38 - Diagram apparatus to measure SO2 absorption...77
Figure 39 – Part of the apparatus located on the hood...78
Figure 40 – Servomax xentra 4900 analyser...78
Figure 41 – Detail of the reactor...79
Figure 42 – Detail of water condenser. ...79
Figure 43 – Mixing suspension detail...80
Figure 44 - Example of measured data. ...82
Figure 45 – Measurement with empty reactor and with blank. ...83
Figure 46 – Comparison between limestone and distilled water...83
Figure 47 – Absorption ability of limestone, pure CaCO3 and pulverized pure CaCO3...84
Figure 48 – Influence of glutaric acid on absorption of SO2 by pure CaCO3 suspension...86
Figure 49 – Influence of the addition of adipic acid to CaCO3 suspension. ...88
Figure 50 – Influence of the addition of citric and oxalic acid to limestone suspension. ...89
Figure 51 – Impact of malonic and jantaric acid to limestone suspension. ...91
Figure 52 – Impact of adipic and glutaric acid on the limestone absorption capacity ...93
Figure 53 – Influence of maleic acid on absorption ability of limestone suspension. ...95
Figure 54- Influence of adipic acid on limestone suspension absorption. ...96
Figure 55 – Impact of complexon III on desulphurization ability of limestone suspension. ...98
Figure 56 – Influence of acetic, formic and propionic acid on the absorption limestone suspension. ...99
Table 1 - Sulphur dioxide emission limits. ...5
Table 2 - Sulphur dioxide emission limits for solid fuels. ...5
Table 3 - Sulphur dioxide emission limits for new future solid fuels. ...6
Table 4 - Sulphur dioxide emission limits for liquid fuels. ...6
Table 5 - Sulphur dioxide emission limits for new liquid fuels...7
Table 6 - Sulphur dioxide emission limits for new future liquid fuels ...7
Table 7 - Sulphur dioxide emission limits for existing resources for gaseous fuels. ...7
Table 8 - Sulphur dioxide emission limits for gas fired sources ...8
Table 9 - Sulphur dioxide emission limits for new gas fired sources ...8
Table 10 - Comparison of specific sulphur content in black and brown coal. ...11
Table 11 – Typical deposition speed...11
Table 12- Estimated sulphur dioxide emissions in the 21st century. ...17
Table 13 – Total sulphur dioxide emissions according to source type...19
Table 14 - Comparison of desulphurization efficiency of different methods. ...26
Table 15 – Limestone distribution into classes according to CSN 721217. ...40
Table 16 – Limestone mining in the Czech Republic. ...44
Table 17 – Consumption of lime for the protection of the environment...45
Table 18 – Limestone consumption for the protection of the environment...45
Table 19 – Composition of industrial and natural gypsum...51
Table 20 – Granulometric analysis of limestone and pure CaCO3. ...64
Table 21 – Granulometric results from grinded pure CaCO3...65
Table 22 – Samples BET surface and pores volume. ...65
Table 23 - Čertovy Schody limestone and pure CaCO3 composition ...66
Table 24 – Characteristics of organic acids...67
Table 25 – SO2 absorption by distilled water. ...84
Table 26 – Absorbed sulphur dioxide mass, and the amount of CaCO3 reacted and converted. 85 Table 27 – Desulphurization efficiency for limestone and the two samples of CaCO3 (pure and pulverized). ...85
Table 28 - Absorbed sulphur dioxide mass, and the amount of CaCO3 reacted and converted. 86 Table 29 - Desulphurization efficiency of CaCO3 suspension with glutaric acid. ...87
Table 30 - Absorbed sulphur dioxide mass, and the amount of CaCO3 reacted and converted. 88 Table 31 – Desulphurization efficiency with the addition of adipic acid...88
Table 32 - Absorbed sulphur dioxide mass, and the amount of CaCO3 reacted and converted. 90 Table 33 – Desulphurization efficiency of absorption suspension with the addition of oxalic acid. ...90
... 92 Table 36 - Absorbed sulphur dioxide mass, and the amount of CaCO3 reacted and converted. 93 Table 37 - Desulphurization efficiency of limestone suspension with the addition of glutaric acid. ... 94
Table 38 - Absorbed sulphur dioxide mass, and the amount of CaCO3 reacted and converted. 95 Table 39 - Desulphurization efficiency of limestone suspension with the use of maleic acid.... 95 Table 40 - Absorbed sulphur dioxide mass, and the amount of CaCO3 reacted and converted. 97 Table 41 - Desulphurization efficiency of limestone suspension with the use of adipic acid... 97 Table 42- Absorbed sulphur dioxide mass, and the amount of CaCO3 reacted and converted.. 98 Table 43 - Desulphurization efficiency of limestone suspension with the addition of complexon III. ... 98
Table 44 - Absorbed sulphur dioxide mass, and the amount of CaCO3. reacted and converted.99 Table 45 - Desulphurization efficiency of limestone suspension with the addition of
d
S
Specific sulphur content in dry state [% wt]r
S Sulphur content in original state [% wt]
r t
W Water content in original state [% wt.]
r i
Q Heat value of the fuel in its original state [MJ.kg
-1 ] Vg Settling speed [m.s -1 ] W Wet deposition -
L/G Ratio between scrubbing liquid flow and gas flow -
µ Oversaturation degree -
A Activity ions -
K Product solubility -
[CaCO3] Calcium carbonate concentration [mol.dm
-3
] [H+
] Concentration of hydrogen ion [mol.dm
-3
]
Ssp Specific surface area [m
2
.g]
Ka Dissociation constant -
EDTA ethylenediaminetetraacetic acid -
BET Surface adsorption modelof solid substances
Brunauerem, Emmetem Tellerem
- 0
V& Gas flow [m
3 /s] r
V
Reaction volume [m3]τ
Time [s] 0 iy Entering SO2 concentration on gas phase (g) [mol/m3]
i
y SO2 concentration on gas phase(g) [mol/m3]
i
x SO2 concentration on liquid phase (l) [mol/m
3 ] N Order of reaction -
[
3]
2 mg.m− SO C SO2 concentration [mg.m -3 ] [ppm] SO C 2 SO2 concentration [ppm][
1]
2 g.mol− SOM SO2 molecular mass [g.mol-1]
des
η
Desulphurization efficiency [%] C0 Inlet concentration [mg.m -3 ] C1 Outlet concentration [mg.m -3 ]1
Introduction
Throughout the history of humankind, changing lifestyles, the need to improve the quality of life and encourage economic progress have been accompanied by a growing need for energy.
Usually, the need for energy requires means of combustion which, in turn, result in the release of substances into atmosphere, which affect the environment negatively. Until the ideal clean energy/technology is found, current solutions need to be improved.
Today, wet flue gas desulphurization has a dominant role in the desulphurization processes, in the thermal power plants that use coal as their energy source, releasing sulphur oxides from the burning chamber. The main advantage of wet flue gas desulphurization over other desulphurization combustion technologies is especially the high efficiency throughout the process. This technology is capable of reaching the increasing stringent emission limits, allowing it to consolidate its position as the most popular technology in the world, in this area, although high efficiency can mean high investment and operating costs. Increasing the efficiency of this method, leading to a decrease the investment and operating costs (designing a new facility) or extending the lifetime of the older equipment (which is no longer capable of reaching the stringent emission limits), it is certainly, at least from a financial perspective, an idea worth exploring.
One way of increasing the efficiency of the wet flue gas desulphurization method lies in the application of additives into the limestone suspension. Additives can be divided into two categories: organic and inorganic, depending on their chemical structure. The inorganic additives used are salts, mostly magnesium. The disadvantage of these
additives is their sensitivity to ions Cl- and F- ion the flue gas. When these additives are
used, it is necessary to guarantee the removal of the chloride and fluoride before the absorption, given that they can react, hence closing the porous surface of limestone, by forming aluminium chloride and aluminium fluoride.
This work focuses on the wet flue gas desulphurization with the application of organic acids.
2
Theoretical Framework
The problem of SO2 emissions started in the 70s, during the 20th century. The first
desulphurization technology was installed in Japan and in the USA, later being implemented in other countries.
Considering that in the Czech Republic energy requirements are catered for through the burning of coal, mostly brown coal (with a high sulphur content), environmental concerns led to the implementation of desulphurization systems in the power plants.
In this section, the information analysed is summarized regarding sulphur dioxide emissions, the legislative provisions for the reduction of sulphur dioxide emissions in the Czech Republic are presented together with a discussion about the evolution of desulphurization technologies throughout time.
2.1 Legislation in the Czech Republic for the protection of air quality
2.1.1 Existing provisions
Currently, in the Czech Republic, the validity of the Clean Air Act No. 472/2005 Coll. [22],
superseded the original and amended Law No. 86/2002 Coll. [23], which reflects new
concerns which come through the changes made by Act No. 521/2002 Coll. Law No. 92/2004 Coll. Act No. 186/2004 Coll. Act No. 695/2004 Coll. Act No. 180/2005 Coll., And Act No. 385/2005 Coll. This law establishes:
• rights and obligations of persons and administrative offices for the protection of ambient
air beforethe emission of pollutants due to human activity, also covering the requirements
concerning the handling of controlled substances that deplete the ozone layer and of products containing such substances;
• conditions for further reduction of discharged pollutant quantities that cause an adverse effect on life, on human and animal health, and on the environment.
The main objective of this Act is to ensure the full compatibility of the environmental law in the Czech Republic with EU legislation and, simultaneously, create the conditions for the fulfilment of the requirements imposed on the Czech Republic in the light of international commitments which the Czech Republic aims at complying with, which deal with the protection of the atmosphere, the ozone layer and the climate of the Czech Republic.
This law included detailed rules: [21]
• 350/2002 Coll. Establishing the values and procedures of monitoring, assessment, evaluation and management of air quality.
• 351/2002 Coll. Establishing binding emission ceilings for certain atmospheric pollutants
and the method of preparation and realization of emission inventories and emission
projections.
• 352/2002 Coll. Establishing emission limits and other operation conditions for the combustion of stationary sources of air pollution.
• 353/2002 Coll. Establishing emission limits and other operation conditions of other stationary sources of air pollution.
• 354/2002 Coll. Establishing emission limits and other conditions for the incineration of waste.
• 355/2002 Coll. Establishing emission limits and other operation conditions for other stationary sources of air pollution-emitting volatile organic compounds (VOC) from the process of applying organic solvents to the storage and distribution of petrol.
• 356/2002 Coll. Establishing the list of pollutants, general emission limits, transmission of
news and information, surveying the percentage of pollutants discharged, the darkness of
smoke, permissible odour extent and intensity of odours, the conditions for the obtention of authorization permits and licences, definition of requirements for the management of operational records concerning sources of air pollution and the conditions for their implementation.
• 357/2002 Coll. Laying down the requirements for the quality of fuels regarding the protection of air quality.
2.1.2 Sulphur dioxide emission limits
In the conditions mentioned above, the emission limits for sulphur dioxide combustion of solid, liquid and gaseous fuels are defined. [21,22]
2.1.3 Emission limits for solid fuels
A) For each facility, the existing resources are valid under Section 2 point. g) The following SO2 emission limits are expressed in [mg.m-3] (with an oxygen content of 6%),
under normal conditions and dry gas.
Table 1 - Sulphur dioxide emission limits.
Thermal capacity Up to 50 MW [mg.m-3] 50-300 MW [mg.m-3] >300 MW [mg.m-3] Fluidize furnace 800 500 500
Other kinds of furnace *) 2500 1700 500
*)
also for grade combustion chambers and chambers with external fluidize reactor
Note:
1st) These emission limits are applied to the existing facilities of resources, issued in the
original building permit, before the 1st of July of 1987, and applies to the thermal
performance of single facilities.
2nd) From the 1st of January of 2008, the resources have had to meet the emission
reduction plan requirements. The plan sets emission ceilings to protect the air, which are based on limits set out under the letter B. The emission limits for each facility, which was issued in the building permit after the 1st of July of 1987, applies to all thermal power resources.
B) The emission limits for new sources, with building permits issued from the 1st of
July of 1987 to the 31st of December of 2002, pursuant to Section 2, point h) expressed
[mg.m-3](with an oxygen content of 6%) under normal conditions and dry gas.
Table 2 - Sulphur dioxide emission limits for solid fuels.
Thermal capacity 50-100 MW [mg.m-3] 100-500 MW [mg.m-3] >500 MW [mg.m-3] Limit 2000 2000 to 400 400
C) The emission limit values for new future resources, with building permits issued
after the 1st of January of 2003, under Section 2 point. j) expressed [mg.m-3] (the oxygen
content of 6%) under normal conditions and dry gas.
Table 3 - Sulphur dioxide emission limits for new future solid fuels.
Type of fuel 50-100 MW [mg.m-3] 100-300 MW [mg.m-3] >300 MW [mg.m-3] Biomass 200 200 200
Other solid fuels 850 200 200
2.1.4 Emission limits for liquid fuels
A) In order to guarantee that emission values are below the limit value using the
existing resources under Section 2 point g) expressed [mg.m-3] (the oxygen content of
3%) under normal conditions and dry gas.
Table 4 - Sulphur dioxide emission limits for liquid fuels.
Thermal capacity to 50 MW [mg.m-3] 50-300 MW [mg.m-3] >300 MW [mg.m-3]
Limit (not specified) 1700 500
Note:
1st) These emission limits apply to the facilities of existing resources, which were issued in
the original building permit before the 1st of July of 1987, and applies to the thermal performance of single facilities.
2nd) From the 1st of January of 2008, thermal power plants will have the resources to meet
emission reduction plan. The plan establishes emission ceilings to protect the air, which are based on limits set out under the letter B. The emission limits for each facility, with building permits issued after the 1st of July of 1987, with respect to thermal capacity of entire resources, will have emission limits determined according to the plants’ capacity.
B) The emission limits for new sources, for which building permits were issued
from the 1st of July of 1987 to the 31st of December of 2002, pursuant to Section 2, point.
Table 5 - Sulphur dioxide emission limits for new liquid fuels. Thermal power 50-300 MW [mg.m-3] 300-500 MW [mg.m-3] >500 MW [mg.m-3] Limit 1700 1700 to 400 400
C) The emission limit values for new future resources, with building permits issued
after the 1st of January of 2003, under Section 2 point j) expressed [mg.m-3] (the oxygen
content of 3%) under normal conditions and dry gas.
Table 6 - Sulphur dioxide emission limits for new future liquid fuels. [21]
Thermal power 50-100 MW [mg.m-3] 100-300 MW [mg.m-3] >300 MW [mg.m-3] Limit 850 400 to 200 200
2.1.5 Emission limits for gas-fired sources
A) For each facility with resources under Section 2 point g) expressed [mg.m-3](the
oxygen content of 3%) at normal conditions for dry gas.
Table 7 - Sulphur dioxide emission limits for existing resources for gaseous fuels. [21]
Fuel Limit [mg.m-3]
Gaseous fuels from public distribution networks 35
Gaseous fuels fuel from outside the public distribution
networks, and coke* oven gas 900
Liquefied gas (not set)
* by product from high temperature black coal carbonization process
Note:
1st) These emission limits apply to the facilities of existing resources, with the original
building permit issued before the 1st of July of 1987, and applies to the thermal capacity of
single facilities.
2nd) From the 1st January of 2008, the resources have to meet the emission reduction plan. The plan sets the emissions ceilings to protect the air, which are based on limits set out under the letter B. The emission limits for each facility, with building permits issued
B) The emission limits for new sources, with building permits issued from the 1st of
July of 1987 to the 31st of December of 2002, according to Section 2, point. h) expressed
[mg.m-3] (the oxygen content of 3%) on a normal state conditions and dry gas.
Table 8 -Sulphur dioxideemission limits for gas fired sources.[21]
Fuel Limit
[mg.m-3]
Gaseous fuels in general 35
Liquefied gas 5
Low heat value gases from gasification or by products from
refining, coke oven gas, blast furnace gas, converter gas 800
Gas from coal gasification (not set)
C) The emission limit values for new future resources, with building permits issued
after the 1st of January of 2003 under Section 2 point. j) expressed [mg.m-3] (the oxygen
content of 3%) under normal conditions and dry gas.
Table 9 - Sulphur dioxide emission limits for new gas fired sources.[21]
Fuel Limit
[mg.m-3]
Gaseous fuels in general 35
Liquefied gas 5
Coke oven gas 400
Blast furnace gas, converter gas* 200
* by product from iron industry
2.2 Categorization of sources of air pollution
Sources of pollution are divided according to their heat capacity and relevance of air pollution control: [22]
• Greatest sources - sources of rated heat capacity input of 50 MW and above, without taking into account the nominal heat power.
• Great sources - technological facilities containing stationary fuel-burning equipment with a rated thermal output performance from 5 MW to 50 MW.
• Median sources - technological facilities containing stationary equipment to burn fuel with a thermal output capacity from 0,2 MW to 5 MW.
• Small sources - technological devices containing stationary equipment to burn fuel with a thermal output capacity of less than 0,2 MW.
• Mobile sources - mobile equipment vehicles, portable devices equipped with internal combustion engines, which emit pollutants into the air, especially road motor vehicles, railway vehicles, ships and aircrafts.
• Stationary sources - devices for burning fuel or other technological device, which emits pollutants into the air.
2.3 Sulphur dioxide
Considering that sulphur is a necessary component of biological systems, sulphur is ubiquitous in the biosphere. As a result, sulphur often occurs in relatively high concentrations in fossil fuels, with coal and crude oils deposits commonly containing 1-5% sulphur according to weight. The widespread combustion of fossil fuels has, therefore, greatly increased sulphur emissions into the atmosphere, with an anthropogenic component substantially higher than the natural emissions on a global basis. Anthropogenic emissions have increased sulphur deposition and atmospheric sulphate loadings in many areas. Early studies, which focus on these problems, have analysed the impact of these substances on ecosystems and human health, which occur on both local and regional scales. Sulphate acid deposition can be detrimental to ecosystems, harming aquatic fauna and flora, as well as having a negative impact on a wide range of terrestrial plant life. In addition, aerosols particles have adverse effects on human health, especially in the form of respiratory elements, as well as the tetragenic effects which have been identified. Sulphur dioxide forms sulphate aerosols that are thought to have a significant effect on global and regional climates. Sulphate aerosols reflect sunlight into space and also act as cloud condensation nuclei, which tend to make clouds more reflective and change their lifetimes.
Sulphur dioxide is among the most harmful pollutants emitted into the atmosphere, both due to its quantity, and due to its harmful effects in general. It is a colourless, slightly poisonous liquefiable gas, with a sweet taste and a specific odour. The melting point is at -72,5°C and boiling point at -10ºC. The multifaceted impacts of sulphur dioxide emissions motivates a closer examination of possible future paths for future regional and global emissions.
2.3.1 Sources of sulphur dioxide
Sulphur (S) is present in fossil fuels, such as oil and coal, and is oxidised during
combustion, forming sulphur dioxide (SO2).
Nearly all the sulphur dioxide emitted into the atmosphere is created by the combustion of substances that are present in nature, and which contain sulphur whether in its elementary form, or as a component of ore, or fossil fuel. The fossil fuel can be coal, oil and/or natural gas. The ores are particularly sulphuric ore such as pyrites, sphalerite (zinc blend) and cinnabar (mercury sulphide). Therefore, the emissions occur primarily through the production of steam and electricity, through the metallurgical processing of ores, petroleum refining and through the production of sulphuric acid.
Sulphur present in coal is represented in two different forms: • organic;
• inorganic. The inorganic can be further broken down into:
- pyrite FeS2
- sulphates SO
42-
- sulphides S 2- (chemically coupled)
- the elemental S
Each of these forms behaves differently with regard to their chemical and physical processes. Pyrite has its organic chemical conversion subjected to a temperature below
1000°C and, through combustion, is transformed into a gaseous SO2, while sulphate
remains unchanged in the form of solid residue (ash). Temperatures around 1500°C lead
to a complete breakdown of sulphate. [33, 34] The rate of emissions of sulphur oxides
released by the combustion of fuel is considered to be a specific content of S, which is defined as the weight of sulphur content in coal [g] relative to [1 MJ] calorific value of fuel:
[34]
(1) (2)
By merging the two terms, the following is obtained:
(3) 100 100 * r t d r W S S = − r i r m Q S S = *10
(
)
r i r t d mQ
W
S
S
*
10
100
*
−
=
m
S
- Specific content of S [g.MJ-1]d
S
- Sulphur content in dry state [% wt]
r
S
- Sulphur content in original state [% wt]r t
W
- Water content in original state [% wt]
r i
Q
- Heat value of the fuel in its original state [MJ.kg-1]The Czech brown energetic coal has a low calorific value and a relatively high sulphur percentage if compared to black energetic coal imported into Western Europe, from China or South Africa, which has a higher calorific value and a lower sulphur content.
Table 10 - Comparison of specific sulphur content in black and brown coal. [34]
Parameter Black coal used in
Western Europe
Brown coal used in the Czech Republic
Heating value cca 25 MJ.kg-1 cca 9 – 12 MJ.kg-1
Sulphur content 0,5 – 0,8 % wt. 1,3 % wt
Specific sulphur content with respect
to heat value 0,2 – 0,3 g S.MJ
-1
1,1 – 1,5 g S.MJ-1
2.3.2 Impact of sulphur dioxide on the environment
After the emission of sulphur dioxide into the atmosphere, the substance is not permanently accumulated; it is removed from the atmosphere through two processes: dry deposition and wet deposition.
Dry deposition implies the contact of particles and gases into the Earth's surface and sea
without the intervention of atmospheric water (rain, snow, fog) [9]. The effectiveness of dry
deposition can be expressed as “settling speed Vg”.
] . [ ] . . [ ] . [ 3 1 2 2 1 − − − − = m g ion concentrat c Atmospheri s m g SO of stream s m Vg
µ
µ
(4)Table 11 – Typical deposition speed. [9]
The surface on which SO2 falls Deposition speed [cm.s
-1
]
Field ( green surface) 1,0
Ocean 0,5
Soil 0,7
Wet deposition is the removal of pollutants by rainfall and includes both the conversion of pollutants in the presence of water (into a layer of clouds), and their subsequent removal by rainfall.
The overall effectiveness of wet deposition can be expressed by "W", sometimes wrongly called "washing factor".
(5)
The typical removal ratio for sulphate ion is the value of 700. [9]
In the presence of water drops (fog, aerosols), but also in the gaseous phase, sulphur dioxide is oxidised into sulphuric acid, which is one of the most important components of what is commonly known as acid rain. Sulphuric acid, as well as sulphate, leads to photochemical oxidation, particularly in the presence of nitrogen oxides. The direct rainfall
removes approximately 80% of sulphur dioxide from the atmosphere. Gaseous SO2 is
very quickly absorbed by plants and by the soil surface. Overall, an estimated residence time of SO2 in the air is of around 2-7 days. [4]
Sulphur dioxide is oxidised by the hydroxyl radical in the presence of other molecules (the third body) in the gaseous phase as illustrated by the following equations:
M g HSO M g SO g OH + + → • + • ) ( ) ( ) ( 2 3 (6) ) ( ) ( ) ( ) ( 2 2 3 3 g O g HO g SO g HSO• + → • + (7) ) ( ) ( ) ( 2 2 4 3 g H O g H SO g SO + → (8)
Due to low volatility, sulphuric acid condensates on the surface of droplets or particles.
Faster oxidation of SO2 occurs in the liquid phase
)
(
)
(
2 2g
SO
aq
SO
↔
(9) − + − + + ↔ + ↔ ↔ + 2 3 3 3 2 2 2(aq) H O(aq) H SO H HSO 2H SO SO (10) + − + − +H O aq +H →SO +H O aq + H HSO3 2 2( ) 42 2 ( ) 2 (11) ) ( ) ( 42 2 3 2 3 O aq SO O aq SO −+ → − + (12) ] . [ ] . [ 1 2 1 2 − − = kg mg air in ion Concentrat SO kg mg ion precipitat in ion Concentrat SO WThe last reaction (12) takes place at pH greater than 6, which occurs only in cloud drops containing basic substances such as ammonium or sodium ion.
Oxidation of SO2 to SO42- in clouds, and cloud water fog, is usually much faster than
homogeneous oxidation of SO2 in the gaseous phase generated by hydroxyl radical. The
speed of oxidation in the gaseous phase is from 0.5 to 1%.h-1, but the speed of oxidation
in the liquid phase of rainwater can reach percentages that vary from 10% to 50%.h-1. An
important process, mainly in the case of pollution in cities and in industrial areas, is a fast
heterogeneous catalytic oxidation of SO2 in the wet aerosol particles. An example is the
oxidation of SO2 in the looping smoke stack from coal-fired power plants to ash particles,
containing, for example, trivalent iron or diatomic manganese (catalysts). [10]
While natural rain has a pH of 5.0 to 5.6 (affected only by the concentration of CO2 in the
air), the pH of acid rain (or fog) ranges from 2.0 to 5.6.
One of the earliest harmful effects of sulphur dioxide identified is the damage of forests and other plant life, which has been known for over one hundred years. In an accidental
exposure to concentrations of SO2 about 1 mg.m-3, within only a few hours, leads to acute
damage to leafy surfaces, which is attributed to the direct influence of SO2 redox
characteristics, reflected by the collapse of tissues and their subsequent death. The
predominant impairment is chronic exposure to SO2, which leads to the accumulation of
sulphate in the tissue, and possibly decreasing the pH to reduce the H2S. The result is a
synthesis of chlorophyll inhibition, expressed by the loss of green leaves and restrictions on photosynthesis causing the trees and plants’ death. Conifers are particularly resistant to sulphur effects because the needles only changed every three years, so they
accumulate the annual sulphate which has fallen. [4]
Sulphur dioxide is soluble in water, so, it is easily captured on the surface of nasal mucous and upper respiratory tract mucous membranes. Being exposed to high
concentrations of SO2 and H2SO4, leads to respiratory problems such as bronchitis. SO2 is
absorbed into the upper respiratory system tract in percentages which vary between 95% and 98%. Sulphur dioxide causes a reduction of vital lung capacity and reduces the production of red blood cells, leading to anaemia. Persistent exposure to concentrations of
0.15 mg.m-3 leads to chronic respiratory tract diseases, which, with accidental exposures
to conditions with air concentrations of SO2 above 1 mg.m-3, lead to increased mortality
rates. [4,9]
Living in an environment which is permanently polluted by sulphur dioxide has resulted in increased morbidity and mortality in the population, degradation of forests, plant, animal
and agricultural production. Besides these effects on human health and on the environment, sulphur dioxide reacts in to the water present in the air, forming sulphuric acid which destroys practically all types of building materials.
2.3.3 Evolution of sulphur dioxide emissions 2.3.3.1 Global emissions of sulphur
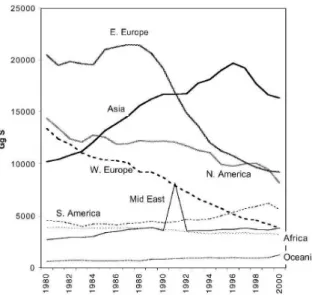
Figure 1 illustrates the evolution of global and regional emissions of sulphur in the period comprehended between the years 1850 to 2000. The maximum emissions were achieved in 1989, with 74 100 Gg
Figure 1 - Global and regional sulphur emissions in the period between 1850 to 2000. [29]
In 1980, the global emissions of sulphur reached 73 200 Gg, and then started to decline as a result of the reduction of emissions in Western Europe and North America. Re-growth in the percentage of emissions in the second half of the 80s, in the twentieth century, was caused by growing emissions in Asia. Subsequent steep decline, broken only by oil fires in Kuwait (which contributed with approximately 4 700 Gg), is mainly a
result of the economic collapse of Eastern European countries and of the Soviet Union. [29]
The other figure reveals visible variations in the emissions of sulphur in the various
Figure 2 - Regional sulphur emission trends between the 80s and 90s of the 20th century.[29]
Distribution of SO2 emissions in 2005, in the countries of the European Union, according
to different sources presented in Figure 3, reveal a dominant sharing of electricity production.
Figure 3 - Sulphur dioxide emissions in the countries of the EEA-32.
The changes in the sulphur dioxide emissions in each sector from 1990 to 2005 are presented on figure 4.
Figure 4 - Change (%) in the sulphur dioxide emissions in each sector from 1990 to 2005 for EEA-32.
The proposal for the development of SO2 emissions in the future and the projected
scenario shown in Figure 5 concerning global emissions of SO2 reveal that these will be
increasingly influenced by developing countries, particularly Asia. The emissions in these countries are growing mainly due to an increase in the use of coal (particularly due to increasing electricity consumption) and a growth in the population. In most industrialised countries (full line curves) emissions will decrease (see table 12). The decline in emissions in industrialised countries will encourage the improvement of electricity production technology. The poorer developing countries will have to reduce emissions in
the second half of the 21st century, which will have a positive major impact, in addition to
the introduction of emission control (such as the installation of desulphurization units), as
an improved technology for electricity production, as we have already mentioned. [28]
Table 12- Estimated sulphur dioxide emissions in the 21st century.
SO2 World emissions
year 1990 2005 2020 2035 2050 2065 2080 2095
[Tg S] 72 65 78 62 39 33 29 27
2.3.3.2 Emissions in the Czech Republic
After the change of the political system in 1989, legislation such as the Law 309/1991 Sb.o on Clean Air pollutants, introduced emission limits and other conditions for the operation of resources. Detailed regulations seen by the law were based primarily on the legislation from the Federal Republic of Germany, which then represented a set of possible regulations to protect air quality in Europe. As a result of the definition of emission limits, this Act has succeeded in significantly reducing emissions of a wide range of pollutants into the air, such as sulphur dioxide, whose emissions amounted to 2 257 kt in 1980 and dropped to 299 kt in 1999, which was the first year of the full effectiveness of the law.[34]
Figure 6 shows the variations in emissions of SO2 in the Czech Republic and Slovakia in
the period between 1850 and 1994, broken down according to types of fuels. SO2
emissions from smelting sulphide ore and coal burning were the most important sources
before 1870. Since the 80s in the 19th century, the burning of brown coal was
implemented, which recorded a significant increase after the Second World War [16].
Figure 7 illustrates the total emissions of SO2 in the Czech Republic and Slovakia in the
period between 1850 to 1994, calculated from data collected on fuel registers and yearbooks.
Figure 7 – Sulphur dioxide total emissions in Czech Republic and Slovakia from 1840 to 1994.[16]
The decrease in the emissions of major pollutants since 1989, which is not only a consequence of the entry into force of legislative adjustments to protect the air, but also an attempt to provide more environmentally friendly solutions, namely in the field of the automobile industry, the result of the gradual replacement of natural technologies and of the improvement of the structure of primary energy sources in favour of liquid and gaseous fuels, particularly those presented in Figure 8.
Figure 8 – SO2 emissions evolution from 1990 to 2003 in the Czech Republic. [38]
Table 13 shows the breakdown of sulphur dioxide emissions according to the source structure in 2001 in the Czech Republic. The table reveals that small sources also have a
significant impact on the total SO2 emissions (due to the amount of small sources of
Table 13 – Total sulphur dioxide emissions according to source type.[38] Sources of Pollution Total SO2 emissions in 2001 [kt] [%]
Large sources 193,4 77,1 Secondary sources 7,5 3 Small sources 43,1 17,2
∑
250,9 100 Stationary sources 244 97,3 Mobile sources 6,9 2,7∑
250,9 100 2.4 Desulphurization processesThe reduction of sulphur emissions can be achieved primarily by removing sulphur from coal, during the combustion process, or later on from the flue gas (after the combustion process).
2.4.1 Coal desulphurization
Sulphur in coal may exist in various forms. The use of physical and chemical processes to
separate sulphur from coal is based on different principles.[34]
2.4.1.1 The physical separation of pyritic sulphur
Given that materials present different degrees of resistance, it is possible to separate pyritic sulphur from coal, due to coal’s different grinding properties and pyrite’s resistance in maintaining the original size of a grain.
It is also possible to use the magnetic properties of pyrite and separate it with the assistance of an electromagnet, or, still, explore the differences in the density of coal and
ingrown ore, by the use of BaSO4.
Unfortunately, the majority of Czech coal contains a significant amount of ingrown pyrites in the form of small particles, which are difficult to separate.
2.4.1.2 Myer process
The Myer process consists in leaching pyritic sulphur with a water solution of ferric sulphate at 90°C -130°C. Regeneration of the ferrou s sulphate product is carried out with air oxygen. In this way, pyrites can be effectively separated, but organically linked sulphur remains in the coal.
2.4.1.3 Gravimelt process
The Gravimelt process aims to extract ash from coal fuel with molten NaOH at temperatures which vary between 320°C to 415°C. The ash contained in coal in an alkaline environment reacts to form silicates, ferrite and sodium aluminates, and is separated from the insoluble coal. Coal is the first to be grinded, and then molten NaOH is added to the rotary kiln. The liquid product is transferred into an aqueous solution; coal is than separated and washed with water. This alkali coal is neutralised by the use of acids. In this way, a complete separation of coal and ashes is almost obtained, remaining approximately 1% of ash in the coal.
The extract containing dissolved ash is neutralized to eliminate the iron and aluminium hydroxides. These are separated and can then be processed in the metallurgical industry into individual metals.
2.4.1.4 Biological sulphur removal
Biological leaching of sulphur from coal has drawn in the mining of copper and vanadium
from low-grade ore. This is adesulphurization process carried out by bacteria:
• Thiobacilus ferrooxidans, • Thiobacilus thiooxidans.
These bacteria are always present in acid mine water in the vicinity of rocks containing
pyrites or marcasite. Acidic water from leaching containing biological H2SO4 must be
neutralised with CaO or CaCO3.
Bacteriological march is slow and depends on temperature variables. At 16°C it is virtually stopped. The effectiveness of the process is relatively low and there is no extraction of organic sulphur from coal.
The application of the coal desulphurization process for energy purposes encountered the low efficiency of desulphurization of coal and, hence, the impossibility to comply with limits of emission values. Currently, these processes are unable to compete economically with the desulphurization combustion processes.
2.4.2 Flue gas desulphurization
For the removal of sulphur from power gas (particularly hydrogen sulphide and organic sulphur pollutants), several technological processes were used and developed in the past (depending on the type of power gas, and on the sulphur content of a desired cleaning degree), namely:
• Dry methods (such as cleaning Fe2O3 material or activated coal);
• Wet regenerative alternatives (for example: the ammonia process, the ethanolamine process, Sulfinol and Shell-adip, Alkazid, Vacuum-carbonate under low pressure with Na2CO3 or K2CO3);
• chemisorption with oxidative regeneration (for example, Ferrox, Fischer way, SMO, Perox, Holmes-Stredford, Giammarco-Vetrocoke, Sulfin);
• Physical sorption (Sorption with cold water, Rectisol, Purisol).
2.4.2.1 Rectisol
Rectisol works on the principle of absorption of undesirable components in the gas (H2S,
CO2, COS …) by methanol at low temperatures. With the decreasing of temperature,
methanol’s absorption capacity rises very quickly. Raw gas is purified in three stages:
• In the first stage of the scrubber, the hydrocarbons are washed out with water which contains a small amount of methanol (at around 0°C) .
• In the second stage, the sulfan is selectively washed out with a precisely defined amount of methanol (temperature around -50°C).
• In the third stage of the scrubber, the carbon dioxide and methanol are washed out (at a temperature of around -70°C).
The advantage of this method is the removal of all impurities, which would otherwise have to be absorbed in many ways. Methanol is almost unable to dissolve flammable gas
components (H2, CO, CH4), which would diminish the calorific power of the fuel. In
Sokolov, coal a.s. Vřesové is built in an integrated gas-steam cycle, which uses the
Rectisol process. For the purpose of generating electricity, the power gas, which is obtained in pressure generators (steam-oxygen Gasification of brown coal), is produced first. The combustion turbines are regulated so that they can burn both gases: the power gas obtained from the brown coal and from natural gas. Power gas, after being desulphurized, is included in the combustion chambers of gas turbines. Regeneration of methanol is further processed into high quality sulphuric acid.
O
H
SO
O
S
H
23
22
22
22
+
⇔
+
(13) 3 2 22
2
SO
+
O
⇔
SO
(14) 4 2 2 3H
O
H
SO
SO
+
⇔
(15)This method of desulphurization which is applied to the final product of coal gasification is a cost-effective solution, because it cleans much smaller volumes of gas than the percentage which results from the burning of coal, because the sulphur content in the clean gas is around 1 ppm. The product of desulphurization is a very pure sulphuric acid
(there is no problem the retailing of the by product).[30,37]
2.4.2.2 Flue gas desulphurization
Unlike desulphurized coal, desulphurization of flue gases is established through an industrial process. Desulphurization technologies for flue gases can be characterised by significant volumes of purified gases, low concentrations of pollutants in the exhaust gas,
which are SO2, SO3, Cl- and F-, and enormous mass flows of these substances.
Production of flue gas depends on the type of combusted fuel and on the surplus of combustion air. The usual values of production for the production of 200 MW combustion of electricity per-standard conditions are:
• Brown coal roughly 1.0 to 1.2 million m3.h-1
• Black coal approximately 0.7 million m3.h-1
High volumes of exhaust gas to purify leads to cost disadvantages, because these require specifically dimensioned devices. Higher sulphur content in coal leads to higher emissions of sulphur oxides, which must be separated from the flue gas. Large quantities of
desulphurization products are difficult to use.[34]
Flue gas desulphurization can be classified as:
• Non-renewable because the reagent in the scrubber is consumed in order to directly generate a by-product containing the sulphur, such as gypsum.
• Renewable - the spent reagent is regenerated in a separate step to renew the reagent material for further use and to produce a separate by-product, such as elemental sulphur.
Another form of classifying the desulphurization process is its distribution in the categories of dry and wet:
• Wet - SO2 is absorbed, essentially using alkaline substances.
• Dry - sorption and catalytic processes, take place on the sorbent surface or catalytic converters at temperatures above 100°C.
• Semi dry - the active substance - water lime - is injected, in the form of water suspension, into the current hot gases, the liquid then evaporates and the reaction product is absorbed in a solid state.
The final criterion is the physical or chemical nature of the process under which the
desulphurization methods can be divided: absorption, adsorption and catalytic.[34]
2.4.2.3 Dry methods
In these methods, there is a heterogeneous solid-gas reaction. The process can be
applied to flue gas desulphurization for the classic boilers or for fluidized bed boilers.[34]
2.4.2.3.1 Flue gas desulphurization using limestone in pulverized coal boilers
Flue gas desulphurization consists of dosing fine grinded limestone and air into the combustion chamber in the boiler. The process takes place as described below:
2 850 3 CaO CO CaCO →> °C + (16) 4 2 2 2 1 CaSO O SO CaO+ + → (17)
Limestone’s calcinations take place at temperatures above 850°C; the reaction between
CaO and SO2 takes place at greater speed between 600°C– 1100°C . Above this
temperature, there is a deactivation generated as a result of changes in the porous structure. Limestone must be sufficiently grinded, at least 90% of particulate matter should be <60 µm. The product of the reaction is CaSO4 in addition to a significant amount of
unreacted CaO of limestone and fly ash from coal combustion. The SO2 comes into
contact with the particles of calcium oxide, and diffuses through the porous, reacting, and
the CaSO4 acts as a wall around the surface of the sorbent against the diffusion of more
molecules of sulphur dioxide. The result is that the conversion of the generated CaO is
low and varies from 11 to 15% (stoichiometry CaO:SO2). The contact time for the particles
to react in the boiler is low, usually a few seconds, depending on the boiler structure and level of use of installed capacity. The advantage of this process is the low investment in
technologies (machinery).[34]
Given that the application of limestone in the pulverized coal boiler cannot achieve high conversion due to the limited residence time, in fluidized bed boilers, this period of time, on average, may reach the time of one thousand seconds. Sulphation happens at an optimal temperature which varies between 800°C to 8 50°C. This technology also applies
to longer SO2 diffusion through the CaSO4 layer in the porous structure. This layer leads to
abrasion of the grains and, in this way, accelerates the diffusion of SO2 into the unreacted
CaO.
A fluidized burning fuel is a technology that will replace today’s classic generation of powdered coal boilers. It can also burn coal with low calorific value, which is quite difficult in powder burning boilers. Fluidized-bed combustion, when compared to the classic powdered coal, has higher energy efficiency rates.
2.4.2.3.2 Active soda
This method has a non-renewable character. Decomposition of sodium bicarbonate
(NaHCO3) takes place at 90°C, and generates a highly react ive Na2CO3, which reacts
easily with the SO2 in the flue gas to produce sodium sulphite (Na2SO3), with a smaller proportion of sulphite oxidized to sulphate.
In contrast, for dry limestone additive technology, this process has the same "solid-gas"
reaction mechanism but with a higher conversion of Na+. This is due to the fact that
2.4.3 Semi dry lime method
The semi dry lime method consists in injecting lime water into the reactor, which is an atomization chamber. The process consists in the adiabatic evaporation of water from the suspension and the cooling of exhaust gases at an optimum temperature reaction:
( )
OH SO CaSO H OCa 2 + 2 → 3 + 2 (18)
In addition to calcium, sulphite is formed by the oxidation of a small quantity of calcium sulphate: 4 2 3 2 2CaSO +O → CaSO (19)
The product is separated by electrostatic precipitators (ESP), or bag house filters, sometimes requiring the reheating of the flue gas (to avoid condensation inside the stack). In this desulphurization process, it is important that, combustion temperature closely approximates the dew point of water. In addition to the suspension of the lime, it is possible to achieve the required temperature by adding water.
A modification of this process is caused by the absorption of sulphur dioxide lime in the fluidized-bed. Flue gases from the boiler (after the dust collection) enter the fluidized bed reactor, in which the fluid layer consists of calcium hydroxide. The optimum temperature in the reactor is maintained so as to achieve the adiabatic evaporation of water. The product
is partially recirculated in order to guarantee a better use of lime.[34]
2.4.4 Wet methods
Wet methods of desulphurization can be divided into several types depending on the kind of absorption suspension.[33]
2.4.4.1 Lime-sludge suspension type
SO2 is removed into water suspensions of CaO creating an insoluble sludge, which
contains gypsum - dehydrate calcium sulphate (CaSO4. 2H2O), hemihydrates calcium
![Table 10 - Comparison of specific sulphur content in black and brown coal. [34]](https://thumb-eu.123doks.com/thumbv2/123dok_br/15882231.1089415/30.892.123.789.452.593/table-comparison-specific-sulphur-content-black-brown-coal.webp)


![Figure 9 – Desulphurization unit with shower absorber diagram. [42]](https://thumb-eu.123doks.com/thumbv2/123dok_br/15882231.1089415/50.892.143.775.732.1085/figure-desulphurization-unit-shower-absorber-diagram.webp)