0103 - 5053 $6.00+0.00
Article
*e-mail: [email protected]
Influence of the Electrolyte Composition on the Kinetics of the Oxygen Evolution Reaction
and Ozone Production Processes
Débora V. Franco,a Leonardo M. Da Silva,a Wilson F. Jardima and Julien F. C. Boodts*,b
a
Instituto de Química, Universidade Estadual de Campinas, CP 6154, 13084-862 Campinas - SP, Brazil
b
Instituto de Química, Universidade Federal de Uberlândia, Av. João Naves de Ávila 2160, 38408-100 Uberlândia - MG, Brazil
A influência da composição do eletrólito (ácido sulfúrico, ácido perclórico e suas misturas) sobre a cinética eletródica da reação de desprendimento de oxigênio (RDO) e a produção eletroquímica de ozônio (PEO) em eletrodo de β-PbO2, foi investigada empregando-se a espectroscopia de impedância eletroquímica e curvas de polarização quase-estacionárias. A análise dos espectros de impedância revelou uma dependência da capacitância da dupla camada elétrica e da pseudo-capacitância de adsorsão dos intermediários da reação com a composição do eletrólito. A pseudo-capacitância é função do potencial do eletrodo e da composição do eletrólito, indicando que a cobertura superficial pelos intermediários da reação depende destes parâmetros. Os valores do coeficiente de Tafel apoiam a descarga primária da água como sendo a etapa determinante da velocidade do mecanismo eletródico descrevendo a RDO e a PEO. Os valores da eficiência da corrente para a PEO (ΦPEO) mostram que os eletrólitos puros resultam numa produção máxima de ozônio quando comparados aos eletrólitos mistos. Baseada na análise teórica do mecanismo eletródico, este comportamento é conseqüente da redução na concentração superficial dos centros ativos responsáveis pela PEO ocasionada pela adsorsão de ânions.
The influence of electrolyte composition (pure sulphuric or perchloric acid and their mixtures) on the kinetics of the oxygen evolution reaction (OER) and the electrochemical ozone production (EOP) on β-PbO2 electrodes was investigated by electrochemical impedance spectroscopy and quasi-stationary polarisation curves. Analysis of the impedance spectra revealed a dependency of the electric double layer capacity and the adsorption pseudocapacitance, due to reaction intermediates, on electrolyte composition. The pseudocapacitance is a function of electrode potential and electrolyte composition, indicating the surface coverage by the reaction intermediates depends on these parameters. Tafel slope data support primary water discharge as rate determining step of the OER and EOP electrode processes. EOP current efficiency data (ΦEOP) show pure electrolytes lead to maximum O3 production when compared to mixed electrolytes. According to the theoretical analysis of the electrode mechanism, this behaviour is a consequence of the reduction in surface concentration of the active centres leading to EOP
caused by anion adsorption.
Keywords: impedance spectroscopy, ozone production, oxygen evolution, kinetics, mixed electrolytes
Introduction
Lead dioxide is a poor electrocatalyst for the oxygen evolution reaction, OER, and for this reason an interesting material for processes taking place at high positive potentials, such as electrochemical ozone production,
EOP, or the oxidation of organic compounds.1-4
It has been shown1-3,5,6EOP is capable of generating
higher ozone concentrations in the gaseous phase (O2 + O3) than the conventional technologies (e.g. corona discharge, UV-process), thus permitting faster degradation of resistant organic pollutants in effluents (e.g. pesticides and dyes from the textile industry).
Fundamental investigations show the main parameters affecting EOP are:1-8 (i) chemical nature of the electrode
composition; (iv) current density, and (v) electrolyte temperature. However, as discussed earlier,1-3,6-8 the
electrolyte composition is the single most important factor affecting EOP. This is due to the fact anion adsorption at the electrode surface strongly influences electrode kinetics and EOP current efficiency by affecting the electrochemical activation energy for the OER and the degree of coverage by reaction intermediates.1-3,8 The introduction into the base
electrolyte (e.g. H2SO4) of anions having a high electronegativity (e.g. BF4–, F–, PF
6
–) influences EOP by
changing the nature of the electrode/electrolyte interface, thus promoting an increase in the surface concentration of the active centres leading to EOP.1-3,8
The influence of the physicochemical properties on elementary processes at the PbO2 electrode/electrolyte interface was discussed by Pavlov and Monahov,9 who
proposed the OER takes place at active sites located in a hydrated (gel) zone of the oxide layer, [PbO(OH)2]. In this case the activity of the hydrated gel zone for the OER
process can be affected by anion adsorption.
In the light of the considerations raised by Pavlov and Monahov,9 Amadelli et al.4 reported adsorption of HSO
4 –/
SO42– anions at PbO
2 affects the electrode activity for the
OER inhibiting both water discharge and desorption of reaction intermediates. These authors4 established desorption
of reaction intermediates is the rate determining step of the electrode process, and proposed elementary reactions leading to OER take place at a surface consisting of crystalline (PbO2) and hydrous [PbO(OH)2] zones. Ho et al.10 also discussed
the importance of the electrochemical adsorption behaviour at PbO2 electrodes of chemisorbed intermediates that are involved in electrocatalytic multistep electrode mechanisms. As discussed previously,1-3 the OER governs the current
efficiency with the respect to the overall electrode process leading to the OER/EOP processes. Considering the particular case of sulphuric acid as electrolyte and lead dioxide as anode, the main side reaction taking place during the OER is ozone formation while persulphate formation is a minor side reaction. The theoretical approach, supported by the thermodynamic and kinetic data,1 indicates partial surface coverage by adsorbed O
2
molecules and O• radicals, which are both affected by
electrode nature and electrolyte composition, are the main parameters governing EOP current efficiency.
Although the influence of the electrolyte composition
on OER/EOP kinetics and EOP current efficiency has been
extensively investigated,1-8,11 a systematic investigation of the
influence of mixed perchloric and sulphuric acid electrolytes on these processes is not reported in the literature.
We now report the results of an electrochemical impedance spectroscopy, EIS, investigation of the
influence of pure and mixed perchloric and sulphuric acid, on the OER/EOP kinetics at β-PbO2.
Experimental
Electrode preparation
β-PbO2 electrodes were prepared by electrodeposition at constant current from Pb(NO3)2 acid solution onto both faces of a steel micro-sphere blasted Ti-support (10×5×0.12 mm), previously etched for 5 min in boiling oxalic acid (10% m/m) and then platinised. The electrodeposition of Pt was carried out from a solution containing 10 g dm-3
H2PtCl6 + 10 mg dm-3 Pb(CH
3CO2)2•3H2O,at 24
oC, using
a constant current density of 30 mA cm-2 for 5 min. β-PbO 2
was then electrodeposited onto both sides of the platinised Ti-support from a solution containing 0.2 mol dm-3 Pb(NO
3)2
+ 0.01 mol dm-3 HNO 3, at 60
oC, using a constant current
density of 20 mA cm-2 for 40 min. The average thickness
of the β-PbO2 layer was estimated by weighing, using a
β-PbO2 density12 of 9.375 g cm-3 and the geometric electrode
area of 1 cm2. An average thickness of 30 µm was obtained.
Electrodes were mounted in a glass tube and sealed with silicon glue. Duplicate samples were prepared to check the reproducibility of the experimental data. Aldrich “purum p.a.” products were used throughout.
Cell
A three-compartment all-glass cell (0.2 dm3) was used
throughout. To avoid contact between the anodic (oxygen and ozone) and cathodic (hydrogen) gaseous products, a coarse glass frit separator was introduced separating the anodic and the cathodic compartments. Ohmic drop was minimised using a Luggin capillary approaching the working electrode from below, while two heavily platinised platinum counter electrodes ensured uniformity of the current on the two opposite faces of the sample. Electrode potentials were read against the reversible hydrogen electrode (RHE). The H2-gas required to complete the RHE was generated in situ before its use. The RHE containing the electrolyte investigated was immersed directly in the electrolyte investigated and was separated from the main body of the cell by a coarse glass frit.
Procedures and equipment
EIS study. β-PbO2 is a dynamic system that changes with
the experimental conditions preceding the impedance measurements.9,13 Therefore, to minimise the influence
taking measurements the PbO2 electrode was washed with pure water and then immersed for 24 hours in a vessel containing pure water. Next, before application of the d.c. potential, located in the OER domain (1.75 to 2.24 V(vs. RHE)) the PbO2 electrode was pre-conditioned (j = 100 mA cm-2; t = 30 min) in the electrolyte under
investigation. Impedance spectra were recorded covering the 10 mHz to 100 kHz frequency interval. To ensure linearity of the electrode response a small amplitude sine wave (5 mV(p/p)) was used throughout. As required by the linear system theory, validation of the EIS-data was performed applying the Kramers-Kronig test14,15 using
the software furnished with the AUTOLAB electro-chemical system. Chi-square values, x2, ≤ 10-4 were
obtained in all cases. The equivalent circuit, EC, proposed in the literature10 for the lead dioxide electrode
using a d.c. potential interval where the OER evolution takes place in the absence of diffusion control, was applied to fit the impedance data using the EQUIVCRT program elaborated by Boukamp.16
Quasi-stationary polarisation curves. Prior to taking
measurements, we applied the same treatment described above for the PbO2 electrode. Using the potentiostatic mode, forwards and backwards polarisation curves (Evs. j) were recorded twice sweeping cyclically the electrode potential, under quasi-stationary conditions (ν = 0.1 mV s-1),1-3
covering the potential interval of ~1.70 to 2.35 V(vs. RHE), which corresponds to a current density interval of ~0.1 to 300 mA cm-2. Experimental data extracted from the
backwards scan of the second consecutive polarisation curve were used in the kinetic study.
Current efficiency for EOP, ΦEOP. Ozone concentration in
the N2 stream, used to transport O3 from the cell (anodic compartment) to the spectrophotometer (HACH model D4800), was measured under stationary conditions at 254 nm. ΦEOP-values were calculated using next equation:1-3
(1)
where: A = Absorbance at 254 nm; V0 = volumetric gas flow rate (N2 + O2 + O3) (dm3 s-1); z = number of electrons
(= 6); ε = ozone absorptivity17 at 254 nm (3024 cm-1
mol-1 dm3); l = cuvette optical path (10 cm); I
T = total
current (OER + EOP) (A); ΦEOP = ozone current efficiency (%); F = Faraday’s constant (96485 C mol-1).
An AUTOLAB (Eco Chemie, The Netherlands) electrochemical system (GPES), model PGSTAT20, was used throughout. Temperature control was done by means of a model FC55A01 FTS cooling system.
Solutions
Electrochemical studies were carried out using as electrolyte different mixtures of 3.0 mol dm-3 H
2SO4 (Vetec)
and 6.0 mol dm-3 HClO
4 (Merck), prepared volumetrically
using twice distilled water with a final pass through a Millipore Milli–Qplus apparatus. Fourteen solutions were prepared changing the [H2SO4]:[HClO4] ratio.
Results and Discussion
Analysis of the electrode behaviour in the frequency domain for the OER
Electrochemical Impedance Spectroscopy, EIS, is a powerful technique for investigation of gas evolution reactions at solid electrodes10,18-22 (e.g. H
2, O2, Cl2). The
response in the frequency domain of an electrochemical reaction can be simulated based on an intuitive but rationally chosen equivalent circuit.10 A circuit model
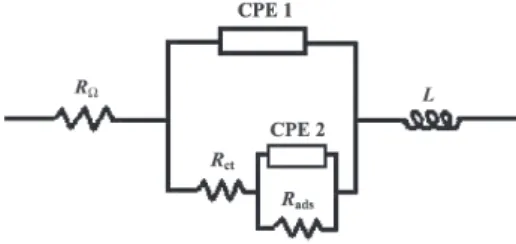
predicting two time constants in the frequency domain can adequately describe the OER or OER/EOP processes, at the inert β-PbO2 electrode. Figure 1 presents the EC model proposed by Ho et al.10 for the OER at the PbO
2
electrode in the absence of diffusion control.
In the above EC model RΩ represents the un-compensated solution resistance; CPE1 the double layer capacitance (Cdl); Rct the charge transfer resistance; CPE2 the adsorption pseudocapacitance of the reaction intermediates (Cads); Rads the resistance imposed by the reaction intermediates adsorbed at the electrode surface. Introduction of a serial inductor, L, is necessary to represent the inductive behaviour comprising the spurious and the effective inductance observed in the high frequency domain.18,19,23
Constant phase elements (CPE), instead of capacitors (C), were used to fit the experimental data.24 According
to the literature,21,24-26 the use of CPE is a good approach
for the study of solid electrodes with different degrees of surface roughness, physical nonuniformity or a nonuniform distribution of surface reaction sites. The impedance of the CPE can be written as:26-29
(2)
where T is the capacity parameter expressed in F cm-2
s(n – 1). The power n is related to the depression angle (ψ)
according to the following equation:
ψ = (1- n)π/2 (3)
Experimentally, the CPE behaviour shows up as a clockwise rotation by an angle ψ of the complex plane plot referred to an ideal smooth electrode surface. Thus,
T = C only when the solid electrode behaves as an ideal flat electrode (n = 1).
Brug et al.27 proposed that the double layer capacitance
(Cdl) is coupled with the uncompensated solution resistance (RΩ) and the charge transfer resistance (Rct) according to the following equation:
(4)
Thus, using the model described by equation 4, Cdl
values were calculated using T-values obtained from the CNLS fit.21,24-26
Since equation 4 was indeed proposed for the special case involving the double layer capacitance,27 in the case
of the pseudo-capacitive behaviour caused by adsorption of the reaction intermediates we used the T-parameter obtained from CPE2 to describe the influence of the electrolyte composition on the adsorption pseudo-capacitance. Such consideration is based in the fact that when n is close to one (see Table 2) the CPE2 adequately describes the pseudo-capacitance behaviour.28,29
The theoretical aspects related with the adsorption pseudo-capacitance and its true significance was discussed previously by Harrington and Conway.30
Considering that the main parameter governing EOP
current efficiency is the degree of competition between the O2 and O3 electrode processes, the investigation of the influence of the electrolyte nature on the OER constitutes an important fundamental issue for the electrochemical technology oriented towards ozone production. In the light of these considerations, impedance measurements were carried out as function of the d.c. electrode potential (Edc
interval where OER and OER/EOP take place) and the electrolyte composition.
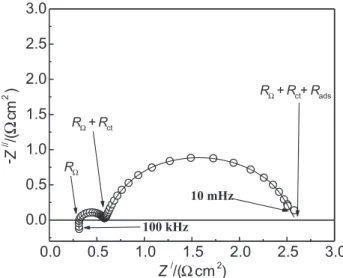
Figure 2 shows a complex-plane plot, Z/ vs. Z//,
representative of the frequency response for the OER at the β-PbO2 electrode.
Figure 2 reveals the complex-plane is mainly characterised by two well separated semicircles,
distributed in the low and high frequency domains, thus revealing an excellent agreement with the EC model originally proposed for the OER at PbO2 in the absence of diffusion control10(see Figure 1). As discussed in a
previous paper,18 a clear separation of the semicircles in
the complex plane depends on the intrinsic physico-chemical properties of the electrode/electrolyte interface and the electrode potential. From a theoretical point of view, complete deconvolution of the complex plane semicircles is only possible if the ratio between the relaxation frequencies is greater than two orders of magnitude31 (w
01/w02 > 100). This limit reveals the
difficulty to observe a perfect deconvolution of the semicircles in real cases.
According to the literature,4,10 the semicircle observed
in the low frequency domain is due to reaction intermediates adsorption formed during the OER or OER/ EOP processes, while the semicircle in the high frequency domain describes the resistive/capacitive behaviour associated with the electron transfer (faradaic process) coupled with the double layer charging process.
Independently of electrolyte composition, RΩ-values in the 0.30 to 0.60 Ω cm2 range were obtained (see Table
1). These results are in good agreement with EIS data obtained for conductive metallic oxide electrodes immersed in strong electrolytes.18,19,21 An inductance in
the high frequency domain of about 10 µH cm2 was
observed in all cases. As previously discussed by Da Silva
et al.,18,19 this inductive behaviour, normally presented by
conductive metallic oxide films, is caused by different factors: (i) shape and relative position of the electrodes and their electric and electrolytic connections, which result in the spurious inductance (LS) connected in series with Figure 2. Complex plane plot representative of the frequency response at β-PbO2 during the OER. Edc = 1.91V(vs. RHE). (o) experimental data; (⎯) simulation. Electrolyte: 6.0 mol dm-3 HClO
the electrode impedance, and (ii) the disordered movement of the charge carriers at the surface of the complex electrode micro-structure (pores, cracks, grain boundaries, etc.), which can result in the effective inductance (LE). According to these authors,18,19 the effective inductance
in the high frequency domain is influenced by the resistive components associated with the electrode system according to the next equation:
LE = ω–1[(Z p)
2 - γ(ΣR)2]1/2 (5)
where Zp is the impedance due to the effective inductance (LE) coupled with resistive components (e.g. ΣR = RΩ +
Rct); ω is the angular frequency, and γ is the dimensionless parameter (0 ≤ γ ≤ 1) describing the true contribution of the resistive components to Zp.
The influence of physico-chemical nature of the electrode/electrolyte interface on the inductive behaviour present in the high frequency domain was recently discussed by Bisquert et al.,23 who proposed a model for
the electrochemical behaviour of electroactive material containing heterogeneity or energy disorder, and proved that charge relaxation can lead to an inductive behaviour in the high frequency domain.
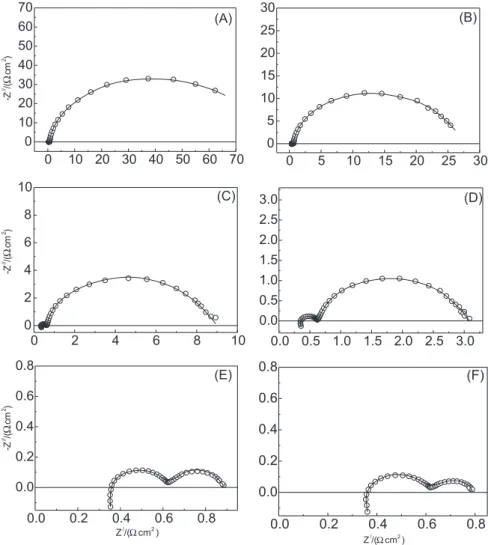
Figure 3 shows complex-plane plots (Z/ vs. Z//) as
function of the d.c. electrode potential, which are representative of the electrochemical behaviour of the OER
(low overpotential domain) and OER/EOP (high overpotential domain) at the β-PbO2.
Figure 3 clearly shows the resistance imposed by adsorption of the reaction intermediates at the electrode surface, Rads, considerable decreases on increasing the d.c. electrode potential, Edc. According to the literature,4,10,30-33
this behaviour can be correlated with the exponential dependency established between Rads and Edc (Tafel behaviour). For the case where Rads is significant when compared to the Rct (Rads >> Rct), one has that Rads governs the electrode kinetic.4,29,32,33
Table 1 shows the influence of electrolyte composition and the electrode potential on impedance parameters.
Analysis of Table 1 reveals that Cdl depends on both electrolyte composition and electrode potential. In the low overpotential case (1.75V), Cdl values are almost constant, presenting a maximum for the pure H2SO4 solution. Table 1 also shows the influence of electrolyte composition on
Cdl is more pronounced in the high overpotential domain (2.19V), where a sudden and strong increase in Cdl values is observed for [H2SO4]:[HClO4] > 1:10. For [H2SO4]:[HClO4] ≥ 1:3 the Cdl value is approximately constant. Again, the maximum Cdl value is obtained in the pure H2SO4 solution. These findings are in agreement with the literature,4 which reports sulphuric acid presents
higher Cdl values than other electrolytes due to the strong HSO4– adsorption when compared to the ClO
4 – anion.
The adsorption of the several different anions (NO3–,
Cl–, ClO 4
–, HSO 4
–/SO 4
2–) on PbO
2 electrodes, in acid
medium, was investigated using the radioisotope and potentiometric techniques by Kokarev et al.,34 who found
that the sulphate adsorption increases on increasing the electrode potential. In all cases these authors34 found the
anion adsorption increases on increasing the electrolyte concentration according to the Freundlich isotherm. Also, the anion adsorption on lead dioxide was found to obey the following series: SO42– > HSO
4
– > Cl– > ClO 4
– > NO 3
–, thus
confirming the superior adsorptive properties of the SO42–
and HSO4– anions observed in the present work.
Analysis of the impedance data obtained for the exploited electrode potential interval (1.75 to 2.24 V (vs. RHE)) revealed that Rct is little affected by Edc. In fact, analysis of Table 1 clearly shows a maximum change in
Rct less than 100 mΩ cm2, thus revealing that charge
transfer only plays a minor influence to the overall electrode impedance when compared to the Rct.
Kinetic study
Analyses of the adsorption pseudocapacitance. As already
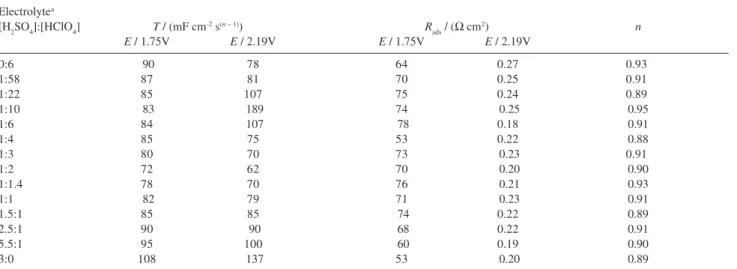
mentioned in this work, the behaviour of the adsorption pseudo-capacitance as function of the electrolyte composition and the electrode potential was investigated via CPE2, using the T values obtained from the CNLS fit. Table 2 shows the dependence of the adsorption behaviour via CPE2 (T-parameter) on the electrolyte composition and the electrode potential.
Analysis of Table 2 reveals the influence of the electrode potential on T is most pronounced for electrolytes presenting a [H2SO4]:[HClO4] ratio in the 1:58 to 1:4 interval. These findings also show pure sulphuric acid presents higher T
values when compared to pure perchloric acid, thus indicating the presence of SO42–/HSO
4
– anions at the electrode/
electrolyte interface promotes an increase in the surface coverage by the reaction intermediates. Table 2 also shows the T values are lower for mixed electrolytes in both low and high overpotential domains passing through a minimum around [H2SO4]:[HClO4] = 1:2 indicating the presence in the electrolyte of HSO4–/ClO
4
– anions leads to a considerable
reduction in the surface coverage by reaction intermediates. Analysis of Table 2 also reveals that the resistance imposed by reaction intermediates adsorbed at the electrode surface, Rads, suffers a considerable decrease on increasing Edc (it was found in all cases that Rads presents an exponential decay on increasing the electrode potential). It was also verified that Rads does not present any systematic dependence on the electrolyte composition.
Analysis of the Tafel behaviour. Figure 4 shows the
dependence of the charge transfer (Figure 4A), Rct, and the
Table 1. Influence of the electrolyte composition and the electrode potential on impedance parameters (RΩ, Cdl and Rct)
Electrolytea
[H2SO4]:[HClO4] RΩ / (Ω cm2) C dl / (µF cm
-2) R
ct / (mΩ cm
2) n
E / 1.75V E / 2.19V E / 1.75V E / 2.19V
0:6 0.33 105 11 378 310 0.98
1:58 0.38 110 11 245 232 0.97
1:22 0.45 112 11 287 224 0.93
1:10 0.40 113 17 326 257 0.98
1:6 0.35 114 50 331 270 0.95
1:4 0.55 115 90 271 229 0.97
1:3 0.44 120 100 390 327 0.94
1:2 0.51 123 99 387 319 0.97
1:1.4 0.60 114 99 321 260 0.99
1:1 0.38 110 98 337 269 0.91
1.5:1 0.30 112 97 383 304 0.93
2.5:1 0.44 116 97 325 306 0.98
5.5:1 0.42 122 102 286 229 0.92
3:0 0.55 128 107 287 225 0.98
a[H
2SO4] = 3.0 mol dm -3; [HClO
adsorption (Figure 4B), Rads, resistances on electrode potential. Analysis of the results shows a well-defined exponential decrease of the resistance with increasing electrode potential (Tafel’s law) is only attained in the case of Rads. Such behaviour is in agreement with the literature,10
and reveals the OER or OER/EOP electrode processes is governed by the resistance related to the adsorption impedance due to reaction intermediate formation.10,30,32
The Tafel behaviour, under conditions of the high field approximation, is described by the experimental profile10,30,32 Evs. log(R
ads
-1), and the Tafel coefficient, b,
can be obtained from the slope of the linear segment according to the definition b≡ (∂E/∂logRads–1)
T. In order
to provide a comparison of the Tafel slopes obtained from the EIS, polarisation curves (E vs. log(j)) under quasi-stationary conditions (n = 0.1 mV s-1)1-3 were recorded for
the several different electrolytes, using approximately the same electrode potential interval.
As discussed previously,1-3 in the case of acid medium
the current density in the high overpotential domain describes the OER/EOP processes at the β-PbO2, since persulphate formation at high overpotentials, in the case of electrolytes containing the sulphuric acid, can be considered negligible.1-3 Besides, considering a low current
efficiency for the ozone production (ΦEOP < 10%, see Table 4), it can be assumed that the electrode process leading to
EOP comprises a minor process from a kinetic point of view when compared to the OER. As discussed previously,1,7 the main contribution for the electrochemical
activation energy in the high overpotential domain comes from the OER processes.
Figure 5 shows Tafel plots already corrected for ohmic drop and obtained using different experimental techniques.
Figure 5 clearly shows two linear segments distributed in the low, b1, and high, b2, overpotential domains. In all cases we found that b1 < b2. A comparison of Figure 5A and 5B clearly reveals an excellent correspondence of the Tafel profiles obtained using different experimental Table 2. Dependence of the adsorption behaviour via CPE2 and the adsorption resistance on electrolyte composition and electrode potential
Electrolytea
[H2SO4]:[HClO4] T / (mF cm-2 s(n – 1)) R ads / (Ω cm
2) n
E / 1.75V E / 2.19V E / 1.75V E / 2.19V
0:6 90 78 64 0.27 0.93
1:58 87 81 70 0.25 0.91
1:22 85 107 75 0.24 0.89
1:10 83 189 74 0.25 0.95
1:6 84 107 78 0.18 0.91
1:4 85 75 53 0.22 0.88
1:3 80 70 73 0.23 0.91
1:2 72 62 70 0.20 0.90
1:1.4 78 70 76 0.21 0.93
1:1 82 79 71 0.23 0.91
1.5:1 85 85 74 0.22 0.89
2.5:1 90 90 68 0.22 0.91
5.5:1 95 100 60 0.19 0.90
3:0 108 137 53 0.20 0.89
a[H
2SO4] = 3.0 mol dm -3; [HClO
4] = 6.0 mol dm -3.
techniques. In the light of discussion presented above, we assumed that b1 mainly represents the OER, while b2
describes the OER/EOP processes.1-3
As previously discussed by Kötz and Stucki,7 the
polarisation curve representing the OER process on PbO2 at low current densities is characterised by a Tafel slope of ≅ 120 mV (see Table 3). However, at higher current densities where the O3 evolution takes place the Evs. log j
profile considerable depends on the procedure used for ohmic drop correction (positive feedback or current
interruption). These authors7 found that the IR
Ω
compensation via positive feedback leads to a second linear segment characterised by a higher Tafel slope (b1 <
b2), while in the special case of the current interruption technique an opposite behaviour was verified (b1 > b2). The latter was also verified by Amadelli et al.4,32 for the
OER/EOP processes on PbO2.
Kötz and Stucki7 argued that IR
Ω is not constant on
overpotential, and therefore the dynamic compensation for ohmic drop based on the current interruption is more appropriate than the positive feedback. Considering that a standard procedure for IRΩ correction is not available in
the literature, in our opinion the choice of a specific procedure in this case is merely arbitrary. In fact, recent reports1,3,8 clearly reveal the use of a different procedure
for IRΩ correction also provides a good linearisation of the Tafel curve in the high current density domain.
From the above considerations, we decided to present in the present work a comparative kinetic study based on application of the treatment proposed by Shub and Reznik35 and the impedance method for ohmic drop
correction of the polarisation curves obtained using different experimental approaches.
In the case of quasi-stationary polarisation curves the correction for the ohmic drop was carried out using the procedure proposed by Shub and Reznik,35 where the
influence of ohmic drop, IRΩ, on the polarisation curve can be written as:
Ec = Eapp - IRΩ = a + b log j (6)
where Ec is the corrected electrode potential, Eapp is the applied electrode potential, RΩ is the uncompensated ohmic resistance, a is a constant and b is the Tafel slope. According to the literature,36,37 the optimum R
Ω-value
is obtained using as criterion a correlation coefficient,
r, for the experimental data in the high overpotential domain higher than 0.9998. Depending on the quality of the experimental data, a very good linearisation of the corrected Tafel curve can be obtained. All Tafel curves, after ohmic drop correction, presented r ≥
0.9998.
For the several electrolyte compositions investigated,
RΩ values in the 0.3 to 0.8 Ω cm2 range were obtained.
These values are in excellent agreement with the corresponding ones obtained from EIS (see Table 1), and those reported in the literature1,8,21 for conductive metallic
oxide electrodes immersed in strong electrolytes. In the special case of the polarisation curves obtained from EIS the ohmic drop correction was carried out using next equation:
Ec = Eapp- IRΩ (7)
where RΩ is the uncompensated ohmic resistance obtained from the CNLS fit and I is the d.c. current available from the EIS data. The other symbols have their usual meaning already described.
The dependence of the Tafel slope on electrolyte compo-sition and the overpotential interval is presented in Table 3. A comparison of the Tafel slope values obtained from
EIS (E vs. log(Rads-1)) and quasi-stationary polarisation
curves (Evs. log(j)), revealed a good agreement between Figure 5. Tafel plots for the OER at β-PbO2. Experimental technique: (A)
these techniques. This internal consistency considerable supports the application of the procedure proposed by Shub and Reznik35 for IR
Ω correction and the significance of
the Tafel slope data obtained at higher current densities. Table 3 also shows that, with the exception for the pure HClO4 solution ([H2SO4]:[HClO4] = 0:6), b1 values do not depend on electrolyte composition. On the contrary, b2 values depend on electrolyte composition, indicating electrode kinetics in the high overpotential domain are affected by the nature of the anions at the electrode/solution interface. Table 3 reveals the maximum b2 value is presented by the electrolyte composition having a [H2SO4]:[HClO4] = 1:10 ratio, while for the composition interval between 1:2 and 2.5:1 a b2 value of ~ 370 mV is observed. The minimum Tafel slope is displayed by pure sulphuric acid. Similar results were reported by Chernik et al.,11 who reported b
2 values higher than 300
mV for the OER/EOP processes taking place on PbO2 and Pt in concentrated H2SO4 solution.
Interpretation of these abnormal Tafel slope values observed in the high overpotential domain is rather difficult from a theoretical point of view. A careful theoretical analysis of the complex behaviour presented by the Tafel slope for electrode processes taking place at solid electrodes was presented by several authors.38-41
As previously discussed for the PbO2 electrode,1-3,8,33
abnormal Tafel slopes can be attributed to anion adsorption and bubble adherence on the electrode surface. A revision of the literature reports1-4,7,11,26,33 reveals abnormal Tafel slope
values in the high overpotential domain for the OER/EOP processes at the β-PbO2 electrode present values covering the 70 to 634 mV interval. Rationalisation of these data
supports changes in the Tafel slope, especially in the high overpotential domain, are associated with factors such as: (i) electrodeposition conditions, which control the fraction of α and β-forms of the oxide and the electrode morphology; (ii) chemical composition and concentration of the electrolyte, and (iii) experimental procedure used to record polarisation curves.
However, considering the experimental conditions used in this work, and the experimental findings reported previously,1,3 one can in principle exclude contributions due
to factors (i) and (iii). Therefore, one can assume the anomalous Tafel behaviour observed in the high overpotential domain (where the OER/EOP takes place) is mainly caused by the anion adsorption at the lead dioxide electrode.
As discussed previously the comparison of findings obtained in different laboratories is rather difficult in the most of cases due to the influence of the procedure used to perform the ohmic drop correction on the Tafel slope.7 In order to
circumvent this inconvenient we used different procedures for ohmic drop correction, which furnished a very good internal consistency for the Tafel slopes obtained via d.c. (conventional polarisation) and a.c. (EIS) techniques.
Electrode mechanism for the OER/EOP processes.
Simul-taneous O2 and O3 formation at the β-PbO2 electrode can be represented by next electrode mechanism:1,3
Experimental b-values higher than 120 mV support step (a), known as primary water discharge, as rate determining step, r.d.s., of the electrode process, and indicates the effective (apparent) electronic transfer coefficient (αap)1-3,8
is lower than 0.5. Taking into account literature reports,38,40,41
the concept of the “effective” electronic transfer coefficient can be used to represent the non-ideal behaviour caused, Table 3. Dependence of the Tafel slope on electrolyte composition and
overpotential interval
Electrolytea
[H2SO4]:[HClO4] b1b/ mV b 2
b/ mV
low η high η
(EIS) (E vs. log j) (EIS) (E vs. log j)
0:6 130 138 390 410
1:58 120 125 420 440
1:22 120 128 410 440
1:10 120 132 430 490
1:6 120 120 390 385
1:4 120 130 400 420
1:3 120 125 375 390
1:2 120 118 365 370
1:1.4 120 127 363 373
1:1 120 131 363 375
1.5:1 120 120 365 370
2.5:1 120 128 365 371
5.5:1 120 120 330 335
3:0 120 125 300 310
a[H
2SO4] = 3.0 mol dm -3; [HClO
4] = 6.0 mol dm
-3; b obtained from Tafel
curves corrected for ohmic drop.
Electrochemical steps
Kinetic control: b/mV (α = 0.5; T = 25 oC)
(H2O)ads → (OH•) ads + H
+ + e– r.d.s. 120 (a)
(OH•) ads → (O
•) ads + H
+ + e– 40 (b)
Chemical steps
Efficiency control:
(O•)
ads→ [1-θ](O •)
ads + θ(O •)*
ads, (0 < θ < 1) (c)
[1-θ](2O•)
ads→ [1-θ](O2)ads 15 (d)
[1-θ](O2)ads → [1-β][1-θ](O2)ads + β[1-θ](O2)*ads (0 < β < 1) (e)
Oxygen evolution:
[1-β][1-θ](O2)ads→ O2↑ (f)
Ozone formation:
θ(O•)*
ads + β[1-θ](O2)*ads → [θ+β(1-θ)](O3)ads 10 (g)
[q+b(1-q)](O3)ads→ O3↑ (h)
mainly, by anion adsorption and the non-uniform distribution of the surface electric field on rugged electrodes. Considering step (a) as r.d., according to Böckris,42
the reaction rate, j, is given by next equation:
j = kf[H2O](1-θOH•)exp(αFη/RT) - kbθOH•exp[-(1-α)Fη/RT] (8)
where kf and kb are the forward and the backward rate constants, η(≡E – Eo) is the overpotential, θ
OH• is the surface
coverage by the hydroxyl radical, and α is the electronic transfer coefficient describing the symmetry of the energy barrier for the electron transfer (0 < α < 1).43 In this ideal
case α is an absolute constant. According to Erdey-Gruz and Wick,44 the special theoretical case where α = 0.5 represents
the situation where the energy barrier for the electron transfer lies in the middle of the electric field of the double layer.
Considering negligible the OH•-surface concentration
(θOH•→ 0), for conditions of the high field approximation (for η≥ 0.1V), equation 8 reduces to next relation:
j≅ kf[H2O]exp(αFη/RT) (9)
Taking into account the considerations presented above, equation 9 represents the ideal current-overpotential relation describing the OER/EOP processes taking place at inert electrodes. In this ideal case the electron transfer is characterised by a constant α-value, which represents a constant symmetry of the energy barrier for the whole overpotential domain.43
Alternatively, the admittance, Y = (∂j/∂η)T, related to step (a) can be obtained from equation 9 furnishing next expression:
Y = {kf[H2O]αF/RT}exp(αFη/RT) (10)
So, considering Y = R-1, the theoretical expression for
the dependence of the resistance due to primary water discharge step, Rpwd, on overpotential is given by next equation:
Rpwd = Roexp{-αFη/RT} (11)
where Ro (Ω cm2) = RT/k
f[H2O]αF. Equation 11 is an
equivalent form of equation 9 which represents the theoretical resistance(Rpwd)-overpotential relation describing the electron transfer.
A comparison of equation 11 obtained from the electrode mechanism presented above with the resistive elements present in the EC model (see Figure 1), reveals
Rpwd has the significance of Rads (see Figure 4B), thus indicating the adsorption resistance associated with the
hydroxyl radical production (see electrode mechanism, step (a)) governs the OER and OER/EOP kinetics at the lead dioxide electrode in acid medium.
According to equation 9 (d.c. case) and equation 11 (a.c. case) the theoretically predicted Tafel slope is 2.302RT/αF. So, considering T = 24 oC and α = 0.5, one has b = 120 mV.
Confronting experimental b-values (see Table 3) with the theoretically predicted value of 120 mV, a discrepancy between the theoretical and the experimental Tafel slopes obtained in the high overpotential domain is observed. The ideal case represented by equations 9 and 11, which predicts the electronic transfer coefficient as an absolute constant, is indeed not sustained by several different experimental findings.1-3,11,33 As already mentioned above, this non-ideal
behaviour can be theoretically treated using the concept of the “effective” (apparent) electronic transfer coefficient (αap). Considering the high quality of the experimental data (see Figure 5), this behaviour clearly supports the electron transfer process in the high overpotential domain is characterised by αap < 0.5, thus indicating a considerable deviation from the ideal behaviour. These findings indicate the influence of the anion adsorption on the OER/EOP
kinetics is more pronounced in the high overpotential domain where a stronger interaction between the electrode surface and the anions takes place. In fact, Kokarev et al.34 found that the anion adsorption increases on
increasing the electrode potential. This non-ideal behaviour presented by b2-values was reported for different electrode processes (e.g. OER and OER/EOP).1-3,9,33,45-47
In the light of the discussion presented above, the deviation from the ideal behaviour presented by the Tafel slope in the high overpotential domain can be mainly attributed to modifications in the double layer properties caused by the anion adsorption. According to Parsons and Böckris,48 the adsorption of non-active species such as
anions at the electrode surface affects the electronic transfer coefficient due to changes suffered by the double layer structure, thus resulting in a non-ideal behaviour for the electron transfer process. A complementary study carried out by different authors49,50 showed the main factor affecting
the electronic transfer coefficient is associated with the effect of the ion penetration in the inner region of the double layer (ψi-effect), which leads to a considerable modification
in location of the plane of discharging ions.
Influence of electrolyte composition on EOP current efficiency, ΦEOP
Table 4 presents the dependence of EOP current efficiency on electrolyte composition at 0 oC and j = 0.9
The ΦEOP-values clearly reveal a dependency of the ozone production on electrolyte composition. ΦEOP-values obtained for pure electrolytes are in good agreement with the literature reports.1-3,6 From a theoretical point of view,1-3,8
the minimum observed in the ΦEOP-values for mixed electrolytes indicates the presence of different anions (HSO4–/ClO
4
–) at the β-PbO
2/solution interface changes the
stability of the adsorbed O• intermediate (surface coverage
by this intermediate) and/or the degree of hydrophobicity of the electrode/electrolyte interface, resulting in a reduction of the surface concentration of the active centres leading to
EOP, necessary for the surface process O•
(ads) + O2(ads) →
(O3)ads to take place. This behaviour, contrary to the considerable improvement gained in ozone production by introduction of fluoro-compounds into the base electrolyte1-3
(e.g. H2SO4), reveals these mixed electrolytes containing mainly HSO4– and ClO
4
– anions are not adequate for
electrochemical ozone generation at the β-PbO2 electrode.
Conclusions
The behaviour of the β-PbO2/solution interface and kinetics of the OER, in the low and high overpotential domains, was investigated as function of electrolyte composition by means of electrochemical impedance spectroscopy and quasi-stationary polarisation curves. The kinetic study revealed the influence of the electrolyte composition on the OER kinetics depends on overpotential domain. The dependence of the adsorption pseudo-capacitance on the electrolyte composition, denounces the presence of the HSO4–/ClO
4
– anions at the electrode/
electrolyte interface reduces the surface coverage by the intermediates leading to the oxygen and oxygen/ozone production.
A comparison of the Tafel slope data obtained for the
OER/EOP processes in the high overpotential domain
from impedance data and quasi-stationary polarisation curves, after ohmic drop correction carried out using different procedures, revealed a very good agreement, thus supporting the experimental findings obtained in these experimental approaches are reliable from the kinetic point of view.
Tafel slope data supported primary water discharge as rate determining step of the overall electrode process leading to OER/EOP processes. Tafel slope higher than 120 mV indicates a reduction in the apparent (effective) electronic transfer coefficient in the high overpotential domain. This non-ideal behaviour was attributed mainly to the influence of the anion adsorption on the double layer properties, which is more pronounced at higher overpotentials, where a stronger interaction between the electrode surface and the anions takes place, thus leading to a considerable change in the apparent electronic transfer coefficient.
Current efficiency data for EOP is minimum for mixed electrolytes indicating the presence of HSO4–/ClO
4 – anions
at the β-PbO2/solution interface leads to a reduction in the surface concentration of the active centres leading to
EOP. As a result the performance of the electrolyte for this process when compared to pure acid solutions is reduced. These findings support mixtures of sulphuric and perchloric acid are not good as electrolytes for electrochemical ozone production.
Acknowledgments
D. V. Franco wishes to thank the CAPES Foundation. L. M. Da Silva and W. F. Jardim acknowledge the FAPESP Foundation. J. F. C. Boodts acknowledges a Visiting Researcher fellowship granted by the FAPEMIG Foundation.
References
1. Da Silva, L. M.; de Faria, L. A.; Boodts, J. F. C.; Electrochim. Acta2003, 48, 699.
2. Da Silva, L. M.; Ph.D. Thesis, Chemistry Department/FFCLRP of the Universidade de São Paulo, 2004.
3. Da Silva, L. M.; de Faria, L. A.; Boodts, J. F. C.; Pure Appl. Chem. 2001, 73, 1871.
4. Amadelli, R.; Maldotti, A.; Moluiari, A.; Danilov, F. I.; Velichenko, A. B.; J. Electroanal. Chem. 2002, 534, 1. 5. Da Silva, L. M.; Santana, M. H. P.; Boodts, J. F. C.; Quim.
Nova2003, 26, 880.
6. Foller, P. C.; Tobias, W.; J. Electrochem. Soc. 1982, 129, 506. Table 4. Dependence of the EOP current efficiency on electrolyte
com-position. T = 0 oC and j = 0.90 A cm-2
Electrolytea [H
2SO4]:[HClO4] ΦEOP / (%)
0:6 3.5
1:58 2.0
1:22 1.5
1:10 1.3
1:6 1.5
1:4 2.0
1:3 2.2
1:2 2.4
1:1.4 2.4
1:1 2.6
1.5:1 2.6
2.5:1 2.7
5.5:1 2.7
3:0 2.9
a[H
2SO4] = 3.0 mol dm -3; [HClO
7. Kötz, R.; Stucki, S.; J. Electroanal. Chem. 1987, 228, 407. 8. Da Silva, L. M.; Franco, D. V.; de Faria, L. A.; Boodts, J. F. C.;
Electrochim. Acta2004, 49, 3977.
9. Pavlov, D.; Monahov, B.; J. Electrochem. Soc. 1996, 143, 3616. 10. Ho, J. C. K.; Tremiliosi Filho, G.; Simpraga, R.; Conway, B.
E.; J. Electroanal. Chem. 1994, 366, 147.
11. Chernik, A. A.; Drozdovich, V. B.; Zharskii, I. M.; Russ. J. Electrochem. 1997, 33, 259.
12. Trasatti, S.; Electrodes of Conductive Metallic Oxides, Parts A and B, Elsevier: Amsterdam, 1981.
13. Pavlov, D.; J. Electrochem. Soc. 1992, 139, 3075. 14. Kramers, H.; Phyz. Z. 1929,30, 521.
15. de Kronig, R. L.; J. Opt. Soc. Ann. 1926, 12, 547. 16. Boukamp, B. A.; Solid State Ionics1986, 20, 31.
17. Leitzke, O.; Internationales Symposium Ozon und Wasser, Berlin, 1977, p. 164.
18. Da Silva, L. M.; Fernandes, K. C.; de Faria, L. A.; Boodts, J. F. C.; Electrochim. Acta2004, 49, 4893.
19. Da Silva, L. M.; de Faria, L. A.; Boodts, J. F. C.; J. Electroanal. Chem. 2002, 532, 141.
20. Qian, S. Y.; Conway, B. E.; Jerkiewicz, G.; Int. J. Hydrogen Energy2000, 25, 539.
21. Alves, V. A.; da Silva, L. A.; Boodts, J. F. C.; Electrochim. Acta
1998, 44, 1525.
22. Li, F. B.; Hillman, R.; Lubetkin, S. D.; Electrochim. Acta1992,
37, 2715.
23. Bisquert, J.; Randriamahazaka, H.; Garcia-Belmonte, G.;
Electrochim. Acta2005, 51, 627.
24. Macdonald, J. R.; Impedance Spectroscopy, John Wiley and Sons: New York, 1987.
25. Choquette, Y.; Lasia, A.; Brossard, L.; Menard, H.; J. Electrochem. Soc.1990, 137, 1723.
26. Piela, B.; Wrona, P. K.; J. Electroanal. Chem.1995, 388, 69. 27. Brug, G. J.; van den Eeden, A. L. G.; Sluyters-Rehbach, M.;
Sluyters, J. H.; J. Electroanal. Chem. 1984, 176, 275. 28. Shervedani, R. K.; Lasia, A.; J. Electrochem. Soc.1997, 144,
2652.
29. Hitz, C.; Lasia, A.; J. Electroanal. Chem.2001, 500, 213.
30. Harrington, D. A.; Conway, B. E.; Electrochim. Acta 1987, 32, 1703.
31. Kleitz, K.; Kennedy, J. M. In Resolution of Multicomponent Impedance Diagrams; Vashista, P.; Mundy, J. N.; Shenoy, A., eds., Elsevier: Amsterdam, 1979.
32. Amadelli, R.; Armelao, L.; Velichenko, A. B.; Nikolenko, N. V.; Girenko, D. V.; Kovalyov, S. V.; Danilov, F. I.; Electrochim. Acta1999, 45, 713.
33. Ho, C. N.; Hwang, B. I.; J. Electroanal. Chem.1994, 377, 177. 34. Kokarev, G. A.; Kolesnikov, V. A.; Gorokhova, L. T.; Fioshin,
M. Ya.; Kazarinov, V. E.; Élektrokhimiya1984, 20, 1155. 35. Shub, D. M.; Reznik, M.F.; Élektrokhimiya1985,21, 855. 36. Da Silva, L. M.; Boodts, J. F. C.; de Faria, L. A.; Electrochim.
Acta2001,46, 1369.
37. Fernandes, K. C.; Da Silva, L. M.; Boodts, J. F. C.; de Faria, L. A.; Electrochim. Acta2006,51, 2809.
38. Rüetschi, P.; J. Electrochem. Soc. 1959, 106, 819.
39. Conway, B. E.; Mackinnon, D. J.; Tilak, B. V.; Trans. Faraday Soc. 1970, 66, 1203.
40. Mulder, W. H.; Sluyters, J. H.; Pajkossy, T.; Nyikos, L.; J. Electroanal. Chem. 1990, 285, 103.
41. Filoche, M.; Sapoval, B.; Electrochim. Acta2000, 46, 213. 42. Böckris, J. O’M.; Reddy, A. K. N.; Modern Electrochemistry,
Plenum Press: New York, 1977.
43. Eyring, H.;. Glasstone, S.; Laidler, K. J.; J. Chem. Phys.1939,
7, 1053.
44. Erdey-Gruz, T.; Wick, H.; Z. Physik. Chem.1932, A162, 53. 45. Darowicki, K.; Orlikowski, J.; J. Electrochem. Soc.1999, 146,
663.
46. Dzhaparidze, Dzh. I.; Shavgulidze, V. V.; Élektrokhimiya1975,
11, 440.
47. Mordvinova, N. M.; Stromberg, A. G.; Kaplin, A. A.; Veits, N. A.; Élektrokhimiya1984,20, 513.
48. Parsons, R.; Böckris, J. O’M.; Trans. Faraday Soc.1951, 47, 914.
49. Krishtalik, L. I.; J. Electroanal. Chem.1972,35, 157. 50. Imai, H.; Delahay, P.; J. Phys. Chem. 1962,66, 1683.
Received: August 8, 2005 Published on the web: May 26, 2006


![Table 3 also shows that, with the exception for the pure HClO 4 solution ([H 2 SO 4 ]:[HClO 4 ] = 0:6), b 1 values do not depend on electrolyte composition](https://thumb-eu.123doks.com/thumbv2/123dok_br/18991300.460737/9.892.66.413.148.437/table-shows-exception-solution-values-depend-electrolyte-composition.webp)

