arXiv:1108.6308v2 [hep-ex] 28 Dec 2011
CERN-PH-EP-2011-134 Submitted to Physical Review D
Measurement of the Transverse Momentum Distribution of
W
Bosons in
pp Collisions at
√
s = 7 TeV with the ATLAS Detector
The ATLAS Collaboration
(Dated: November 3, 2011)
Abstract
This paper describes a measurement of the W boson transverse momentum distribution using ATLAS pp collision data from the 2010 run of the LHC at √s = 7 TeV, corresponding to an integrated luminosity of about 31 pb−1. Events from both W → eν and W → µν are used, and the transverse momentum of the W candidates is measured through the energy deposition in the calorimeter from the recoil of the W . The resulting distributions are unfolded to obtain the normalized differential cross sections as a function of the W boson transverse momentum. We present results for pW
T < 300 GeV in the electron and muon channels as well as for their combination, and compare the combined results to the predictions of perturbative QCD and a selection of event generators.
I. INTRODUCTION
At hadron colliders, W and Z bosons are produced with non-zero momentum transverse to the beam direction due to parton radiation from the initial state. Measuring the transverse
momentum (pT) distributions of W and Z bosons at the LHC provides a useful test of
QCD calculations, because different types of calculations are expected to produce the most accurate predictions for the low-pT and high-pT parts of the spectrum. This measurement
complements studies which constrain the proton parton distribution functions (PDFs), such as the W lepton charge asymmetry in pp collisions [1], because the dynamics which generate transverse momentum in the W do not depend strongly on the distribution of the proton momentum among the partons. The W pT is reconstructed in W → ℓν events (where ℓ = e or
µ in this paper). Because of the neutrino in the final state, the W pT must be reconstructed
through the hadronic recoil, which is the energy observed in the calorimeter excluding the lepton signature. This measurement is therefore also complementary to measurements of the Z pT, which is measured using Z → ℓℓ events in which the Z pT is reconstructed via the
momentum of the lepton pair [2]. Although the underlying dynamics being tested are similar, the uncertainties on the W and Z measurements are different and mostly uncorrelated. The transverse energy resolution of the hadronic recoil is not as good as the resolution on the lepton momenta, but approximately 10 times as many candidate events are available ((σW · BR(W → ℓν))/(σZ · BR(Z → ℓℓ)) = 10.840 ± 0.054 [3]). Testing the modeling of
the hadronic recoil through the W pT distribution is also an important input to precision
measurements using the W → ℓν sample, including especially the W mass measurement. In this paper, we describe a measurement of the transverse momentum distribution of W bosons using ATLAS data from pp collisions at √s = 7 TeV at the LHC [4], corresponding
to about 31 pb−1 of integrated luminosity. The measurement is performed in both the
electron and muon channels, and the reconstructed W pT distribution, following background
subtraction, is unfolded to the true pT distribution. Throughout this paper, pRT is used to
refer to the reconstructed W pT and pWT is used to refer to the true W pT. The true W
pT may be defined in three ways. The default in this paper is the pT that appears in the
W boson propagator at the Born level, since this definition of pW
T is independent of the
lepton flavor and the electron and muon measurements can be combined. It is also possible to define pW
the inclusion of QED final state radiation (FSR). These define a physical final state more readily identified with the detected particles, so we give results for these definitions of pW T
for the electron and muon channels. For all three definitions of pW
T , photons radiated by the
W via the W W γ triple gauge coupling vertex are treated identically to those radiated by a charged lepton.
The unfolding proceeds in two steps. First, a Bayesian technique is used to unfold the reconstructed distribution (pR
T) to the true distribution (p W
T ) for selected events, taking
into account bin-to-bin migration effects via a response matrix describing the probabilistic
mapping from pW
T to pRT. This step corrects for the hadronic recoil resolution. Second, the
resulting distribution is divided in each bin by the detection efficiency, defined as the ratio of the number of events reconstructed to the number produced in the phase space consistent with the event selection. This converts the pW
T distribution for selected events into the pWT
distribution for all W events produced in the fiducial volume, which is defined by pℓ T >
20 GeV, |ηℓ| < 2.4, pνT > 25 GeV, and transverse mass mT =p2pℓTpνT(1 − cos(ϕℓ− ϕν)) >
40 GeV [5], where the thresholds are defined in terms of the true lepton kinematics.
The unfolding results in the differential fiducial cross section dσfid/dpWT , in which the
sub-script in σfid indicates that the cross section measured is the one for events produced within
the phase space defined above. The electron and muon differential cross sections are com-bined into a single measurement via χ2 minimization, using a covariance matrix describing
all uncertainties and taking into account the correlations between the measurement channels as well as across the pW
T bins. The resulting differential cross section is normalized to the
total measured fiducial cross section, which results in the cancellation of some uncertainties, and compared to predictions from different event generators and perturbative QCD (pQCD) calculations.
This paper is organized as follows. Section II reviews the existing calculations and mea-surements of pW
T . The relevant components of the ATLAS detector are described in
Sec-tion III and the generaSec-tion of the simulated data used is described in SecSec-tion IV. The event selection is given in Section V and the estimation of the backgrounds remaining after that selection is explained in Section VI. The unfolding procedure is described in Section VII. Section VIII summarizes the systematic uncertainties. The electron and muon channel re-sults, the combination procedure, and the combined results are all given in Section IX. We conclude with a discussion of the main observations in Section X.
II. QCD PREDICTIONS AND PREVIOUS MEASUREMENTS
At leading order, the W boson is produced with zero momentum transverse to the beam line. Non-zero pT is generated through the emission of partons in the initial state. At
low pT, this is dominated by multiple soft or almost collinear partons, but at higher pT, the
emission of one or more hard partons becomes the dominant effect. Because of this, different calculations of dσ/dpW
T may be better suited for different ranges of p W T .
At large pW
T (pWT ∼> 30 GeV), the spectrum is determined primarily by hard parton
emission, and perturbative QCD (pQCD) calculations at a fixed order of αs are expected
to predict dσ/dpW
T reliably [6]. The inclusive cross section prediction is finite, but the
differential cross section diverges as pW
T approaches zero. Differential cross sections calculated
to O(α2
s) are available for Z/γ∗ production through the FEWZ [7, 8] and DYNNLO [9, 10]
programs, and are becoming available for the W . The MCFM generator [11] can predict pW
T at O(α2s) through the next-to-leading order (NLO) calculation of the W + 1 parton
differential cross section. As pW
T becomes small, contributions at higher powers of αs describing the production of
soft gluons grow in importance. These terms also contain factors of ln(M2
W/(pWT )2) which
diverge for vanishing pW
T . The pWT distribution is better modeled in this regime by
calcula-tions that resum logarithmically divergent terms to all orders in αs [6, 12, 13]. The Resbos
generator [13–15] resums the leading contributions up to the next-to-next-to-leading loga-rithms (NNLL), and matches the resummed calculation to an O(αs) calculation, corrected
to O(α2
s) using a k-factor depending on pT and rapidity, to extend the prediction to large pWT .
It also includes a non-perturbative parametrization, tuned to Drell-Yan data from several experiments [15, 16], to model the lowest pW
T values.
Parton shower algorithms such as Pythia [17] and Herwig [18] can also provide finite predictions of dσ/dpW
T in the low-pWT region by describing the soft gluon radiation effects
through the iterative splitting and radiation of partons. Pythia implements leading-order matrix element calculations with a parton shower algorithm that has been tuned to match the pZ
T data from the Tevatron [19–21]. Similarly, the Mc@nlo [22] and Powheg [23–26]
event generators combine NLO (O(αs)) matrix element calculations with a parton shower
algorithm to produce differential cross section predictions that are finite for all pW T .
orders in αs (up to five), but only include the tree-level terms which describe the production
of hard partons. Parton shower algorithms can be run on the resulting events, with double-counting of parton emissions in the phase space overlap between the matrix element and parton shower algorithms removed through a veto [27] or by reweighting [29, 30]. Although these calculations do not include virtual corrections to the LO process, they are relevant for comparison to the highest pT part of the pWT spectrum, which includes contributions from a
W recoiling against multiple high-pT jets.
The W pT distribution has been measured most recently at the Tevatron with Run I
data (p¯p collisions at √s = 1.8 TeV) by both CDF [31] and D0 [32]. Both of these results are limited by the number of candidate events used (less than 1000), and by the partial unfolding which does not take into account bin-to-bin correlations. The present analysis uses more than 100,000 candidates per channel and a full unfolding of the hadronic recoil which takes into account correlations between bins, resulting in greater precision overall and inclusion of higher-pW
T events compared to the Tevatron results.
Although this is the first measurement of the W pT distribution at the LHC, the W → ℓν
sample at √s = 7 TeV has been studied recently by both the ATLAS and CMS
collabo-rations. The ATLAS collaboration has measured the inclusive W → ℓν cross section [3] and the lepton charge asymmetry in W → µν events [1]. The CMS collaboration has also measured the inclusive cross section [33], and has measured the polarization of W s produced with pW
T > 50 GeV, demonstrating that the majority of W bosons produced at large pT in
pp collisions are left-handed, as predicted by the standard model [34].
III. THE ATLAS DETECTOR AND THE pp DATASET
A. The ATLAS Detector
The ATLAS detector [35] at the LHC consists of concentric cylindrical layers of inner tracking, calorimetry, and outer (muon) tracking, with both the inner and outer tracking volumes contained, or partially contained, in the fields of superconducting magnets to enable measurement of charged particle momenta.
The inner detector (ID) allows precision tracking of charged particles within |η| ∼ 2.5. It surrounds the interaction point, inside a superconducting solenoid which produces a 2 T
axial field. The innermost layers constitute the pixel detector, arranged in three layers, both barrel and endcap. The semi-conductor tracker (SCT) is located at intermediate radii in the barrel and intermediate z for the endcaps, and consists of four double-sided silicon strip layers with the strips offset by a small angle to allow reconstruction of three-dimensional space points. The outer layers, the transition radiation tracker (TRT), are straw tubes which provide up to 36 additional R − ϕ position measurements, interleaved with thin layers of material which stimulate the production of transition radiation. This radiation is then detected as a higher ionization signal in the straw tubes, and exploited to distinguish electron from pions.
The calorimeter separates the inner detector from the muon spectrometer and measures particle energies over the range |η| < 4.9. The liquid argon (LAr) electromagnetic (EM) calorimeter uses a lead absorber in folded layers designed to minimize gaps in coverage. It is segmented in depth to enable better particle shower reconstruction. The innermost layer (“compartment”) is instrumented with strips that precisely measure the shower location in η. The middle compartment is deep enough to contain most of the electromagnetic shower produced by a typical electron or photon. The outermost compartment has the coarsest spa-tial resolution and is used to quantify how much of the particle shower has leaked back into the hadronic calorimeter. The hadronic calorimeter surrounds the electromagnetic calorime-ter and extends the instrumented depth of the calorimecalorime-ter to fully contain hadronic particle showers. Its central part, covering |η| < 1.7, is the tile calorimeter, which is constructed of alternating layers of steel and scintillating plastic tiles. Starting at |η| ∼ 1.5 and extending to |η| ∼ 3.2, the hadronic calorimeter is part of the liquid argon calorimeter system, but with a geometry different from the EM calorimeter and with copper and tungsten as the absorbing material. The forward calorimeters (FCAL), also using liquid argon, extend the coverage up to |η| ∼ 4.9.
The muon chambers and the superconducting air-core toroid magnets, located beyond the calorimeters, constitute the muon spectrometer (MS). Precision tracking in the bending plane (R − η) for both the barrel and the endcaps is performed by means of monitored drift tubes (MDTs). Cathode strip chambers (CSCs) provide precision η − ϕ space points in the innermost layer of the endcap, for 2.0 < |η| < 2.7. The muon triggers are implemented via resistive plate chambers (RPCs) and thin-gap chambers (TGCs) in the barrel and endcap, respectively. In addition to fast reconstruction of three-dimensional space points for muon
triggering, these detectors provide ϕ hit information complementary to the precision η hits from the MDTs for muon reconstruction.
B. Online Selection
The online selection of events is based on rapid reconstruction and identification of charged leptons, and the requirement of at least one charged lepton candidate observed in the event. The trigger system implementing the online selection has three levels: Level 1, which is implemented in hardware; Level 2, which runs specialized reconstruction software on full-granularity detector information within a spatially limited “Region of Interest”; and the Event Filter, which reconstructs events using algorithms and object definitions nearly identical to those used offline.
In the electron channel, the Level 1 hardware selects events with at least one localized region (“cluster”) of significant energy deposition in the electromagnetic calorimeter with ET > 10 GeV. Level 2 and the Event Filter check for electron candidates in events passing
the Level 1 selection, and accept events with at least one electron candidate with ET >
15 GeV. The electron identification includes matching of an inner detector track to the electromagnetic cluster and requirements on the cluster shape. The trigger efficiency relative to offline electrons as defined below is close to 100% within the statistical uncertainties in both data and simulation.
The online selection of muon events starts from the identification of hit patterns consistent with a track in the muon spectrometer at Level 1. For the first half of the data used in this analysis, there is no explicit threshold for the transverse momentum at Level 1, but in the second half, to cope with increased rates from the higher instantaneous luminosity, a threshold of 10 GeV is used. Level 2 and the Event Filter attempt to reconstruct muons in events passing the Level 1 trigger using an ID track matched to a track segment in the MS. Both apply a pT threshold of 13 GeV for all of the data used in this analysis. The trigger
efficiency relative to the offline combined muon defined below is a function of the muon pT
and η, and varies between 67% and 96%. Due to its larger geometrical coverage, the endcap trigger is more efficient than the barrel trigger. The trigger path starting from a Level 1 trigger with no explicit pT threshold is slightly more efficient (1-2%) than the one with a 10
C. Data Quality Requirements and Integrated Luminosity
Events used in this analysis were collected during stable beams operation of the LHC in 2010 at √s = 7 TeV with all needed detector components functioning nominally, including the inner detector, calorimeter, muon spectrometer, and magnets. The integrated luminosity is 31.4 ± 1.1 pb−1 in the electron channel and 30.2 ± 1.0 pb−1 in the muon channel [36, 37].
IV. EVENT SIMULATION
Simulated data are used to calculate the efficiency for the W → ℓν signal, to estimate the number of background events and their distribution in pR
T, to construct the response matrix,
and to compare the resulting normalized differential cross section (1/σfid)(dσfid/dpWT ) to a
variety of predictions.
The simulated W → ℓν events used to calculate the reconstruction efficiency correc-tion and to construct the data-driven response matrix are generated using Pythia version
6.421 [17] with the MRST 2007 LO∗ PDF set [38]. The electroweak backgrounds (W → τν
and Z/γ∗ → ℓ+ℓ−) are estimated using other Pythia samples generated in the same way.
Simulated t¯t and single-top events are generated using Mc@nlo version 3.41 [22] and the CTEQ6.6 PDF set [39]. For those samples, the Herwig generator version 6.510 [18] is used for parton showering and Jimmy version 4.1 [40] is used to model the underlying event. The muon channel multijet background estimate uses a set of Pythia dijet samples with a generator-level filter requiring at least one muon with |η| < 3.0 and pT > 8 GeV. The
multijet background estimate in the electron channel uses a Pythia dijet sample with a generator-level filter requiring particles with energy totaling at least 17 GeV in a cone of radius ∆R = p(∆η)2+ (∆ϕ)2 = 0.05. In both channels, the normalization of the multijet
background is set by the data. The multijet samples are used to provide an initial esti-mate of the background in the electron channel, and to extrapolate data-driven background estimates from control data to the signal region in the muon channel.
In all of the simulated data, QED radiation of photons from charged leptons was modeled using PHOTOS version 2.15.4 [41] and taus were decayed by TAUOLA version 1.0.2 [42]. The underlying event and multiple interactions were simulated according to the ATLAS MC09 tunes [43], which take information from the Tevatron into account. Additional
in-elastic collisions so generated are overlaid on top of the hard-scattering event to simulate the effect of multiple interactions per bunch crossing (“pile-up”). The number of additional interactions is randomly generated following a Poisson distribution with a mean of two. Simulated events are then reweighted so that the distribution of the number of inelastic collisions per bunch crossing matches that in the data, which has an average of 1.2 addi-tional collisions. The interaction of the generated particles with the ATLAS detector was simulated by GEANT4 [44, 45]. The simulated data are reconstructed and analyzed with the same software as the pp collision data.
The electroweak and top quark background predictions are normalized using the calcu-lated production cross sections for those processes. For W and Z backgrounds, the cross sections are calculated to next-to-next-to-leading-order (NNLO) using FEWZ [7, 8] with the MSTW 2008 [46] PDFs (see Ref. [3] for details). The t¯t cross section is calculated at NLO with the leading NNLO terms included [47], setting mt= 172.5 GeV and using the CTEQ6.6
PDF set. The single-top cross section is calculated using Mc@nlo with mt = 172.5 GeV
and using the CTEQ6M PDF set.
We correct simulated events for differences with respect to the data in the lepton recon-struction and identification efficiencies as well as in energy (momentum) scale and resolution. The efficiencies are determined from selected W and Z events, using the “tag-and-probe” method [3]. The resolution and scale corrections are obtained from a fit to the observed Z boson line shape.
Additional W → ℓν samples from event generators other than Pythia are used for comparison with the measured differential cross section (1/σfid)(dσfid/dpWT ). The Mc@nlo
sample used is generated with the same parameters as the t¯t sample described above. The
Powheg events are generated using the same CTEQ6.6 PDF set as the main Pythia
W → ℓν samples, and Powheg is interfaced to Pythia for parton showering and hadroniza-tion. Alpgen version 2.13 [27] matrix element calculations are interfaced to the Herwig version 6.510 [18] parton shower algorithm, and use Jimmy version 4.31 [40] to model the un-derlying event contributions. These events are generated using the CTEQ6L1 PDF set [48]. Sherpaevent generation was done using version 1.3.0 [28], which includes a Catani-Seymour subtraction based parton shower model [49], matrix element merging with truncated show-ers [29] and high-multiplicity matrix elements generated by Comix [50]. The CTEQ6L1 PDF set is used, and the renormalization and factorization scales are set dynamically for
each event according to the default Sherpa prescription.
V. RECONSTRUCTION AND EVENT SELECTION
The pW
T measurement is performed on a sample of candidate W → ℓν events, which are
reconstructed in the final state with one high-pT electron or muon and missing transverse
energy sufficient to indicate the presence of a neutrino.
The event selection used in this paper closely follows that used in the inclusive W cross section measurement presented in Ref. [3]. The selection in the muon channel is identi-cal to that used in the W lepton charge asymmetry measurement in Ref. [1]. The event reconstruction and W candidate selection are summarized here.
A. Lepton (e, µ, and ν) Reconstruction
Electrons are reconstructed as inner detector tracks pointing to particle showers re-constructed as a cluster of cells with significant energy deposition in the electromagnetic calorimeter. This analysis uses electrons with clusters fully contained in either the barrel or endcap LAr calorimeter. These requirements translate into |ηe| < 2.47 with the
transi-tion region 1.37 < |ηe| < 1.52 excluded. To reject background (essentially originating from
hadrons), multiple requirements on track quality and the electromagnetic shower profile are applied, following the “tight” selection outlined in Ref. [3]. Track quality criteria include a minimum number of hits in the pixel detector, SCT, and TRT, as well as requirements on the transverse impact parameter and a minimum number of TRT hits compatible with the detection of X-rays generated by the transition radiation from electrons. The energy deposition pattern in the calorimeter is characterized by its depth as well as its width in the three compartments of the LAr calorimeter, and the parameters are compared with the ex-pectation for electrons. The position of the reconstructed cluster is required to be consistent with the location at which the extrapolated electron track crosses the most finely-segmented part of the calorimeter. Since electron showers are expected to be well contained within the LAr calorimeter, electron candidates with significant associated energy deposits in the tile calorimeter are discarded. Finally, electron candidates compatible with photon conversions are rejected. Although there is no explicit isolation requirement in the electron
identifica-tion for this analysis, the criteria selecting a narrow shower shape in the calorimeter provide rejection against non-isolated electrons from heavy flavor decays. With these definitions, the average electron selection efficiency ranges from 67% in the endcap (1.52 < |η| < 2.47) to 84% in the central region (|η| < 1.37) for simulated W events.
Muons are reconstructed from tracks in the muon spectrometer joined to tracks in the inner detector. The track parameters of the combined muon are the statistical combination of the parameters of the MS and ID tracks, where the track parameters are weighted using their uncertainties for the combination. Combined muon candidates with |η| < 2.4, corresponding to the coverage of the RPC and TGC detectors used in the trigger, are used in this analysis. To reject backgrounds from meson decays-in-flight and other poorly-reconstructed tracks, the pT measured using the MS only must be greater than 10 GeV, and the pT measured in
the MS and ID must be kinematically consistent with each other: |pMST (energy loss corrected) − p
ID
T | < 0.5 p ID
T . (1)
For both of these requirements, the momentum measured in the muon spectrometer is corrected for the ionization energy lost by the muon as it passes through the calorimeter. There are no explicit requirements on the number of hits associated with the MS track, but the ID track is required to have hits in the pixel detector, the SCT, and the TRT, although if the track is outside of the TRT acceptance that requirement is omitted. Finally, to reject background from muons associated with hadronic activity, particularly those produced by the decay of a hadron containing a bottom or charm quark, the muon is required to be isolated. The isolation is defined as the scalar sum of the pT of the ID tracks immediately
surrounding the muon candidate track (∆R < 0.4). The isolation threshold scales with the muon candidate pT and isP pIDT < 0.2 p
µ
T. The combined muon reconstruction and selection
efficiency varies from 90% to 87% as the muon pT increases from 20 GeV to above 80 GeV.
The transverse momentum of the neutrino produced by the W decay can be approxi-mately reconstructed via the transverse momentum imbalance measured in the detector, also known as the missing transverse energy (Emiss
T ). The ETmiss calculation begins from
the negative of the vector sum over the whole detector of the momenta of clusters in the calorimeter. The magnitude and position of the energy deposition determines the momen-tum of the cluster. The cluster energy is initially measured at the electromagnetic scale, under the assumption that the only energy deposition mechanism is electromagnetic showers
such as those produced by electrons and photons. The cluster energies are then corrected for the different response of the calorimeter to hadrons relative to electrons and photons, for losses due to dead material, and for energy which is not captured by the clustering pro-cess. The Emiss
T used in the electron channel is exactly this calorimeter-based calculation. In
the muon channel, the Emiss
T is additionally corrected for the fact that muons, as minimum
ionizing particles, typically only lose a fraction of their momentum in the calorimeter. For isolated muons, the Emiss
T is corrected by adding the muon momentum as measured with the
combined ID and MS track to the calorimeter sum, with the calorimeter clusters associated with the energy deposition of the muon subtracted to avoid double-counting. In this context, muons are considered isolated if the ∆R to the nearest jet with ET > 7 GeV is greater than
0.3. Jets are reconstructed using the anti-kt algorithm [51] and the ET is measured at the
electromagnetic scale. For non-isolated muons, the muon momentum is measured using only the muon spectrometer. In this case, the momentum loss in the calorimeter is kept within the calorimeter sum. To summarize, the ETmiss is calculated via the formula
Ex,ymiss = −X i Ei x,y − isolated X j pj x,y − non−isolated X k pk x,y . (2)
In the above, the Ei
x,y are the individual topological cluster momentum components,
exclud-ing those clusters associated with any isolated muon, the pj
x,y are the momenta of isolated
muons as measured with the combined track, and the pk
x,y are the momenta of non-isolated
muon as measured in the muon spectrometer. In practice, for the electron channel, only the first term contributes, but for the muon channel all three terms contribute.
B. Event Selection
Candidate W events are selected from the set of events passing a single electron or a single muon trigger. Offline, events are first subject to cleaning requirements aimed at rejecting events with background from cosmic rays or detector noise. These requirements reject a small fraction of the data and are highly efficient for the W signal [3]. Events must have a reconstructed primary vertex with at least three tracks with pT > 150 MeV.
They are rejected if they contain a jet with features characteristic of a known non-collision localized source of apparent energy deposition, such as electronic noise in the calorimeter. Such spurious jets can result in events with large Emiss
or even necessarily originate from a pp collision. In the electron channel, events are rejected if the electron candidate is reconstructed in a region of the calorimeter suffering readout problems during the 2010 run [52]. This last requirement results in a ∼ 5% efficiency loss.
After the event cleaning, we select events with at least one electron or muon, as defined above, with transverse momentum greater than 20 GeV. In events with more than one such lepton, the lepton with largest transverse momentum is assumed to originate from the W decay. To provide additional rejection of cosmic rays, muon candidates must point at the primary vertex, in the sense that the offset in z along the beam direction between the primary vertex and the point where the candidate muon track crosses the beam line must be less than 10 mm.
Finally, we require Emiss
T > 25 GeV and transverse mass greater than 40 GeV to ensure
consistency of the candidate sample with the expected kinematics of W decay.
After all selections, 112 909 W → eν candidates and 129 218 W → µν candidates remain in the data. The smaller number of candidate events in the electron channel is mostly due the lower electron reconstruction and identification efficiency.
C. Hadronic Recoil Calculation
The reconstruction of the W boson transverse momentum is based on a slight modification of the Emiss
T calculation described above. Formally, the ~pT of the W boson is reconstructed
as the vector sum of the ~pT of the neutrino and the charged lepton, ~pWT = ~pℓT + ~pνT. But
the neutrino pT is reconstructed through the ETmiss, and the ETmiss is determined in part
from the lepton momentum, explicitly in the case of W → µν events, and implicitly in
W → eν events through the sum over calorimeter clusters. Therefore when the ~pT of
the charged lepton and Emiss
T are summed, the charged lepton momentum cancels out and
the W transverse momentum is measured as the summed ~pT of the calorimeter clusters,
excluding those associated with the electron or muon. This part, which consists of the energy deposition of jets and softer particles not clustered into jets, is referred to as the hadronic recoil ~R. The reconstructed pW
T is denoted pRT and is defined as the magnitude of
~ R.
In this measurement, the exclusion of the lepton from pR
T is made explicit by removing all
lepton flavor dependence in the reconstruction of pR
T, so that it is possible to construct a
combined response matrix describing the mapping from pW T to p
R
T which can be applied to
both channels. To compensate for the energy from additional low-pT particles removed along
with the lepton, the underlying event is sampled on an event-by-event basis using a cone of the same size, placed at the same η as the lepton. The cone azimuth is randomly chosen but required to be away from the lepton and original recoil directions, to ensure that the compensating energy is not affected significantly by these components of the event. The distance in azimuth to the lepton is required to satisfy ∆φ > 2 × ∆R, and the distance to the recoil should match ∆φ > π/3. The transverse momentum measured from calorimeter clusters in this cone is rotated to the position of the removed lepton and added to the original recoil estimate. Because this procedure is repeated for every event, the energy in the clusters in the replacement cone contains an amount of energy from the underlying event and from multiple proton-proton collisions (“pile-up”) which is correct on average for each event and accounts for event-by-event fluctuations.
VI. BACKGROUND ESTIMATION
Backgrounds to W → eν and W → µν events come from other types of electroweak events (Z → ℓℓ and W → τν), t¯t and single top events, and from multijet events in which a non-prompt lepton is either produced through the decay of a hadron containing a heavy quark (b or c), the decay-in-flight of a light meson to a muon, or through a coincidence of hadronic signatures that mimics the characteristics of a lepton. Figure 1 shows the expected and observed pR
T distribution in the electron and muon channels, with background contributions
calculated as described below.
Electroweak backgrounds (W → τν, Z → ℓℓ, Z → ττ) and top quark production (t¯t and single top) are estimated using the acceptance and efficiency calculated from simulated data, corrected for the imperfect detector simulation and normalized using the predicted cross sections as described in Section IV. These backgrounds amount to about 6% of the selected events in the electron channel, and to about 10% in the muon channel. The background in the muon channel is larger because the smaller geometrical acceptance of the muon spectrometer compared to the calorimeter leads to a greater contribution of Z → µµ events compared to Z → ee events. Uncertainties on the summed electroweak and top background rates are 6%
at low pR
T in both channels, rising to 14% above pRT ∼ 200 GeV in the muon channel, and 25%
in the electron channel. The leading uncertainties on these backgrounds at low pR
T are from
the theoretical model, since the cross sections used to normalize them have uncertainties ranging from 4% (for W and Z) to 6% (for t¯t), and from the PDF uncertainty on the acceptances, which is 3% [3]. The integrated luminosity calibration contributes an additional 3.4% [36, 37]. Important experimental uncertainties include the energy (momentum) scale uncertainty, which contributes about 3% (1%) at low pR
T in the electron (muon) channel,
increasing to about 6% (5%) at high pR
T. At high pRT (pRT & 150 GeV), there are also
significant contributions for both channels from the statistical uncertainty on the acceptance and efficiency calculated from simulated events.
The multijet backgrounds are determined using data-driven methods. In the electron channel, the observed Emiss
T distribution is interpreted in terms of signal and background
contributions, using a method based on template fitting. A first template is built from the signal as well as electroweak and top backgrounds, using simulated events. The multijet background template is built from a background-enriched sample, obtained by applying all event selection cuts apart from inverting a subset of the electron identification criteria. The multijet background fraction is then determined by a fitting procedure that adjusts the normalization of the templates to obtain the best match to the observed Emiss
T distribution.
This method has been described in Ref. [3], and is applied here bin by bin in pR
T. The multijet
background fraction is 4% at low pR
T, and rises to ∼ 9% at high pRT. Uncertainties on this
method are estimated from the stability of the fit result under different event selections used to produce the multijet background templates, by propagating the lepton efficiency and momentum scale uncertainties to the signal templates, and by varying the range of the Emiss
T distribution used for the fit. These sources amount to a total relative uncertainty of
25% at low pR
T, decrease to 5% at pRT ∼ 35 GeV, and progressively rise again to 100% at
high pR
T, where very few events are available to construct the templates.
In the muon channel, the multijet background is primarily from semi-leptonic heavy quark decays, although there is also a small component from kaon or pion decays-in-flight. The estimation of this background component relies on the different efficiencies of the isolation requirement for multijet and electroweak events, and is based on the method described in Ref. [3]. Muons from electroweak boson decays, including those from top quark decays, are mostly isolated, and their isolation efficiency is measured from Z → µµ events. The
efficiency of the isolation requirement on multijet events is measured using a background-enriched control sample, which consists of events satisfying all of the signal event selection except that the muon transverse momentum range is restricted to 15 < pµT < 20 GeV and the Emiss
T and mT requirements are dropped. The measured efficiency is extrapolated to
the signal region (pµT > 20 GeV, Emiss
T > 25 GeV, and mT > 40 GeV) using simulated
multijet events. Knowledge of the isolation efficiency for both components, combined with the number of events in the W → µν candidate sample before and after the isolation requirement, allows the extraction of the multijet background. As for the electron channel, this method is applied for each bin in pR
T, with the number of total and isolated candidates,
as well as the signal and background efficiencies, calculated separately for each bin. The isolation efficiency for the background is fitted with an exponential distribution to smooth out statistical fluctuations arising from the limited number of events passing all of the event selection in the simulated multijet data.
The multijet background fraction in the muon channel is found to be 1.5% at low pR T
and decreases to become negligible for pR
T > 100 GeV. Uncertainties on the estimated
mul-tijet background include all statistical uncertainties, including those on both the signal and background isolation efficiency measurements. The full range of the simulation-based ex-trapolation of the isolation efficiency for the multijet background is taken as a systematic uncertainty. Subtraction of residual electroweak events in the control samples is also included in the systematic uncertainty but is a sub-dominant contribution. The relative uncertainty on the background rate varies between 25% and 80%, with the largest uncertainties for pR
T < 40 GeV.
VII. UNFOLDING OF THE pR
T DISTRIBUTION
The unfolding of the pR
T distribution to the pWT distribution is performed in two steps. In
the first step, the background-subtracted pR
T distribution is unfolded to the true pWT
distri-bution, using the response matrix to model the migration of events among bins caused by the finite resolution of the detector. The result of this step is the distribution of dN/dpW
T of
all reconstructed W events. In the second step, this distribution is divided by a reconstruc-tion efficiency correcreconstruc-tion relating the number of reconstructed W events to the number of generated fiducial W events within each bin. That correction results in the differential cross
[GeV] R T p 0 50 100 150 200 250 300 Events / GeV -1 10 1 10 2 10 3 10 4 10 Data 2010 ν µ → W µ µ → Z ν τ → W Jets top τ τ → Z ATLAS -1 30 pb ≈ Ldt
∫
= 7 TeV s (a) [GeV] R T p 0 50 100 150 200 250 300 Events / GeV -1 10 1 10 2 10 3 10 4 10 Data 2010 ν e → W ee → Z ν τ → W Jets top τ τ → Z ATLAS -1 31 pb ≈ Ldt∫
= 7 TeV s (b)FIG. 1. Observed and predicted pR
T distributions in the electron channel (a) and in the muon channel (b).
section dσfid/dpWT .
A. Unfolding of the Recoil Distribution
The response matrix describes the relation between pW
T and pRT, the true and reconstructed
W pT, respectively. It reflects the physics of the process (hadronic activity from soft and
hard QCD interactions) as well as the response of the calorimeters to low energy particles. This is in principle captured by a response matrix drawn from simulated W → ℓν events, but the simulation of both aspects carries significant uncertainty. Therefore, the treatment of the response matrix includes corrections from Z data to improve the model.
The Z → ee and Z → µµ data are used as a model for the hadronic recoil response in W events because the underlying physics is similar but there are two independent ways to measure the pT of the Z, through the hadronic recoil or the pT of the charged leptons. The
lepton energy resolution is sufficiently good that the dilepton pT can be used to calibrate
the hadronic recoil, with the dilepton pT standing in for the true pT and the hadronic recoil
remaining the “measured” quantity. One could construct a response matrix purely from Z → ℓℓ events, but such a matrix would be limited by the relatively small number of Z → ℓℓ events in the 2010 data and residual differences between W and Z kinematics and
production mechanisms. To incorporate the best features of both the W simulation and Z data models, we introduce a parametrization of the hadronic recoil scale and resolution. Fits to the real and simulated Z data using this parametrization are used to correct the simulated W response, and the resulting corrected parametrization is used to fill the response matrix used for the unfolding.
Following this logic, the response matrix is built in three steps. A first version of the response matrix, denoted MMC, is directly filled from simulated W → ℓν signal events as
the two-dimensional distribution of pR
T and pWT . The parametrized response matrix Mparam
is also based solely on simulated W → ℓν events but is constructed from a fit to the recoil as described below. The final corrected parametrized response matrix Mcorr
param uses the same
functional form as Mparam, but with the fit parameters corrected using the response measured
in Z → ℓℓ data. Only Mcorr
param is used in the central value of the measurement, but MMC
and Mparam are used in assessing systematic uncertainties, particularly those arising from
the response matrix parametrization and the unfolding procedure.
To facilitate the incorporation of corrections from the Z data, we introduce an analyt-ical representation of the detector response to pW
T , and approximate MMC via a smearing
procedure. Decomposing ~R into its components parallel and perpendicular to the W line of flight, Rk and R⊥, the response is observed to behave as a Gaussian distribution with
parameters governed by pW
T and ΣET, where ΣET is the scalar sum of the transverse energy
of all calorimeter clusters in the event. By choosing the coordinate system to align with the W line of flight, any scale offset (“bias”) is in the Rk direction by construction, and
the Gaussian resolution function is centered at zero in the R⊥ direction. Specifically, the
approximated response Mparam is obtained from the Monte Carlo signal sample as follows:
Rk(pWT , ΣET) = pWT + G[ b(p W
T ), σk(pWT , ΣET) ], (3)
R⊥(pWT , ΣET) = G[ 0, σ⊥(pWT , ΣET) ]. (4)
where G denotes a Gaussian random number, and its parameters b, σk and σ⊥ are the
Gaussian mean and resolution parameters determined from fits to the simulation. The bias is described according to b(pW
T ) = b0+b1ppWT , independently of ΣET. The resolutions follow
σk(pWT , ΣET) = σk,0(pWT ) + σk,1(pWT ) ×
√
ΣET and σ⊥(pWT , ΣET) = σ⊥,0(pWT ) + σ⊥,1(pWT ) ×
√
ΣET, where the pWT dependence indicates that the fit is performed separately in three
regions of pW
fit into regions of pW
T improves the quality of the fit.
With the parametrization defined, it is possible to build up a response matrix from a set of events using a smearing procedure. Given the pW
T and ΣET of each event, Rk and
R⊥ can be constructed using random numbers distributed according to Equations 3 and 4.
Then pR
T is reconstructed from Rk and R⊥, and the results are used to fill the relationship
between pW
T and pRT. Applying this procedure to the simulated signal sample results in the
approximate response matrix Mparam.
Corrections to this parametrization are derived from Z → ℓℓ events by applying the same procedure to both real and simulated Z events and using the measured decay lepton pair momentum pℓℓ
T as the estimator of the true Z boson transverse momentum. The hadronic
recoil calculated as described in Section V C has no dependence on the lepton flavor, and consistent response is observed in Z → ee and Z → µµ events. Therefore we fit the combined data from both channels to minimize the statistical uncertainty. The corrected smearing parameters are defined as follows:
bW,corr = bW,MC+ (bℓℓ,data− bℓℓ,MC), (5) σkW,corr = σkW,MC+ (σkℓℓ,data− σkℓℓ,MC), and (6) σ⊥W,corr = σ⊥W,MC+ (σ⊥ℓℓ,data− σ⊥ℓℓ,MC). (7) Above, bℓℓ,data and bℓℓ,MC are determined as a function of pℓℓ
T, and then used as a function
of pW
T ; bW,corr and bW,MC are functions of pWT throughout. All resolution parameters are
functions of the reconstruction-level ΣET. This defines the final, corrected response matrix
Mcorr
param used in the hadronic recoil unfolding.
The parametrization of the bias and resolution parameters in W and Z simulation are illustrated in Figures 2(a)-4(a). For these, the bias and resolution are defined with respect to the true (propagator) W and Z momenta. The simulated and data-driven bias and resolution parameters in Z events are displayed in Figs. 2(b)-4(b). For these, the bias and resolution are defined with respect to the reconstructed dilepton pT. In Figs. 2(a) and 2(b),
the bias parametrization is shown only over the range which determines the fit parameters, but the parametrization describes the data well up to pW
T =300 GeV.
The response matrix is constructed using the following bin edges, expressed in GeV: • Reconstruction-level distribution: 0, 4, 8, 15, 23, 30, 38, 46, 55, 65, 75, 85, 95, 107,
[GeV] W,Z T p 0 10 20 30 40 50 60 70 80 b [GeV] -9 -8 -7 -6 -5 -4 -3 -2 -1 0 = 7 TeV s ATLAS Simulation (simulation) ll → Z Z b (simulation) ν l → W W b (a) ) [GeV] -l + (l T p 0 10 20 30 40 50 60 70 80 b [GeV] -9 -8 -7 -6 -5 -4 -3 -2 -1 0 = 7 TeV s ATLAS -1 31 pb ≈ Ldt
∫
(data) µ µ ee, → Z ,Data ll b ,MC ll b (b)FIG. 2. (a) Parametrization of the recoil bias as a function of the vector boson transverse momen-tum, b(pW,ZT ), in W simulation (open squares, solid line) and Z simulation (solid circles, dashed line). (b) Parametrization of the recoil bias as a function of the reconstructed lepton pair trans-verse momentum, b(pℓℓ
T), in Z simulation (dashed line) and data (solid squares, shaded band). The shaded band shows the uncertainty on the fit.
• Unfolded distribution: 0, 8, 23, 38, 55, 75, 95, 120, 145, 175, 210, 300.
The reconstruction-level binning enables more detailed comparisons between data and sim-ulation before unfolding, and allows a more precise background subtraction as a function of pR
T. It has been used in Figure 1. The bin edges at the unfolded level provide a purity of
at least 65% across the pW
T spectrum, which is large enough to ensure the stability of the
unfolding procedure. The bins are still small enough to keep the model dependence of the result, which enters through the assumption of a particular pW
T shape within each bin, to
a sub-leading contribution to the overall uncertainty (see the description of the systematic uncertainties in Section VIII). The purity is defined as the fraction of events where the event falls in the same bin when the bin edges are defined using pR
T as it does when the bin edges
are defined using pW T .
The unfolding of the hadronic recoil is performed by means of the iterative Bayesian algorithm [53], where the pW
T distribution predicted by the simulation is used as first
as-sumption of the true pW
[GeV] T E Σ 50 100 150 200 250 300 350 400 450 [GeV]|| σ 2 3 4 5 6 7 8 9 10 11 12 = 7 TeV s ATLAS Simulation (simulation) ll → Z Z σ (simulation) ν l → W W σ (a) [GeV] T E Σ 50 100 150 200 250 300 350 400 450 [GeV]|| σ 2 3 4 5 6 7 8 9 10 11 12 = 7 TeV s ATLAS -1 31 pb ≈ Ldt
∫
(data) µ µ ee, → Z ,Data ll σ ,MC ll σ (b)FIG. 3. (a) Parametrization of the recoil resolution σk(ΣET) in W simulation (open squares, solid line) and Z simulation (solid circles, dashed line). (b) Parametrization of the recoil resolution σk(ΣET) in Z simulation (dashed line) and data (solid squares, shaded band). The shaded band shows the uncertainty on the fit.
[GeV] T E Σ 50 100 150 200 250 300 350 400 450 [GeV] σ 2 3 4 5 6 7 8 9 10 11 12 ATLAS Simulation = 7 TeV s (simulation) ll → Z Z σ (simulation) ν l → W W σ (a) [GeV] T E Σ 50 100 150 200 250 300 350 400 450 [GeV] σ 2 3 4 5 6 7 8 9 10 11 12 = 7 TeV s ATLAS -1 31 pb ≈ Ldt
∫
(data) µ µ ee, → Z ,Data ll σ ,MC ll σ (b)FIG. 4. (a) Parametrization of the recoil resolution σ⊥(ΣET) in W simulation (open squares, solid line) and Z simulation (solid circles, dashed line). (b) Parametrization of the recoil resolution σ⊥(ΣET) in Z simulation (dashed line) and data (solid squares, shaded band). The shaded band shows the uncertainty on the fit.
This procedure converges after three iterations.
The statistical uncertainty on the unfolded spectrum is obtained by generating random replicas of the reconstruction-level data. First, the pR
T distribution from simulation is scaled
to have an integral equal to the number of events observed in data. For each trial, the number of events in each bin is fluctuated according to a Poisson distribution with a mean set by the original bin content. The unfolding procedure is used on the fluctuated distribution, and the pW
T distribution from the same set of simulated events is subtracted from the result.
The resulting ensemble of offsets is used to fill a covariance matrix describing the impact of statistical fluctuations on the result, including correlations between the bins introduced by the unfolding procedure.
Systematic uncertainties receive contributions from the quality of the response parametriza-tion approximaparametriza-tion, i.e. from the difference between MMC and Mparam; from the statistical
precision of the data driven corrections defining Mcorr
param; and from the unfolding procedure
itself. Their estimation is described in Section VIII.
B. Efficiency Correction
The W → ℓν candidate event reconstruction efficiency is subsequently unfolded by divid-ing the number of events in each bin of pW
T by the detection efficiency correction factor for
that bin. The correction factor accounts for trigger and detection efficiencies, as well as the migration of events in and out of the acceptance due to charged lepton and Emiss
T resolution
effects. It is defined as the ratio of the number of reconstructed events passing all selection in each bin to the number of events produced within the fiducial volume in that same bin. Note that any migration between bins has already been accounted for by the hadronic recoil response unfolding. The efficiency correction is based on the ratio calculated from simulated W events, and corrected for observed differences between simulated and real data in the trigger and reconstruction efficiencies as well as in the lepton momentum and resolution (see Section IV). The corrections for discrepancies between data and simulation are applied as a function of the reconstructed lepton kinematics in each bin of pW
T . The fiducial volume in the
denominator is defined by the truth-level kinematic requirements pℓ
T > 20 GeV, |ηℓ| < 2.4,
pν
T > 25 GeV, and mT > 40 GeV. For the default, propagator-level pWT measurement, the
final state QED radiation. For the “dressed” lepton version of the measurement, the charged lepton momentum is the sum of its momentum after all QED FSR and the momenta of all photons radiated within a cone of ∆R = 0.2 around the lepton. The cone size is chosen to match the cone size used for the lepton removal in the definition of ~R. The “bare” lepton version uses only the charged lepton momentum after all QED FSR.
In the electron channel, the efficiency rises from ∼ 60% at low pW
T to ∼ 80% at pWT ∼
100 GeV, and falls towards ∼ 70% at the upper end of the spectrum. In the muon channel, the efficiency rises from ∼ 80% to ∼ 90%, then falls to ∼ 80% in the same pW
T ranges.
The efficiency correction carries systematic uncertainties induced by the imperfect mod-eling of the lepton trigger and reconstruction efficiencies, by the acceptance of the Emiss
T cut,
and by the finite statistics and physics assumptions of the signal simulation sample. Their estimation is described in Section VIII.
VIII. SYSTEMATIC UNCERTAINTIES
Systematic uncertainties arise from the background subtraction procedure, from the recoil response model and unfolding procedure, and from lepton reconstruction and calibration uncertainties. Theoretical uncertainties also enter, to a lesser extent. Different strategies are used for the various uncertainties according to the nature of the uncertainty and whether it is introduced before, during, or after the hadronic recoil unfolding. Accordingly, the uncertainties are evaluated by using an ensemble of inputs with the nominal response matrix, an ensemble of response matrices with the nominal input, or by simple error propagation, respectively. The uncertainties on this measurement are represented as covariance matrices, so that correlations between the bins can be included.
A. Background Subtraction Uncertainties
The systematic uncertainties associated to the background subtraction are estimated by generating an ensemble of pseudo-experiments in which the background estimates have been fluctuated within their uncertainties. The full analysis chain is repeated for each pseudo-experiment and the spread of the unfolded results defines the associated uncertainty. Electroweak, top, and QCD multijet contributions are treated separately, except that the
luminosity uncertainty is treated as correlated between the electroweak and top backgrounds. Background subtraction is performed before the unfolding, and the unfolding redistributes the background among the pW
T bins, so the covariance matrices representing the uncertainties
on the backgrounds have nonzero off-diagonal elements.
The electroweak and top backgrounds contribute 0.6% (0.4%) to the measurement un-certainty at low pW
T in the electron (muon) channel, and up to 4% at high pWT in both
channels. The multijet background in the electron channel contributes ∼ 0.5% uncertainty for pW
T < 50 GeV, which gradually rises to 4% at pWT ∼ 200 GeV, eventually contributing
15% in the highest pW
T bin. In the muon channel, the multijet background induced
un-certainty has a maximum of 2% at pW
T ∼ 30 GeV, which corresponds to the peak of the
background rate, and contributes ∼ 0.6% on average in the rest of the spectrum.
B. Hadronic Recoil Unfolding Uncertainties
Systematic uncertainties associated to the response matrix are classified in two categories. In the first category, the impact of a given source of uncertainty is estimated by comparing the unfolded distribution obtained with the nominal response matrix, to the result obtained with a response matrix reflecting the variation of this source. The statistical component of the difference is assessed by varying a given input of the response matrix construction to generate a set of related variations of the response matrices. Repeating the analysis with these leads to a set of varied unfolded results, and the induced bias is averaged in each bin of the pW
T distribution. The associated systematic uncertainty is defined from the spread
of the distribution of the results, and is taken as a constant percentage across all pW T bins,
represented as a diagonal covariance matrix.
By comparing results obtained from the initial Monte Carlo response matrix MMC with
results obtained from the parametrized response matrix Mparam, the response
parametriza-tion is found to induce an uncertainty of 2.4% in the electron channel and 2.0% in the muon channel. The input generator bias is estimated by reweighting the true pW
T
distribu-tion given by the Pythia sample to the Resbos predicdistribu-tion, generating the corresponding response matrix and comparing the result to the nominal result, leading to a systematic uncertainty of 1.2% in the electron channel, and 0.9% in the muon channel. Note that the starting assumption for the Bayesian unfolding is simultaneously modified in the same way,
so that this uncertainty includes both the effect of modifying the distribution underlying the response matrix and the assumption of a prior for the unfolding. In addition, it was verified that reweighting the input pW
T assumption according to the actual measurement result and
repeating the procedure does not affect the result beyond the uncertainties quoted above. Lepton momentum scale uncertainties also enter through the Z-based recoil response correc-tions, because pℓℓ
T is used in place of the true pZT, but this amounts to less than 0.2% in both
channels. As described above, these numbers are taken constant across the pW
T spectrum.
The second category deals with the uncertainties associated to the data-driven corrections to the response parametrization. In this case, we generate an ensemble of random correction parameters by sampling from the distribution defined by the statistical uncertainties on the central value of the parameters returned by the fit. For each parameter set the correspond-ing response matrix is generated. The treatment is then the same as for the background uncertainties: the analysis chain is repeated for each configuration, and the spread of the unfolded bin contents defines the associated uncertainty in each bin.
In this category, the data driven correction to the recoil bias and resolution induces an uncertainty of ∼ 1.6% for pW
T < 8 GeV, has a local maximum of ∼ 2.6% at pWT = 30 GeV,
and contributes less than 1% in the remaining part of the spectrum. The uncertainty related to the ΣET rescaling is 0.2% at low pWT , rising to 1% at the high end of the spectrum. These
numbers are valid for both channels, as the data driven corrections are determined from combined Z → ee and Z → µµ samples, as described in Section VII A.
Finally, the bias from the unfolding itself is found by folding the pW
T distribution of
simulated W → ℓν events passing the reconstruction-level selection using MMC and then
unfolding it using the same response matrix. The original pW
T distribution is subtracted from
the unfolded one, and the size of the bias relative to the original distribution is taken as the systematic uncertainty from the unfolding procedure. The folded distribution is used for pR
T instead of the found pRT distribution to avoid double-counting the statistical uncertainty.
The resulting uncertainty is less than 0.5% in all bins, except for the highest-pW
T bin in the
C. Efficiency Correction Uncertainties
In the electron channel, the main contributions to the acceptance correction uncertainty are the reconstruction and identification efficiency uncertainty, and the electron energy scale and resolution uncertainties. The identification efficiency contributes 3% to the measurement uncertainty across the pW
T spectrum. The scale and resolution uncertainties contribute 0.5%
at low pW
T , rising to 10% at pWT ∼ 100 GeV, and decreasing to 6% at the high end of the
spectrum.
In the muon channel, the trigger efficiency uncertainty contributes 1% across the spec-trum. The reconstruction efficiency contributes 0.7% at low pW
T , linearly rising to 2% at
pW
T ∼ 300 GeV. The scale and resolution uncertainties contribute 0.5% at low pWT , rising to
2% at pW
T ∼ 120 GeV, and decreasing to 1% towards pWT ∼ 300 GeV.
The uncertainty associated to the recoil component of Emiss
T (the first term of Eq. 2,
mi-nus any clusters associated with an electron) is estimated as above, by generating random ensembles of resolution correction parameters within the precision of the Z-based calibra-tion. For each parameter set in the ensemble, the Emiss
T distribution is re-generated and the
corresponding efficiency correction is re-calculated. The width of the resulting distribution of efficiency corrections is taken as the uncertainty. This source contributes less than 0.3% across the pW
T spectrum in both channels.
In both channels, the Monte Carlo statistical precision is 0.5% at low pW
T and rises to
4% towards pW
T ∼ 300 GeV. The generator dependence of the efficiency is estimated by
comparing the central values found for Pythia and Mc@nlo, and found to be smaller than 0.2%, apart from the last bin where it reaches 1%. Finally, following Ref. [2], the PDF induced uncertainty on the efficiency correction is at the level of 0.1% and neglected in this analysis.
IX. RESULTS
A. Electron and Muon Channel Results
The efficiency-corrected distributions resulting from the two unfolding steps are normal-ized to unity, and the bin contents are divided by the bin width. In the normalization step, uncertainties that are completely correlated across all of the bins, such as the uncertainty
[pb/GeV] W T / dp fid σ d -2 10 -1 10 1 10 2 10 ν e → W ν µ → W -1 31 pb ≈ Ldt
∫
= 7 TeV s Data 2010, ATLAS [GeV] W T p 0 50 100 150 200 250 300 νµ → / W ν e → W 0.4 0.6 0.8 1 1.2 1.4 1.6FIG. 5. Electron and muon fiducial differential cross sections as a function of pW
T . The error bars include all statistical and systematic uncertainties except the 3.4% uncertainty on the integrated luminosity, which is common to the two measurements and cancels in the ratio.
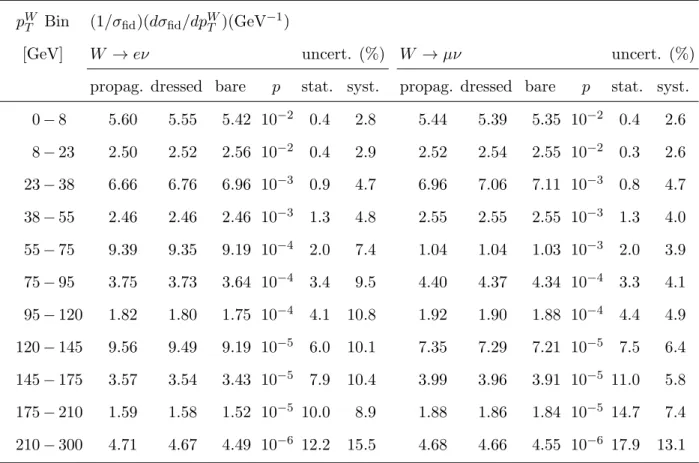
on the integrated luminosity, cancel. The resulting normalized differential fiducial cross section, (1/σfid)(dσfid/dpWT ) is given in Table I for both the electron and muon channels,
together with the statistical and systematic uncertainties. The differential cross section is calculated with respect to three definitions of pW
T and the fiducial volume, corresponding to
different definitions of the true lepton kinematics: the first uses the Born level kinematics, the second uses the “dressed” lepton kinematics calculated from the sum of the post-FSR lepton momentum and the momenta of all photons radiated within a cone of ∆R = 0.2, and the third (“bare”) uses the lepton kinematics after all QED radiation.
Instead of normalizing the efficiency-corrected distributions to unit integral, they can also be divided by the integrated luminosity of the corresponding data to yield the differential fiducial cross section dσfid/dpWT . The resulting differential fiducial cross sections, with the
fiducial volume defined by the Born-level kinematics, are shown in Fig. 5. Error bars include both statistical and systematic uncertainties, but not the uncertainty on the integrated luminosity, which is common to both measurements.
TABLE I. The normalized, differential cross section (1/σfid)(dσfid/dpWT ), measured in W → eν and W → µν events, for different definitions of pW
T . The Born-level definition (“propag.”), the analysis baseline, ignores the leptons and takes the W momentum from the propagator. The “dressed” and “bare” definitions of pW
T are calculated using the momenta of the leptons from the W decay. In the “dressed” case, the charged lepton momentum includes the momenta of photons radiated within a cone of ∆R = 0.2 centered around the lepton. In the “bare” case, the charged lepton momentum after all QED radiation is used. The factor p is the power of ten to be multiplied by each of the three cross section numbers for each channel. It has been factorized out for legibility.
pW
T Bin (1/σfid)(dσfid/dpWT )(GeV−1)
[GeV] W → eν uncert. (%) W → µν uncert. (%)
propag. dressed bare p stat. syst. propag. dressed bare p stat. syst. 0 − 8 5.60 5.55 5.42 10−2 0.4 2.8 5.44 5.39 5.35 10−2 0.4 2.6 8 − 23 2.50 2.52 2.56 10−2 0.4 2.9 2.52 2.54 2.55 10−2 0.3 2.6 23 − 38 6.66 6.76 6.96 10−3 0.9 4.7 6.96 7.06 7.11 10−3 0.8 4.7 38 − 55 2.46 2.46 2.46 10−3 1.3 4.8 2.55 2.55 2.55 10−3 1.3 4.0 55 − 75 9.39 9.35 9.19 10−4 2.0 7.4 1.04 1.04 1.03 10−3 2.0 3.9 75 − 95 3.75 3.73 3.64 10−4 3.4 9.5 4.40 4.37 4.34 10−4 3.3 4.1 95 − 120 1.82 1.80 1.75 10−4 4.1 10.8 1.92 1.90 1.88 10−4 4.4 4.9 120 − 145 9.56 9.49 9.19 10−5 6.0 10.1 7.35 7.29 7.21 10−5 7.5 6.4 145 − 175 3.57 3.54 3.43 10−5 7.9 10.4 3.99 3.96 3.91 10−5 11.0 5.8 175 − 210 1.59 1.58 1.52 10−5 10.0 8.9 1.88 1.86 1.84 10−5 14.7 7.4 210 − 300 4.71 4.67 4.49 10−6 12.2 15.5 4.68 4.66 4.55 10−6 17.9 13.1 B. Combination Procedure
After correcting the electron and muon pW
T distributions to the common fiducial volume
using the efficiency corrections described in Section VII, we combine the resulting differen-tial fiducial cross sections dσfid/dpWT by χ2 minimization. The combination is based on the
distributions with pW
T defined by the W propagator momentum because QED final state
radiation causes differences between the electron and muon momenta that makes a consis-tent combination based on other definitions unfeasible. To build the χ2, the uncertainties
on the two measurements are sorted according to whether they are correlated between the two channels or not, and a joint covariance matrix describing the uncertainty on both mea-surements is constructed. Using this covariance matrix, we define a χ2 between the two
measurements and a common underlying distribution. This χ2 is minimized to find the
combined measurement, which is the best estimate of the common underlying distribution. Specifically, the χ2 to be minimized is defined as:
χ2 = (X −X¯)TC−1(X −X¯) , (8)
where X is the vector of 2N elements containing the two N-bin distributions to be com-bined, concatenated: X = {Xe
1, ..., Xne; X µ
1, ..., Xnµ}. The vector X¯ = { ¯X1, ..., ¯Xn; ¯X1, ..., ¯Xn}
contains two copies of the combined measurement { ¯Xi}. The joint covariance matrix C is
described in the next paragraph. The χ2 minimization is performed analytically, following
the prescription in Ref. [54], yielding the { ¯Xi}.
The joint covariance matrix C has 2N × 2N elements and is constructed from four sub-matrices: C= Ce Ceµ Ceµ Cµ . (9)
The N × N covariance matrices Ce and Cµ are the covariance matrices for the electron and
muon measurements, respectively, and contain all sources of uncertainty on the measure-ments. The off-diagonal blocks Ceµ are identical and reflect the sources of uncertainty that
are correlated between the channels.
The 2N × 2N covariance matrix is constructed from the two N × N matrices for each source of uncertainty individually, and the resulting set of 2N ×2N matrices is summed. For sources of uncertainty uncorrelated between the channels, the 2N × 2N covariance matrix is constructed by copying the N × N matrices to the corresponding diagonal blocks Ce and
Cµ. For uncertainties that are correlated between the channels, the diagonal blocks are still
filled by copying the covariance matrices from the individual channels. The off-diagonal blocks are filled using the assumption that the channels are 100% correlated, so that the correlations between bins are identical for both channels. That determines the correlation matrix, which sets the magnitudes of the covariance matrix entries relative to the magnitude of the diagonal entries. The diagonal entries, which are the squares on the uncertainties on each bin, are taken as the geometrical average of the values for the two channels.
The statistical uncertainties on the unfolded measurements are uncorrelated because the W → eν and W → µν candidate data samples are statistically independent. The system-atic uncertainties induced by the subtraction of the estimated background are uncorrelated between the channels, except for the uncertainties on the luminosity and predicted cross sections used to normalize the electroweak and top quark backgrounds. Because the same hadronic recoil response matrix is used for both channels, the uncertainties associated with it are fully correlated between the channels, except for the small contribution from the lep-ton momentum resolution. The efficiency corrections for each channel are independent, so the associated uncertainties are uncorrelated between the channels.
C. Combined Results and Comparison with Predictions
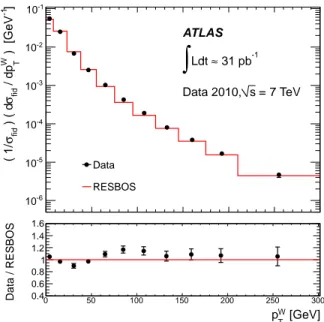
The χ2minimization yields a χ2/d.o.f. of 13.0/13, demonstrating good agreement between
the electron and muon results. The combined differential cross section, normalized to unity, is shown compared to the prediction from Resbos in Fig. 6. The Resbos prediction, which combines resummed and fixed order pQCD calculations, is based on the CTEQ6.6 PDF set [39] and a renormalization and factorization scale of mW. Resbos performs the
fixed-order calculation at NLO (O(αs)), and corrects the prediction to NNLO (O(αs2)) using a
k-factor calculated as a function of the boson mass, rapidity, and pT [13–15]. Table II gives
the same information numerically, including the separate contribution of different classes of uncertainty.
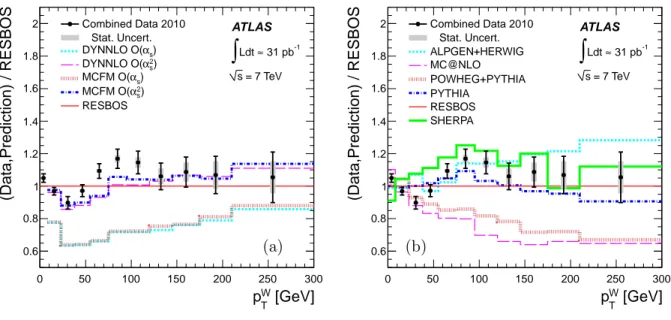
In Figure 7, the combined result (1/σfid)(dσfid/dpWT ) is compared to a selection of
predic-tions from both pQCD and event generators. The DYNNLO predicpredic-tions are from version 1.1 of the program [9, 10]. The prediction from the MCFM program is produced as a calculation of dσfid/dpWT for W + 1 parton events and uses MCFM version 5.8 [11]. The leading order
calculation for W + 1 parton production is O(αs) and the NLO calculation is O(α2s), so the
predictions are comparable to other O(αs) and O(α2s) predictions of pWT for pWT > 5 GeV, the
minimum jet pT threshold in the calculation. Both of the pQCD calculations are normalized
by dividing the prediction in each bin by the inclusive cross section prediction calculated in the same configuration as the differential cross section, and both have the renormalization and factorization scales set to mW. The O(αs) predictions use the MSTW2008 NLO PDF
sets, and the O(α2