Sumol+Compal
Equity Research Master Thesis
Professor José Carlos Tudela Martins June 2nd,2017
Miguel Medeiros 152415046
1 1. Abstract
The purpose of this dissertation is to evaluate Sumol+Compal equity value at the end of 2016. In this sense a detailed analysis on the company financials and industry sector was done, followed by a DCF and Multiples valuation. The DCF resulted in a share price of 1.01€, that represents a downside of 48.5% when compared to the value of the homologous period, 1.96€. The multiples valuation resulted in a share price of 1.55€, 20.9% below the close price of the year 2015. After an extensive sensitivity analysis, the final outcome was defined, Sumol+Compal share price, at the end of 2016, will be around 1.18€. This value represents a downside of 39.8% when compared to value recorded at the end of the previous year and 10.9% regarding September, 27th, 2016 (most recent information). At this date Sumol+Compal share price was at 1.33€, therefore the outcome of this dissertation is a Sell recommendation.
2 Sumário Executivo
O objetivo desta dissertação é calcular o valor do capital próprio da Sumol +Compal no final do ano de 2016. Para este efeito foi feita uma análise detalhada à situação financeira da empresa e à indústria onde esta está inserida, seguidas de uma avaliação DCF e por múltiplos. O DCF resultou num preço por acção de 1.01€, que representa um prejuízo de 48.5% quando comparada com o valor da mesma acção no período homólogo, 1.96€. A avaliação por múltiplos resultou num preço de 1.55€, 20.9% abaixo do preço de fecho do ano de 2015. Depois de uma extensa análise de sensibilidade, o resultado final foi definido, o preço da ação da Sumol+ Compal, no final do ano de 2016, será à volta de 1.18€. Este valor representa um prejuízo de 39.8% quando comparado com o valor registado no final do ano passado e de 10.9% quando comparado com informação mais recente, 27 de Setembro de 2016. Nesta data a Sumol +Compal registava um preço de 1.33€, por isso a conclusão desta dissertação recai sobre a recomendação de venda das ações desta empresa.
3 2. Acknowledgements
Firstly, I would like to express my gratitude to my supervisor, Dr. Henrique Bonfim, for his guidance, support and commitment that helped me to perform a better work.
Secondly, I would like to thank professor José Tudela Martins for his availability during all thesis session to clarify any doubts, provide critical opinions and enhance my motivation to perform better.
To my friends and colleagues, who always supported and motivated me.
Finally, I want to thank my parents, grandmother and sister, for their unconditional support day by day, understanding and incentive during this project.
4 Table of Contents 1. Abstract...1 2. Acknowledgements...3 3. Introduction...7 4. Literature Review 4.1 Introduction...8 4.2 DCF...8
4.2.1 Firm Valuation Models...10
4.2.1.1 FCFF...10
4.2.2 Equity Valuation Models...11
4.2.2.1 DDM...11
4.2.2.2 FCFE...12
4.2.3 Adjusted Present Value...12
4.3 Relative Valuation...13
4.4 Contingent Claim Valuation...14
4.5 Return Based Valuation...14
5. Company Overview...16
5.1 Business Units...17
5.1.1 Goals and Strategy...17
5.2 Operational Performance...18
5.2.1 Turnover...18
5.2.2 EBITDA...19
5.3 Leverage 5.3.1 Interest Coverage Ratio...19
5.3.2 Financial Gearing...19
5.3.3 Debt/EBITDA...20
5.4 Stock Performance...21
6. Macroeconomic Environment and Industry Overview 6.1 Macroeconomic Environment...22
5 6.1.2 Africa...23 6.1.2.1 Angola...23 6.1.2.2 Mozambique...24 6.2 Industry Overview 6.2.1 Overall...24 6.2.2 Alcoholic Beverages...25 6.2.3 Non-Alcoholic Beverages...26 7. Valuation 7.1 Introduction...27 7.2 Assumptions...27 7.2.1 Revenues...28 7.2.2 Operating Costs...28
7.2.3 CAPEX and Depreciations&Amortizations...29
7.2.4 Working Capital...30 7.2.5 Taxes...30 7.2.6 Financial Expenses...31 7.2.7 Balance Sheet...32 7.2.8 Dividends...32 7.2.9 WACC 7.2.9.1 Risk free and Market Risk Premium...32
7.2.9.2 Cost of Equity...32 7.2.9.3 Cost of Debt...32 7.2.9.4 Capital Structure...33 7.2.9.5 WACC Result...33 7.3 Methodology...33 7.3.1 DCF...34 7.3.1.1 Sensitivity Analysis...34 7.3.2 Multiples...35 8. Price Recommendation...36 9. Comparison...38 10. Investment Note...39
6 11. Appendixes...41 12.Bibliography...50 Table of Images 1. Turnover...18 2. EBITDA...19 3. Financial Gearing...20 4. DEBT/EBITDA...20
5. Evolution of Sales per Sector...25
6. Global Market for Soft Drinks (2013)...26
7. Operational Costs...29
8. Depreciations and Amortizations...30
9. CAPEX...30
10. FCFF Map...34
11. DCF Results...35
12. Sensitivity Analysis Scenarios...36
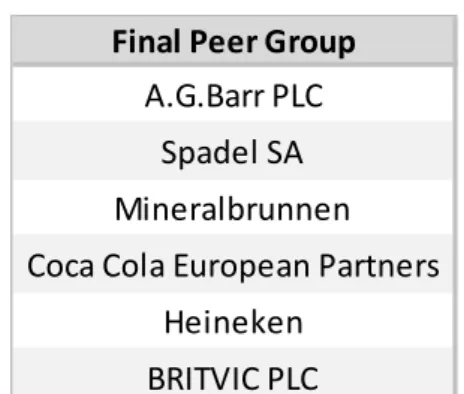
13. Peer Group...37
7 3. Introduction
Sumol+Compal it is a Portuguese company that operates within the beverages industry. It is the leader of non-alcoholic beverages in Portugal and the only Portuguese company within this operational sector quoted on the NYSE Euronext Lisbon.
The purpose of this thesis is to evaluate Sumol+Compal and offer an investment recommendation to investors. In order to do so a deep analysis of the company’s financials and industry sector has to be done, this is the only to reach a truthful and fair share price.
In the first section, Literature Review, it is presented a set of valuation methodologies in order to become easier to choose the most adequate model or models. Choosing the wrong model can lead to misleading results, thus, it is mandatory to comprehend the specificities of all models so it can become understandable which one best fits the company’s features.
In chapter five and six, it is done a detailed analysis to the company’s past performance in order to understand the its financial and operational state and also to assess the most probable path in the future. Within these chapters it also done an analysis to the beverages industry in order to asses this sector trends and to evaluate the company’s performance against its benchmark.
In chapter seven and eight, the assumptions needed to perform the equity valuation of Sumol+Compal are discriminated as also the results of the different methods used. The price recommendation it is presented in the last part of chapter eight.
Finally, in chapter nine, a comparison between the forecasted price and the actual share price of Sumol+Compal at the end of 2016 is made. This will allow to assess the quality of the evaluation and the assumptions behind it.
8 4. Literature Review
4.1 Introduction
This section presents a wide range of valuation models. Investors, bankers and professors spend a lot of time in this area researching and testing in order to come up with a model that results in the true and fair value of the company.
When evaluating a company one of the most important aspects is to determine where value comes from. In accordance to Damodaran (2006) the value of a company arises from three different components, its ability to generate cash flows, their growth (expected) and the respective risk. However, it is difficult to build a model where all these factors are perfectly taken into consideration. Therefore, it could be reasonable to use more than one type of model in order to have a broader understanding of the company and its sources of value. Although this is a determinant topic on the valuation process, the precision of the assumptions is what defines the efficiency of the model chosen (Koller, Goedhart and Wessels, 2005). Assumptions are the corner stone of a valuation, it is what makes the final result feasible and close to reality.
In the following section it will be presented a brief overview of the main and most used valuation models, which are, Discounted Cash Flow Model, Relative Valuation, Contingent Claim Valuation and Return Based Valuation. This is an important step in order to find the model that best fits Sumol + Compal Company features.
4.2 Discounted Cash Flow Valuation (DCF)
The premise behind this model is that the value of a company comes from free cash flows, therefore cash movements are the key in this type of valuation (Koller, Goedhart and Wessels, 2010). DCF valuation is the groundwork of many other three models as they all depend on cash flows (Damodaran, 2002). In addition to this it is also important to mention that these type of models are the most used by investment banks when evaluating projects and companies as they are precise and flexible (Koller, Goedhart and Wessels, 2005).
To put this valuation method into practice there are three variables that must be taken into consideration, expected cash flows, discount rate and terminal value. When knowing these variables, it becomes simpler to understand the purpose of this type of valuation. DCF analysis determines the value of an asset by the present value of the future expected cash flows, discounted at a risk adjusted rate (Arumugam 2007; Damodaran 2006).
The first step when using this type of approach is to estimate firm´s cash flows. In order to do so it is mandatory to analyse the historical performance of the company,which allows to have a
9 (1)
(2)
better perception of essential variables such as growth, return on investment and capital structure. Only after retrieving this information, it is possible to forecast the free cash flows of the company. The forecasted timeline, also known as explicit period, usually has a length of six to ten years, however there are cases were this timeframe must be longer in order to the company reach a steady growth state. The following step is to calculate the terminal value, which gives the firm’s value, in perpetuity, beyond the explicit period. The underlying assumption on this calculation is constant growth rates over the time horizon, usually similar to the growth rate of the economy (Damodaran, 2002). According to the Gordon growth model, Terminal Value is given by the following formula:
Within this process, it is also necessary to estimate the discount rate, which is a very delicate procedure as any decimal error has a great impact on the final valuation result. There are three main models, according to Goedhart (2010), to derive the coast of capital, the Three Factor Model (Fama & French, 1993), the Arbitrage Pricing Theory (Ross, 1976) and Capital Asset Pricing Model (CAPM) (Sharpe, 1964), the most used method and the one that this literature review will follow. In this model cost of capital can be seen as a function of risk determined by three variables, risk free (rf), beta (β) and market return (rm). It is important to mention that beta is the only variable that differs within companies, it is the firm specific risk, it determines the degree of correlation of a firm with the market itself (Koller, Goedhart and Wessels, 2010). Beta cannot be reduced by diversification; therefore, it is the only type of risk that is expected to be rewarded above the risk free rate. Sharpe translated this idea into his formula by adding to the riskless rate a market risk premium (rm - rf), thus, using CAPM, cost of capital Is given by:
To put this model into practice there is the need to estimate all of its three components, risk free, market risk premium and beta. Regarding the first variable, for an investment to be considered risk free it must have no default and no reinvestment risk components (Damodaran 2008). Nowadays the only securities that can provide this type of investment are government bonds. In this sense it is normally used a 10-year Treasury bond issued in the same currency, for inflation purposes, of where the company operates to estimate the risk free rate.
When estimating the market risk premium, the most used method is computation by looking into the historical data, meaning, that the premium is a simple average of the historical differences between the according market index return and risk free rate. According to Koller, Goedhart and Wessels (2010) the market risk premium usually stays within 4.5% and 5.5%.
10 The estimation of beta it is a very difficult and imprecise process, thus, existing a variety of ways to compute it. Beta measures the sensitivity of a stock’s return with the market, this is the main point behind the most common regression used to estimate the correlation coefficient. This is a simple regression on the historical stock’s return (Ri) against an appropriate market index (Rm).
According to Koller, Goedhart and Wessels (2010) there are two main cautions when building this regression. First, the length of data should not be too long in order to have fewer number of extreme events influencing the outcome and secondly, frequency of data should monthly. The result of the regression should not be seen as a final result, according to Rosenberg and Rudd (1992), first it must be compared to the industry beta and later if needed adjusted to it in order to avoid big disparities.
In accordance to Damodaran (2006) there are three main categories within the DCF analysis, Firm valuation models, Equity models and Adjusted Present Value. This will be the approach followed in the literature review.
4.2.1 Firm Valuation Models
These models’ goal is to arrive to the total value of the enterprise (Equity + Debt). In order to do so a DCF analysis is followed, however in this case the appropriate discount rate used is the weighted average cost of capital (Steiger, 2010). The most common model within this valuation methodology is the Free Cash Flow to the Firm.
4.2.1.1 Free Cash Flow to the Firm (FCFF)
In this model the main focus is on firm’s core business, the cash flows that are driven by the principal activities of the company. In order to arrive to these cash flows it is deducted from the after tax (T) operating income the expenditures on investments (CAPEX) and the changes on working capital needs. Thus, FCFF can be seen as the sum of all operating cash flows, positive or negative, before debt claims payments. According to Damodaran (2006), FCFF is driven by the following formula:
As stated before the difference in this type of model relies on the discount rate used. WACC is the expected rate of return for investors from the investments they made on the firm (Goedhart et al., 2010). Its calculation represents an average of the cost of debt and equity weighted by the capital structure of the specific firm (Fernández, 2004).
(4) (3)
11 (5)
(6)
Using the CAPM model it is simple to derive the variables cost of equity and debt. Capital structure information and the tax rate (T) used are provided in the company’s financial report. The tax rate is added to the formula in order to the WACC capture the impact of leveraging a firm, the tax shields (Luerhman, 1997). It is important to mention that this discount rate has a caveat, as it is not able to incorporate the changes on the capital structure throughout time (Luerhman, 1997).
With all the inputs known it is possible to calculate the enterprise value through the Free Cash Flow model. It consists on the sum of all FCFF (forecasted) discounted by WACC plus the terminal value. 4.2.2 Equity Valuation Models
These models’ premise focuses on shareholders and their stake on the business. Therefore, the methodology behind these models, similar to the firm valuation ones, consists on discounting the cash flows which the shareholders are entitled to at the appropriate equity rate of risk (Damodaran, 2006). There are two main approaches within these type of models, Dividend Discount Model and the Free Cash Flow to Equity. This literature will explore these models.
4.2.2.1 Dividend Discount Model (DDM)
According to Foerster & Sapp (2005), regarding equity, the expected cash flows are
usually dividends. In this sense it is simple to understand the rationale behind this model, it consists on arriving to the value per share by summing all expected dividends discounted at the correct cost of equity (ke).
This was the formula initially developed by Durand (1957), which later was studied and modified by Gordon, who created the Gordon Growth Model (GGM). This approach follows practically the same line of reasoning as the previous one, however it assumes that dividends will grow at a perpetual rate (Gordon, 1962).
12 (8)
(9)
Although being a very common and simple model to put into practice, DDM has some limitations concerning the assumptions behind it. The first limitation regards the fact that not all companies pay dividends (more usual on mature firms) and that the ones that do so are tending to make it with less frequency (Fama and French, 2001). Nowadays companies prefer other methods of giving money to equity holders, such as share buybacks or hold it as excess cash for future investments. The second limitation concerns the sensitivity of this model to changes on its inputs; a decimal variation on the growth rate produces a completely different outcome. Therefore, the estimation of all the variables and the assumptions defined must be accurate with the reality of the company and macroeconomic environment.
4.2.2.2 Free Cash Flow to Equity (FCFE)
The FCFE model can be seen as an improvement of the DDM as it takes into consideration all equity claims, and not just dividends or share buybacks. The FCFE is the amount of money that shareholders are entitled to, after deducting all the expenses, investment and debt repayment (Damodaran, 2012). When knowing how to calculate the FCFF it is simpler to arrive to the FCFE.
After calculating the equity cash flows, the process arrive to the company’s equity value is identical to the one followed in the FCFF methodology. Thus, the total value of equity is equal to the sum of all FCFE discounted at the cost of equity plus the terminal value.
4.2.3 Adjusted Present Value (APV)
The APV method was developed by Myers (1974) and, according to Luehrman (1997), it can be seen as a substitute for the WACC methodology as it can easily capture the changes in the capital structure of a firm. This approach defines the value levered of a firm as a sum of the value unlevered of it (as if it was all equity financed) and a variation caused by tax savings (Ehrhardt and Daves, 1999).
(10)
13 In this model the first step is to calculate the unlevered value of the firm, meaning take into to consideration the cash flows from the core activities of the business as if the company was all equity financed. This calculation consists on a growing perpetuity of firm’s cash flows discounted at the unlevered cost of equity (αe) in order not to capture the impact of leveraging. In the second step the goal is to calculate the benefit of paying interests (raising debt), the tax shields can be seen as the money saved on taxes for having debt payments. In this sense, tax shields will increase the value of a firm however, according to Koller, Goedhart and Wessels (2010), there are other parcels that can be added to the APV calculation, such as the costs of financial distress and security issue costs. All these variables must also be discounted, usually, at the cost of debt.
The APV corrects some limitations of the WACC methodology, such as fixed debt ratio and financial side effects, therefore it becomes a more reliable and error free model (Booth, 2002), thus, having a broader application area in comparison with the WACC method. APV also allows the managers to retrieve essential information from it, for example, this method gives a better perspective of the assets’ source of value (Luerhman. 1997).
4.3 Relative Valuation
Relative valuation is one of the most used methods by investment bankers; usually it is used as a complement to other models, for example DCF. The objective in this type of valuation is not to arrive to the intrinsic value of the company but rather to comprehend its position in relation to peers. This allows a company to better understand how the market is evaluating its sector. Multiples valuation is the most common relative valuation method, and it is the one that going to be described in this literature review. This type of valuation, according to Damodaran (2012), has a simpler approach and its results are easier to interpret for all stakeholders than a DCF analysis.
The first step when building a relative valuation is to select a set of comparable firms, known as peer group. In order to make sense this group must have some similar features with the company that is being evaluated. In accordance to Damodaran (2005) firms within the peer group should belong to the same industry; the assumption behind this premise is that companies in the same sector might have the same essentials, and also have the same risk, growth and cash flows. Finding companies that have similar prospects of growth, risk and cash flows it is not very easy or common; therefore, there are other variables that could be considered, such as betas, earnings per share and return on equity (Damodaran, 2006).
The second step is to select the appropriate multiples. This choice depends on the industry and on the company specificities, however the most common ones are price to earnings ratio (P/E) and enterprise value over EBITDA (EV/EBITDA).
14 There are some findings regarding this method that are important to discriminate, as they will help to reach a more precise outcome. First, according to Lie and Lie (2002), forecasted earnings produce more accurate results than trailing earnings. Although being more difficult to manipulate, sales multiples tend to perform worst when compared to other enterprise value (EV) multiples (Liu, Nissim and Thomas, 2002). Thirdly, Lie and Lie (2002) found that when using EV multiples it is better to use EBITDA instead of EBIT. In accordance to Koller, Goedhart and Wessels (2005) findings it is better to us EV multiples rather than P/E multiples as the last one is more vulnerable to changes in the capital structure. Fifth, industry multiples should always be considered, besides not being directly related to profitability, as they take into to account the specificities of a certain sector (Koller, Goedhart and Wessels, 2005). Finally, as finding the appropriate peer group is a difficult task, in some cases the multiples should be adjusted according to the differences in the determinant choosing variables, growth and risk. When calculating, for example, the EV/EBITDA multiple, according to Koller, Goedhart and Wessels (2005), there are some adjustments that might need to be made regarding operating leases, excess cash, non-operating assets, employee stock options and pensions.
4.4 Contingent Claim Valuation
The premise behind this model consists on deriving the value of assets, through option pricing models, that have options characteristics. Contingent claim valuation can also be seen as a complement of the DCF analysis (Luerhmam, 1997) as it can capture the value of manager’s decisions. This valuation comprises two main models, Black Scholes and Binomial models (Damodaran, 2012), the first one is more complex and it is often used to analyse commodity problems, when there is access to market prices and volatility. The second one it is easier to put into practice and it is often used for solving managerial problems.
Although being a more flexible model as it can capture the ability of a company to continue or leave a project it is important to refer that not every case can be treated as option-like valuation and, according to Damodaran (2012b), option pricing models increase the number estimated errors within the results.
4.5 Returns based Valuation
Returns based valuation’s goal is to evaluate value creation over a certain period (Damodaran, 2012) similar to the NPV analysis. Thus, with these models it is possible to measure the value created by managers’ decisions. The most common model is economic value added (EVA).
(12)
15 According to Damodaran (2005) EVA provides two main ideas to investors, first it measures the value created by a firm that is driven by a current investment and secondly it gives a different standpoint on the quality of growth by comparing the return on invested capital with the actual cost of capital. For example, a certain company under a new investment project can be generating profit however it is actually destroying value as it invested below the cost of capital.
Returns based valuation are normally used as a complement of other models, such as DCF or Multiples analysis, as it provides a different but important outcome about value creation. This is a common use as sometimes the assumptions behind the DCF and Multiples valuation might not hold or be debatable.
16 5. Company Overview
Sumol was founded in 1954 in Algés, firstly assuming the name Refrigor. This company assumed an important role in the Portuguese beverage market from the start as it introduced the first fruit juice soft drink in Portugal. Throughout the years the company was able to build a successful business due to the continuous effort on innovation and immediacy with clients; afterwards Group Sumol was formed in order to manage the brand, production and distribution of all the group’s products.
In 1952 Compal was founded, in Almeirim, firsty assuming the name Companhia de Conservas Alimentares, S.A.. In an initial stage the company focused on the production of preserved tomatoes, later on expanding its business to canned vegetables, soft drinks, nectars, fruit juices and sparkling water. Throughout time Compal made a lot of changes within its administration, going public and returning to the private sector in 1993. It is also important to mention that this company expanded their business worldwide achieving, in 2003, a strong position in Spain.
Sumol+Compal it is the result of a merger between Group Sumol and Compal. In 2005 Sumol with the financial help of the bank Caixa Geral de Depósitos acquired Compal S.A.. This operation was only finalized in 2008 having a total cost of 8 million and synergies evaluated at 10 million euros. The goal of this operation was to build a leading brand in the Portuguese beverage´s sector. By 2011, this new company had reached its main goal, having a market share one and half times greater than its main competitor.
Having reached successfully the central goal, Sumol+Compal now intends to extend its operations to other international markets and become a reference in Africa. At this moment it operates over 70 countries, has more than 1300 employees, has a portfolio of nearly 50000 direct customers over the Horeca sector, Cash&Carry and retailers. It is also the only food and beverages company listed on the NYSE Euronext Lisbon.
Regarding its organizational structure this company it is composed by Sumol+Compal S.A., Sumol+Compal Distribuição S.A., Sumol+Compal Mozambique S.A., Sumol+Compal Angola S.A. and Sumol+Compal Marcas S.A.. The first one, it is responsible for managing and supporting the other holdings by planning tasks and setting goals. The second one is the part of the company that deals with sales of the products and the respective distribution to all clients (Portugal and over frontier).
The Angola and Mozambique holdings are responsible for controlling and implementing the main activities on those countries, such as, production and distribution. For the past three years
17 these markets have been revealing a positive response from consumers as sales increase year by year.
Finaly, Sumol+Compal Marcas S.A. has the role of managing all brands of the company, by guaranteeing their commercialization and distribution in all countries. This division also develops market studies by analysing consumers’ preferences and identifying new opportunities.
Relevant fact:
Sumol+Compal, on November 2014, sold 49.9%, for 88.18 milliom euros, of the Sumol+Compal Marcas S.A. to Castel (through one of its affiliates – Copagef), the wine market leader in France and the second biggest operator of beer and sodas in Africa. Thus, the goal behind this operation was accelerate expansion and reinforce the position in the African market. It is also important to mention Sumol+Compal S.A. kept the domain over its holding thus having majority of members elected for the administration council.
5.1 Business units
Sumol+Compal has a wide range of products within its portfolio. These products can be subdivided into four categories, canned vegetables and tomatoes, waters and beers, soft drinks and juices and nectars. The main brands within these categories are Sumol, B!, Pepsi, 7UP, Tagus, Serra da Estrela, Frize, Estrella Damm, Compal (most sold one) and Um Bongo. Besides the production and distribution of these goods, this company it is also responsible for the distribution of three brands in Portugal: Gallo, Lipton and Cacaolat.
5.1.1 Goals and Strategy
For the following years Sumol+Compal has three main goals. Firstly, it aims to be a leading international company in the fruit and vegetable beverages market. Secondly, it intends to be the leader in the same market in Portugal, Angola and Mozambique. Finally, this company also has the purpose to achieve, in 2018, a sales volume of 450 million and an EBITDA margin of over 14%.
These goals will still be in line with the vision of the company, which consists on the fact that fruits, vegetables and water are an essential source of pleasure. Innovation and new plans of communication will be the corner stone to achieve those goals. For example, in order to keep increasing sales in Portugal a new concept was introduced to the market, “Frutology”. It consists on developing products only containing the most famous national fruits.
18 341,8 309,2 311,8 321,0 351,3 2011 2012 2013 2014 2015
Figure 1 - Turnover (M)
Regarding international markets, they are expected to follow the Portugal sales growth tendency. The implementation of a new factory in Angola and the emerging effects of the alienation of Sumol+Compal Marcas to Copagef are the main keys to the increment of sales in Angola, Mozambique and later in other countries where they do not operate at this moment.
5.2 Operating Performance 5.2.1 Turnover
Since 2012 Sumol+Compal has seen their sales increasing year by year, growing 13.6% till 2015. It is important to refer that this company suffered a big negative impact on its results and sales in 2012 in comparison to the previous year mainly due to the increment of VAT – soft drinks and canned vegetables had an increase to 23%, previously 6% and 13% respectively, and waters increased from 6% to 13%. This was a measure applied by the Portuguese government, as a consequence of the financial crisis, that concerned restaurants and similar establishments. This measure resulted on a reduction of private consumption, which can explain the decrease of 14.5% on sales that year (appendix 2).
In 2015 Sumol+Compal had a sales volume of 341.3 million euros, growing 10.1% in comparison to the previous year. This increment reflected on both domestic (Portugal and Spain) and international markets being Angola the main source of revenue outside boarders. Cocerning international markets its sales´ growth it is mainly justified by the merger between Sumol and Compal – exponential growth since 2010. The deal with Copagef will also be a key determinant point on the continuous increment of revenues on the African countries and will allow the company to reach countries where they do not operate.
19 44,2 35,6 39,2 41,7 43,2 2011 2012 2013 2014 2015
Figure 2 - EBITDA (M)
5.2.2 EBITDAThis income statement item allows a company to assess the profitability that is driven by the operational activities. As it happened with sales, for the past three years, EBITDA has been increasing, having a growth rate from 2012 to 2015 of 21%. This is mainly justified due to the increase in sales on all markets where Sumol+Compal operates, with more emphasis on Portugal and Angola. The financial crisis lived in Portugal also affected this in indicator as it had a decrease of approximately 19% from 2011 to 2012.
5.3 Leverage
5.3.1 Interest Coverage ratio
This ratio indicates the ability of a company to pay its financial expenses with the earnings driven from operations, it is calculated dividing EBIT by interest expense. For Sumol+Compal this measure has been increasing over the years reaching a value of 1.58, that corresponds to a B- rating grade, in 2015. This indicator has been improving due to a constant decrease of interests.
5.3.2 Financial Gearing
In order to better understand how a company finances its activities the debt over equity ratio is studied. Throughout the past years Sumol+Compal has presented a slight inconstant leverage ratio with values always over 100%, excluding the year of 2014 where it was 78%. Although the value of net debt has been decreasing, these high value ratios show that this company is highly in debt over the past years, this can be justified by the increasing amount of bank overdrawns as form of credit – large amount of cash as liability (net cash is always negative from 2011 to 2015, except 2014).
20 210% 240% 207% 79% 138% 2011 2012 2013 2014 2015
Figuere 3 - Financial Gearing
6,8 8,3 6,9 4,2 5,6 2011 2012 2013 2014 2015
Figuere 4 - Debt/EBITDA
5.3.3 Debt to EBITDA Ratio
This indicator allows to determine the time frame in which the company would be able to meet its debt obligation if EBITDA and net debt would remain constant. Hence, this ratio permits to assess the solvability of a firm. In case of Sumol+Compal this ratio for the past five years has presented an average of 6.5 being the main outlier the value reported in 2012 (8.3) which is reasonable due to the financial crisis lived in Portugal at that time. In 2015, the value of this ratio was 5.6 which compared to value of 2011 represents a decrease of almost 18%. This reduction can be justified by the cash entrance from the alienation of Sumol+Compal Marcas S.A. to Copagef, as it can be seen in the balance sheet (appendix 2) the big entrance of cash in 2014.
Source: Sumol+Compal 2015 Financial Report
21 5.4 Stock Market Performance, Shareholder Structure and Dividends
From 2011 until June of 2015 Sumol+Compal stock shown a decreasing pattern but also very stable behavior with no big changes. In June 2015 this company decided to decrease the number of shares outstanding from 96.030.687 to 60.499.364 which resulted on sudden price increment reaching its highest ever recorded value, 2.05 euros. In this year the close price was 1.96 and the minimum recorded was 0.95 euros. Regarding the shareholder structure 70.53% of the company is held by Refrigor, 10.5% belongs to Caixa Geral de Depósitos Risk Fund, the remaining percentage is held by other investors (with much lower claim) and are dispersed on the stock market (free floated). Finally, in what concerns Sumol+Compal dividend policy, they do not follow a very strict one. In the last five years they paid dividends twice, once in 2012 amounting to 0.06 euros per share and the other was in 2014 with a value of 0.16 euros per share.
22 6. Macroeconomic Environment and Industry Overview
6.1 Macroeconomic Environment
In 2008, the American economy suffered one of its biggest downturns in history. This financial crisis easily spread consequences all over the world turning into a global recession with drastic fallbacks. Negative GDP’s, exponential increment on unemployment rate, decrease in salaries, increase of poverty and a big decline on private consumption – consumers started to look for cheaper substitutes or simply excluding certain products from their daily consumption habits – were the main consequences. The years that followed were marked by drastic political measures trying to revert this financial recession. All markets suffered from this crisis and the beverages one was not an exception. Sumol+Compal saw its results declining in both domestic and international markets. The majority of countries started to revert this global crisis tendency in 2012 showing positive indicators in the following years. In the following part of this section, it will be presented a macroeconomic analysis of the main countries where Sumol+Compal operates.
6.1.1 Portugal
Europe suffered a lot from the American crisis and Portugal was not an exception. This financial crisis left Portugal in a very unstable economic, social and political situation making necessary to ask for financial help, in 2011, from the European Union and IMF. As it can be seen in appendix 1.1 Portugal from 2011 to 2013 presented a negative GDP variation, unemployment rate in 2013 was above 16%. In order to receive the necessary monetary aid, the Portuguese government had to be under some restrict performance covenants, limit budgets, increase taxation; lower public services’ salaries were the principal ones. This help program also comprised an organization, named Troika (European Central Bank, IMF and European Commission), that would periodically visit Portugal in order to check if the imposed rules were being followed and to assess the efficacy of them. These visits were very important as if the outcome was positive it would mean a decrease on bearing interests and a better financial image for outside investors. The program that Portugal was under lasted for three years and resulted on a gradual economic recapture starting to show positive outcomes in 2014. GDP grew 0.9% comparing to previous year. Over the years of 2014 and 2015 private consumption started to increase along with a decrease of the unemployment rate, also it was recorded an increase in exports thus reducing the net balance (appendix 1.1). The IMF projections for Portugal are that these main indicators continue to increase at a slow pace for the next years, always showing positive GDP variations and a decreasing employment rate (in 2021 it is believed that it will be lower than 9% - 1.1 appendix).
23 6.1.2 Africa
For the past decade the African continent has been presenting a strong economic growth, in 2007 it was above 6%, thus becoming an attractive destination for companies to expand their businesses and increase their earnings. However, this pleasant economic scenario has serious downturns that must be taken into consideration, first, the African economy depends almost in full on oil, second, there is a big discrepancy between classes resulting in a nonexistent middle class and on high levels of poverty. Thirdly, there is no health care system, high levels of mortality and low indexes on education. The 2008 financial crisis also had repercussions on this continent slowing its economic growth; in 2009, the growth rate was only 3% (World Bank), as the oil price during the crisis period was highly inconstant and mainly decreasing. Regarding a more recent period, the overall African economy is returning to its original growth pace, expected to be 5% in 2016 according to African Economic Outlook. In the following part of this section a more detailed analysis on Angola and Mozambique macroeconomic scenario will be made, as they are the main countries where Sumol+Compal operates outside Portugal’s boarders.
6.1.2.1 Angola
As it happened with the global economy of Africa, Angola, the second largest producer of oil in this continent, during the financial crisis suffered a decline on its growth (remained always positive as it can be seen in appendix 1.2) mainly due to the decrease on oil prices worldwide. It was during this recession period that the oil price reached its historical minimum, January 2015, 50% less of the price in the homologous period. There are two other reasons that contribute to this economic recession in Angola, the first one, it is the high amount of public debt that was being poorly invested (due to the oil price extreme reduction the investments made in that sector were not generating cash flows). Secondly, concerns the depreciation of national currency, which finished the year of 2015 with a devaluation of, approximately, 40% against the main reference currencies, euro and dollar. As a result of this currency instability, inflation, in the same year, increased to 10.6% (17.5% on food sector).
More recently the oil prices have been slowly recovering, what might project an increase of the GDP for 2017 and onwards, however the political and social instability make this assumption loose strength. Based on these assumptions, the IMF predicts a lower growth rate for 2016, compared to 2015, and for the following year, it will assume a value around 1.5%.
24 6.1.2.2 Mozambique
In contrast to Angola, Mozambique from 2010 to 2014 had an increasing GDP growth rate recording a value of 7.7% in 2014. However, in 2015, due to the political instability (elections) lived in the last trimester of 2014 and the floods in the beginning of the year, economy suffered a negative impact, reducing its GDP growth rate by one percentage point in comparison to the previous year. Regarding the projections for 2016 and onwards it is assumed that Mozambique will continue to present positve GDP growth, change of 3.4% in 2016 and a change of 4.5% in 2017. Along with these forecasts, it is also important to mention that, the government of Mozambique has plans of increasing the State revenues by more than 30% of GDP and to decrease public debt below 40% of the GDP in the next two years. Inflation, as it is a trade mark on the African continent, will continue to rise and present growth rates above 5%.
6.2 Industry Overview 6.2.1 Overall Industry
Sumol+Compal it is a company that belongs to the beverage industry, which is characterized by the production of alcoholic and non-alcoholic drinks. Within these types of beverages, there are three main categories of drinks, beer, soft drinks & bottled water and, thirdly, spirits & wine. This sector is one of the biggest in the world, having strong players across all countries, thus, being a very difficult area for new competitors to enter. It is also an industry highly volatile to the trends on the market and various macroeconomic events. For example, nowadays, people are more concerned about the lifestyle that they carry in their daily routines, people want to be healthy and want the others to notice that. This new trend in the market makes customers less loyal as the change constantly within the sector (highly influenced by others – peer pressure). Companies in order to adapt to this new behavior need to increase their product portfolio, with innovation and a significant number of alternatives. Another factor that has been influencing the beverages industry throughout the past years is globalization, companies due to more liberal geographical policies are able to expand their businesses outside national borders, and thus, achieving higher results in a faster way. This industry has been facing also another trend in the past years that has brought strong changes into the sector, which is the increasing number of mergers and acquisitions operations. These deals allow companies to become more competitive, by increasing revenues, gaining market share (higher bargain power), absorbing new technologies and ways of production, benefiting from economies of scale and increasing their product portfolio.
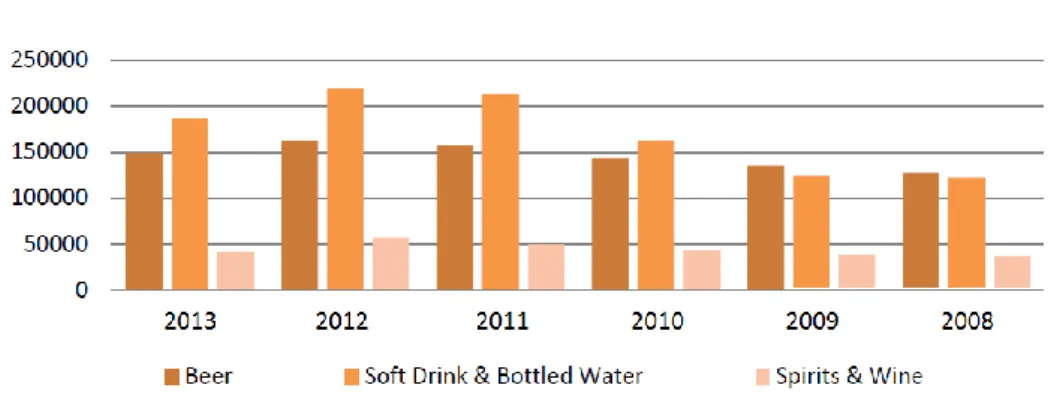
25 Concerning a more analytical review on this sector, despite the negative impacts of the modern financial crisis this industry was able to reverse the situation. It shown an average growing tendency, mainly due to the increment of the amount sold of carbonated drinks, from 2008 until 2012, as it can be seen in the graph above. Within this period, every product category increased its sales, being beer and Soft drinks & Bottled Water the ones with highest weight in total sales. It is also important to say that usually the beverage sector trades at a premium presenting, for all categories, an enterprise value over EBITDA multiple always above the benchmark.
6.2.2 Alcoholic Beverages
This segment it is composed by three groups, beers, spirits and wines. The main asset of this product portfolio is beer that corresponds to 50% of global consumption, wines has a share of 30% and spirits 20% (according to Banco Big Industry Analysis). Looking to the market as a whole, the alcoholic beverages industry presents a 1.4% growth rate over the past ten years, being Europe, the biggest consumer. However, since the financial crisis, Europe has been decreasing its consumption on alcoholic drinks, (-0.9% in the past ten years), mainly due to the sequential private consumption decrease but also, because people are starting to worry more about the healthiness of their lifestyles. This European declining tendency extends to all three categories of alcoholic beverages. On the other hand, emerging markets have been growing constantly, within the same period range, therefore, becoming the main drivers of this industry´s performance. With a growth rate around the 3.9%, Asia has been the continent with the highest consumption increment over the last ten years. It is important to mention that China has not been following the same path as the Asian continent, especially regarding spirits drinks. Finally, North America has been presenting very stable levels of consumption, representing 36% of total consumption.
Figure 5 - Evolution of Sales per sector (M)
26 6.2.3 Non-alcoholic Beverages
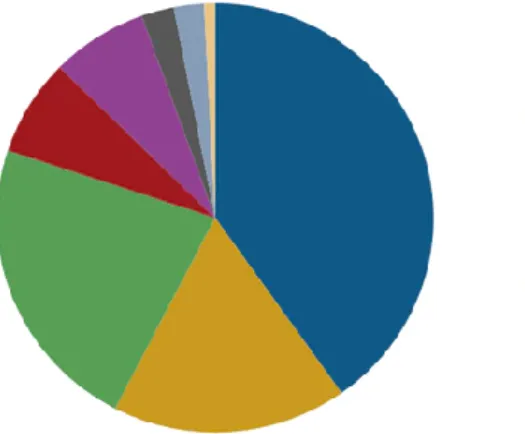
The non-alcoholic beverage industry broadly includes soft drinks and hot drinks. Soft drinks contain carbonated or non-carbonated water, a sweetener, and a flavor, and hot drinks include coffee and tea. The soft drink category dominates the industry, being are the main driver of revenues within the non-alcoholic beverages sector, and it comprises five different types of products, carbonated soft drinks, juices and nectars, waters, sport and energy drinks and finally, ready to drink tea and coffee. Bellow it is presented a pie chart that discriminates the composition of the soft drink market.
As it is shown in the figure above, carbonated soft drinks are the category with the highest market share, around 40% (337.8 billion dollars – euromonitor international). In second comes bottled water with a market share evaluated at 190 million dollars and thirdly comes the segment of juices with 146.2 billion dollars of market size. The top three segments totalize 80% of the non-alcoholic beverages’ market. Despite being the main segments, these three categories in the past years have been slightly decreasing its revenues as previously explained. On the other hand, the smaller segments such as ready to drink coffee and tea, and also, sports and energy drinks have been increasing for the last six years at a significant pace.
Figure 6 - Global Market for Soft drinks (2013)
27 7. Valuation
7.1 Introduction
In the following section it will be presented the methodology and the assumptions behind it to derive the fair equity value of Sumol+Compal. These assumptions are divided into eight parts, Revenues, Operating costs, CAPEX and Depreciations & Amortizations, Working Capital, Financial Expenses, Taxes, Balance sheet and WACC. The goal of this valuation is to derive the share price of Sumol+Compal at the end of the current year, 2016.
The first process within this valuation was to build a cash flow statement with all necessary forecasted items in order to arrive to the free cash flows to the firm. The operational forecasts were made within a six-year period (2016-2021), followed by a perpetuity that begins in seventh year. It is important to mention that there was no need for a larger period of forecast as the company within that time range is in steady state. After, a DCF approach is followed to obtain the present value of those cash flows, the enterprise value corresponds to the sum of all this cash flows. Finally, in order to arrive to the equity value, it is deducted from the enterprise value, the net debt and minority interests. According to Arumugam (2007), the approach above described it is the most common among corporate valuations, and as Sumol+Compal presents a very low volatile forecasted capital structure (mainly due to the alienation of the Marcas holding to Copagef) it is feasible to follow this procedure.
7.2 Assumptions
Before starting the valuation process, it is necessary to forecast the income statement and balance sheet items so it is possible to build the cash flow map. To do so a series of assumptions had to be made. The starting point of this valuation relies on five facts that will directly influence the assumptions made, the first one is the alienation of Sumol+Compal Marcas S.A to Copagef, this operation will allow the company to have a boost on its sales; the second fact concerns the objectives that the company settled for the next three years (480 million in sales in 2018 – information from 2015 financial report). In addition, the implementation of a new plant in Angola it is supposed to increase international sales. The fourth fact regards the increase on the sugar tax projected for 2016 and 2017, this will result on a decrease of company’s results and cash flows. Finally, the fifth fact concerns Portugal’s (also Angola, for other reasons – previously explained) political and economic environment that due to recent elections might have a negative impact on Sumol+Compal revenues. The combination of all these ideas results in a positive growth, however in a softer pace than the ones projected by the company at the end of 2015 (for example the 480 million in sales will only be achieved in 2021).
28 7.2.1 Revenues
Sumol+Compal turnover was estimated for each business segment taking into account previous growth rates and previous product’s sales weight on total revenues (appendix 4). The regions of sale were not taken into consideration as the most recent financial report does not provide detailed information on international sales per product type, thus, becoming unable to make feasible assumptions. The revenues were estimated for the following products, carbonated soft drinks and iced tea; juices, nectars and fruits still soft drinks, waters and beer.
The first part in this estimation was to calculate the historical growth rates and the weight on sales by product category. With this information the historical average can be computed, which will serve as a reference to estimate future rates. Being the general idea an overall increase on sales in every business segment and keeping in mind the possible negative impacts, the growth rates projected for the explicit period are slightly higher in value than the historical data average. From 2013 to 2015 the average growth rate was 4.4% and for the forecasted period it is 6% (appendix 3). This projected value was estimated also taking into consideration the weights of each product on total sales. The goal was to increase revenues by respecting the historical tendency of the products sale weight on total turnover. At the same time the other sources of income lost strength (historical trend).
With the growth rates forecasted for each product, the calculation of sales becomes very simple, it consists on multiplying the previous sale value by the corresponding growth rate of the actual year. Repeating this procedure for every business segment and year of the explicit period allows to arrive to total sales by summing all forecasted revenues in the same year.
7.2.2 Operational Costs
For operational costs it is intended the necessary expenses that the company needs to incur in order to proceed with its main activities. Within these type of costs there are the costs of goods sold, selling expenses, general and administration expenses, provisions and impairment losses and finally other gains and loss. Looking into a broader picture of these costs they are supposed to increase as sales grow, however, this increment will not be as significant as the one noticed with sales. This is mainly justified by the implementation of the new plant in Angola and alienation of Marcas holding that will allow Sumol+Compal to benefit from economies of scale. With the purpose of estimating future operating costs an analysis of the evolution of historical costs regarding total sales was made. A separate analyze was made to each specific cost, focusing on the differences in weights between years (appendix 5). Having the average of those differences and keeping in mind the costs’ influencers previously mentioned, selling and general administration costs are supposed to
29 200,0 250,0 300,0 350,0 400,0 450,0 500,0 2011 2012 2013 2014 2015 2016 2017 2018 2019 2020 2021
Figure 7 - Operational Costs (M)
increase in value and weight (more salaries, marketing expenses, productions cots, transportation expenses…). The remaining operational costs will maintain the declining tendency in weights recorded in historical data (decrease by historical average year by year). These changes in costs will be translated in a slight increase of the weight concerning sales of total costs. For the past years operational costs as a whole have been increasing slowly presenting an almost constant percentage concerning sales, average of 88%. This weight, regarding the explicit period, will increase, at a very low rate, average growth of 0.4 percentage point per year (in 2021 total operating costs amount to 90.7% of total sales).
7.2.3 Investment in Capital Expenditures, Depreciation and amortizations
In order to estimate capital expenditures (CAPEX) it was assumed that this value would be equal to the sum of the acquisitions made in property, plant and equipment (PPE) and on intangible assets. As no other information was provided on the financial reports this was the only feasible assumption to make. Regarding the estimation of the acquisition of those assets, a study on the weight of sales was realized, revealing an historical average of 4.2% and 1.2% for PPE and intangible assets respectively. Given no further information about future expenditures the percentages were held constant for the entire explicit period, thus, being the forecasted acquisitions a simple multiplication between the percentage of total sales and the respective revenues of that year.
Concerning depreciations and amortizations a similar approach was followed. For depreciations a study was made in respect to the weights on total PPE and concerning amortizations the same idea was put into practice but in respect to intangible assets. In order to estimate these variables, it was assumed that the weights within the explicit period would be equal to the historical average. With all the information necessary future depreciations and amortizations are equal to the forecasted weight multiplied by the total value of the respective assets (PPE and intangible) of the previous year.
30 0,0 5,0 10,0 15,0 20,0 25,0 2012 2013 2014 2015 2016 2017 2018 2019 2020 2021
Figure 8 - Depreciatons & Amortizations
Depreciantions Amortizations 0,0 10,0 20,0 30,0 40,0 50,0 60,0 2012 2013 2014 2015 2016 2017 2018 2019 2020 2021
Figure 9 - CAPEX
PPE Intangible assets
Finally, with the acquisitions and depreciations/amortizations defined it is simple to derive the value of PPE and intangible assets, it consists on adding to the asset value of the previous year the acquisitions and deduct the depreciations of the actual period. It is important to mention that CAPEX estimations are in line with the forecasted sales (increasing CAPEX normally implies increasing sales). Depreciations and amortizations increased in comparison to the previous years due to the fact that in 2015 a lot of investment on assets was made. As it can be seen in appendix 5 depreciations and amortizations are similar to capital expenditures meaning that Sumol+Compal is in steady state.
7.2.4 Working Capital
For working capital, it is intended the ability of a company to meet its short term obligations. It is calculated by deducting current liabilities from current assets, the first variable it is composed by accounts payable, liabilities for current taxes and other current liabilities. The second variable comprises inventory, account receivables, assets for current taxes and other current assets. In the past five years Sumol+Compal has presented a positive working capital with the exception of 2015 (appendix 7) where it amounted to -4.6 million euros, this value is justified by a large increase on
31 accounts payable in that year. Within this period Sumol+Compal recorded mainly a negative net change in working capital, meaning that year by year the company was becoming more stable..
In order to estimate working capital all variables were studied as a percentage of total sales (appendix 7.1). As no information about changes in current assets or liabilities is stated on the 2015 financial report, the weights within the forecasted period are assumed to be similar to the historical average. With this assumption the positive working capital and the negative change of working capital tendency maintains.
7.2.5 Taxes
It was assumed a constant tax rate of 22.5% (including city tax), same as 2015.
At the end of 2015 Sumol+Compal presented an amount of 3.3 million euros in deferred tax assets, which are in its majority tax losses carried forward. In order to simplify the process, it was assumed that these tax advantages would be consumed over a period of four years (2017-2020), in equal amounts. Deferred tax liabilities amount to 63.9 million euros, which are in majority tax liabilities related with PPE revaluations not accepted for tax purposes. The estimation process is equal to the one followed for deferred tax assets, the only difference concerns the length of the period in which these obligations will be paid. Given the large value and the nature of this item it was assumed a period of payment of sixteen years (4 million per year). It is important to mention that the utilization and payment of these deferred taxes will have a direct impact on the free cash flows to the firm.
7.2.6 Financial expenses
In order to estimate the interest payments, first it was necessary to derive the net debt value, which is calculated by adding long term debt with current portion of long term debt and afterwards it must be deducted the net cash. The second step consists on arriving to the cost of debt, to do so it was calculated the interest coverage ratio. With this value it is possible to know the credit rating of Sumol+Compal in each year and sequentially the spread that they are under. To arrive to the cost of debt it is only necessary to sum to the spread the risk free rate. Thus, the interest payments, for each year, are equal to the multiplication between cost debt and net debt.
32 7.2.7 Balance Sheet
In the previous section it was estimated the main items of the balance sheet (appendix 2). The remaining ones were mainly held constant through the entire explicit period, at 2015 values. In some items there was the need to make an historical average instead of holding them constant due to the big differences in value between previous years. It is also important to highlight that in the net income of the period parcel the value inputted was the forecasted net result for that year.
7.2.8 Dividends
Sumol+Compal does not hold a very strict dividend policy, it distributed earnings through its shareholders twice in the last five years. As no information about future dividends is displayed in the financial reports it was assumed the during the explicit period no dividends would be distributed.
7.2.9 WACC
7.2.9.1 Risk free and Market Risk Premium
In the WACC calculation the risk free rate used was the yield of the German ten-year government bond. The reasoning behind this choice relies on the fact that this is the only title closest to a riskless asset written in the same currency as the main market where Sumol+Compal operates, Europe. This bond yielded a rate of 0.36% in the thirteenth of December of 2016.
The market risk premium (MRP) was derived as a weighted average of equity risk premiums by total turnover per geographical region. Sumol+Compal sales region are discriminated as followed, the first region is Portugal and Spain, the second one is Africa, the third one is Europe and finally America and Asia. In order to compute the market risk premium for the regions as described, an average between the countries in question was made (for example the MRP of Portugal and Spain region it is an average of the premiums of each country). The risk premiums used to compute those averages were taken from Damodaran (premium based on rating – info from January 2016) and a paper named The (un)predictable equity risk premium written by Bianci, Drew and Walk. The market risk premium reached was 10.65% (appendix 9).
7.2.9.2 Cost of Equity
The cost of equity was calculate based on CAPM factor model. This model comprises three factors, the risk free rate, levered beta and the market risk premium. The first factor as previously explained corresponds to the yield of the German ten-year government bond. The beta used was estimated based on Sumol+Compal peer group (more detailed in the valuation section). The betas from the peer group were taken from Reuters platform and it averaged a result of 0.54. This was the
33 procedure chosen as the peer group in question fairly represents Sumol+Compal and it is close to value proposed by Damodaran for European soft drinks companies. The market risk premium used was 10.65%, the estimation process it is described in the previous section. The final cost of equity is 6.1% (appendix 9.1).
7.2.9.3 Cost of Debt
As previously explained the estimation of the cost of debt follows the approach developed by Damodaran. It consists in adding the risk free rate to the companies’ default risk spread. The spread is discovered according to the credit rating (based on interest coverage ratio – EBIT over interests of previous year) of the company, in the case of Sumol+Compal is B- in 2016, which corresponds to a spread of 6%. Adding the riskless rate, the cost of debt is 6.36%, when incorporating the impact of tax shields the cost of debt is 4.9% (appendix 9.1).
7.2.9.4 Capital Structure
For the past five years Sumol+Compal presented an almost constant capital structure. As there are no relevant facts presented by the company that might change this capital structure trend it was assumed a constant capital structure for the years concerning the explicit period. In 2016 debt to total assets ratio is 71% and in 2021 73% .
7.2.9.5 WACC
With all variables estimated the final value of WACC is 5.3%.
7.3 Methodology
In order to proceed with the actual valuation of Sumol+Compal an appropriate method had to be chosen. After a deep analysis on the company’s operations and financials it was easy to exclude some of the methods described previously in the literature review section. At first sight it was automatically excluded the dividend discount model, as the company does not follow a very strict payout policy and does not intend to distribute any dividends in a near future. If this method was used most probably would result in a share price much lower than the real value. Concerning Contingent Claim valuation models it would be accurate to use it if there was any information available to the public about future projects.
When excluding the methodologies above mentioned it becomes more evident that a DCF approach it is the one that best fits Sumol+Compal features as it is one of the models that gives a real perception of the company’s intrinsic value. A multiples valuation should also be considered as it can be seen as a proxy of the market, giving a different perspective when compared to the previous
34 mentioned models. Thus, in order to evaluate Sumol+Compal a DCF and Multiples, as a complement for the first one, approach was followed.
7.3.1 Discounted Cash Flow Model
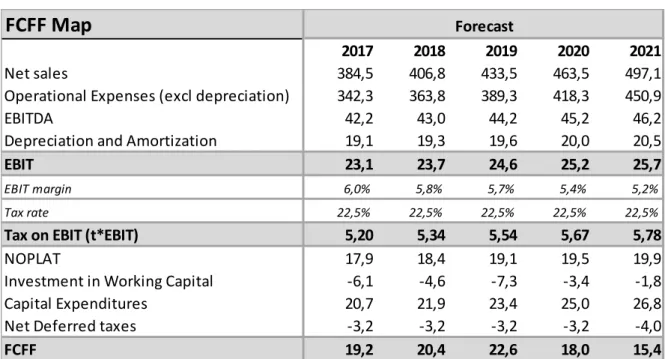
After all assumptions defined and forecasts made the first step into the actual valuation process is to calculate the free cash flows to the firm. These are computed by deducting from the EBIT the tax income, investment in working capital, capital expenditures, and adding to it the net deferred taxes and depreciations and amortizations.
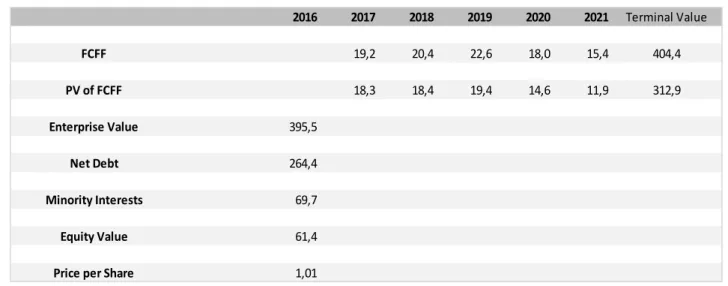
The second step is to derive the terminal value, which represents the company’s future value after the explicit period. It is calculated according to the Gordon growth model. Within this calculation it is necessary to estimate the growth rate, which was assumed to be equal to the sum of GDP growth (0.8% for 2016) with the inflation rate (0.6% for 2016), totalizing 1.4% (World Bank). For Sumol+Compal this value in 2021 amounted to 404.4million euros. The third step consists on discounting the cash flows and terminal value at the appropriate rate, in this case it is weighted average cost of capital. By summing all present values, the enterprise value is discovered, for the company in question it amounted to 395.5 million euros in 2016.
In order to calculate Sumol+Compal equity value it is deducted from the enterprise value the net debt and minority interests, in 2016 it amounted to 61.4 million euros corresponding to a share price of 1.01€. It is important to mention that this price corresponds to the close price of 2016 (30th
FCFF Map
2017 2018 2019 2020 2021
Net sales 384,5 406,8 433,5 463,5 497,1
Operational Expenses (excl depreciation) 342,3 363,8 389,3 418,3 450,9
EBITDA 42,2 43,0 44,2 45,2 46,2
Depreciation and Amortization 19,1 19,3 19,6 20,0 20,5
EBIT 23,1 23,7 24,6 25,2 25,7
EBIT margin 6,0% 5,8% 5,7% 5,4% 5,2%
Tax rate 22,5% 22,5% 22,5% 22,5% 22,5%
Tax on EBIT (t*EBIT) 5,20 5,34 5,54 5,67 5,78
NOPLAT 17,9 18,4 19,1 19,5 19,9
Investment in Working Capital -6,1 -4,6 -7,3 -3,4 -1,8
Capital Expenditures 20,7 21,9 23,4 25,0 26,8
Net Deferred taxes -3,2 -3,2 -3,2 -3,2 -4,0
FCFF 19,2 20,4 22,6 18,0 15,4
Forecast
35 2016 2017 2018 2019 2020 2021 19,2 20,4 22,6 18,0 15,4 18,3 18,4 19,4 14,6 11,9 395,5 264,4 69,7 61,4 1,01 FCFF PV of FCFF Terminal Value 404,4 312,9 Enterprise Value Net Debt Equity Value Price per Share Minority Interests
of December). This forecasted price is 48.5% below when compared to the one recorded in the homologous period, 1.96€.
´
7.3.1.1 Sensitivity Analysis
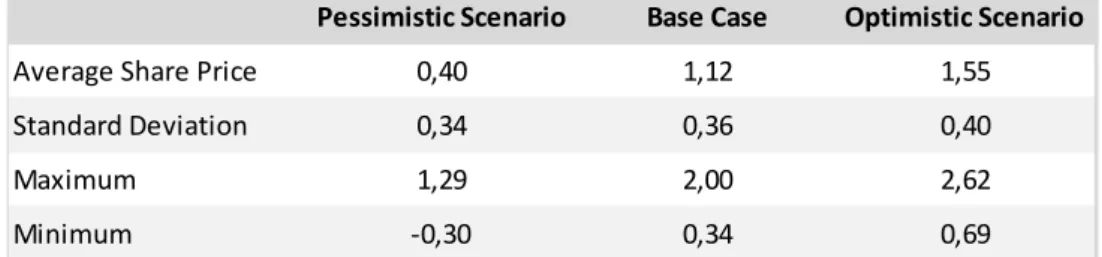
With the DCF valuation above described a share price is reached under certain assumptions. However, there is a lot of uncertainty regarding these assumptions that can strongly impact the final outcome. Therefore, it becomes necessary to develop a very detailed sensitivity analysis in order to capture the uncertainty around the assumptions defined and thus, reach a more precise share price.
In this sensitivity analysis three different scenarios regarding the estimation of sales and operational costs were studied. There is the base case scenario which is the one utilized in the DCF valuation method. This scenario served as benchmark to build the other two, the optimistic picture consists on an increase of both sales and operational costs by 4% and the pessimistic one consists on a decrease by the same percentage on both variables. The main focus of these alterations is to study the effect on the free cash flows available to the firm.
For each of these three scenarios a sensitivity analysis was also made regarding the cost of capital and growth rate. In similarity, it was also considered an optimistic and pessimistic scenario for these variables. For the optimistic scenario it was considered an increment in the growth rate of 0.3 percentage points and a decrease in WACC by the same amount. In reverse, for the pessimistic scenario it was considered an increment of 0.3 percentage points in the cost of capital and a decrease by the same amount in the growth rate.