www.ijera.com DOI: 10.9790/9622-07110XXXX 1 | P a g e
Data Center: Energetic and Economic Analysis of a More
Efficient Refrigeration System with Free Cooling and the avoided
CO
2Emissions
Clito Afonso
1(*), João Moreira
11
Department of Mechanical Engineering Portugal (DEMec), University of Porto, Portugal
ABSTRACT
The use of air conditioning equipment is becoming more frequent, and new technologies are emerging to increase the efficiency of the process and decrease the operating costs of air conditioning systems. In data centres, where electric power consumption is high and indoor cooling is a constant, the air conditioning systems are responsible for a large part of the building's energy consumption. In this work, a data centre with a twenty years old cooling system (with production of chilled water - CW), was analysed and is about to be replaced. In order to meet the thermal load of the building, two solutions were proposedwith a more efficient refrigeration system: one with production of chilled water (case 1) and another one with a direct expansion system (DX, case 2). It was also analysed the possibility to use free cooling in both of them. In both cases the results obtained shows a significant reduction on the energy consumption and consequently a reduction in the CO2 emissions, regarding the old system. An economic analysis was also carried and the conclusions were that they are profitable. The final decision is due to the customer.
Keywords: Free-Cooling, Energy Efficiency, Data Centre.
--- --- Date of Submission: 09-11-2017 Date of acceptance: 30-11-2017 --- ---
I. INTRODUCTION
Currently, energy is increasingly becoming a critical factor in the profitability of companies, services and industry. Energy efficiency is a priority for competitiveness and it is also here that rehabilitation will play a very important role. The investment in new buildings is being replaced by the investment and remodeling of the existing spaces with a view to future gains in the energetic invoice.
The Energy Efficiency Directive, [1], which aims to put Europe back on track to meet the 20% energy efficiency target by 2020, is one of the key pillars for reducing energy consumption. There is significant potential in service buildings because in these buildings energy consumption devoted to air conditioning is of greater importance than is the case in housing, and a relevant impact of the energy efficiency requirements of this sector is expected. In this, are the systems of processing of data. These emerged as a response to the need to have spaces with specific environments, with technical requirements for the placement of servers and data banks. The importance of this type of building is easily discernible in view of the evolution of telecommunication users, in particular the internet, [2-5].
Power consumption in this spaces is very high, largely due to the increase in server density.
Manufacturers are looking to help customers make the most of every square foot of data center space, and are now integrating more and more processors and more computing power than ever before. In fact, the density of a server has increased tenfold over the last decade and the server's average power consumption has quadrupled. Higher density results in higher operating temperatures and increase in energy and air conditioning requirements to avoid possible systems failure [6].
Indeed, the main challenge of the current data processing centers is the incredible amount of energy needed to keep them running. A center with 2000 m2 and an energy density of 1000 Wm-2 has a peak of air conditioning consumption which is comparable to an office building with an area of 20000 m2 and an annual total energy consumption comparable to an office building with an area of 40000 m2. Today, data-processing centers consume the equivalent of about 2% of total electricity. Estimates suggest at this point to a doubling of consumption in the next three to four years if current trends in the design and operation of data processing centers to continue [7].
The objective of this work is the study of new air conditioning systems for a data processing center, [8], to replace the existing one, with twenty years. It takes into account the determination of an optimization of energy in the level of the air
www.ijera.com DOI: 10.9790/9622-07110XXXX 2 | P a g e
conditioning components, through the use of freecooling systems leading to a higher energy efficiency of the building. As a consequence, it will result in lower operating costs for the new proposed air conditioning systems to be installed and consequently a reduction in greenhouse gas emissions. An economic analysis was also carried out.
II. CASE STUDY and METHODOLOGY
The building chosen for this work is located in Porto and is considered a PES (Small Building of Commerce and Services), since the useful interior area is less than 1000 m2, which will undergo a major intervention.
The building has an air conditioning system with more than 20 years, in which there are six units inside the room CRAC (Air handling units for computer rooms with the production of chilled water). These units are powered by two 110 kW chiller each. This equipment’s present a state of degradation quite advanced. The distribution network is made using black iron pipe properly insulated.
In order to correctly size the new air conditioning systems to be proposed, to make a comparison between them and to assess their advantages over the old one, to be replaced, the HAP software, [9], was used. It is a program that offers numerous options for designing AVAC systems for commercial buildings, and also has an enormous capacity to perform an energy analysis, regarding comparisons of consumption and operating costs between air conditioning systems. This program is widely used in energy efficiency
projects in buildings, due to its ability to simulate on an annual scale (8760 hours) taking into account local conditions. The calculation method used by the HAP is called the Transfer Function Method. For the evaluation of the thermal requirements of the building, to determine the required air conditioning equipment, the following data must be entered: characteristics of the surroundings, climatic conditions and local solar radiation, the utilization profiles, thermal proprieties of the external and internalenvelope and thermal inertia. All this information was available.
A said, for the replacement of the old equipment, two different systems were studied:
Case 1: CRAC units of type CW, with chiller for production of cold water;
Case 2: CRAC units of type DX. In this system the only difference for Case 1 is that there is no need for cold water production units since CRAC will be of type DX and as such will have its own refrigeration circuit.
Before simulating these two systems, it was necessary to know the information of the data centre billing, corresponding to the consumptions verified in the year 2015 (with the old system). The results are shown in Table 1, [7].
The thermal load of the building was simulated using the code HAP, [9],and it is of 305 490 W. In Table 1 it is displayed the annual consumption of each item in the data centre as well the annual cost of each solution proposed. For that it was considered an average cost of the electricity of 0.11€/kWh.
Table 1 – Data centre billing in the year 2015. Items Hourly consumption (kWh) Annual consumption (kWh/year)
Cost (€/year) Consumption percentage (%)
IT 105 919800 101178 58.3
Refrigeration 67 585920 64451 37.1 Lighting and others 28 72800 8008 4.6
Total 200 1578520 173637 100
The most commonly used metric to determine the energy efficiency of a data center is the power usage effectiveness, or PUE, equation 1, [4].It is the measure of how efficiently the data processing center uses energy, more specifically how much energy is used by IT equipment (information technologies) compared to the energy used in HVAC systems and other overheads.
𝑃𝑈𝐸 =𝑇𝑜𝑡𝑎𝑙 𝑒𝑛𝑒𝑟𝑔𝑦 𝐼𝑇 𝑒𝑛𝑒𝑟𝑔𝑦 (1) For the existing case the PUE is:
𝑃𝑈𝐸 = 1.71
This means that the facility uses 1.71 watts of total power for every watt delivered to IT equipment. The average data center in the US has a PUE of 2.0, [10].
III. ENERGETIC COMPARISION OF
THE TWO CASE STUDIES
There are some classifications for data centers, the most used being the Telecommunications Industry Association – TIA- accredited by ANSI (American National Standards Institute). It was published the standard ANSI/TIA-942, [2], which defined four levels of data centers,
www.ijera.com DOI: 10.9790/9622-07110XXXX 3 | P a g e
TIER levels,Tier Standard, [11]. In accordance withthe rating required in this case, Tier III, [11, 12], the air conditioning system of the data center mustinclude several cooling units with the cooling capacity to maintain the temperature and relative humidity in the space design conditions. It with have sufficient redundant units to allow service failure or an electrical panel. If these air conditioning units are supplied by an ice-water production system, the components of this system are also dimensioned to maintain the design conditions, with an electrical panel out of service. Regarding this standard, both cases will be analysed, as follow.
Case 1
Taking into account the energy needs of electricity, if an implementation of five (N) CRAC units is carried out, each one should have a capacity of 61 098 W of cooling power. However, considering the redundant systems, the installation must have 6 CRAC units (N + 1)
Thus, a set of CRAC units will be implemented within the room, which, in order to achieve the desired classification, must have a
double electrical supply, coming from two separate electrical panels, so that an electric panel can be put out of service without affecting the correct operation of the installation. The redundancy system must be at least N + 1, ie. a CRAC unit, with the installation in full operation, must be switched off in order to be used only in the event of another CRAC unit being put out of service.
Case 2
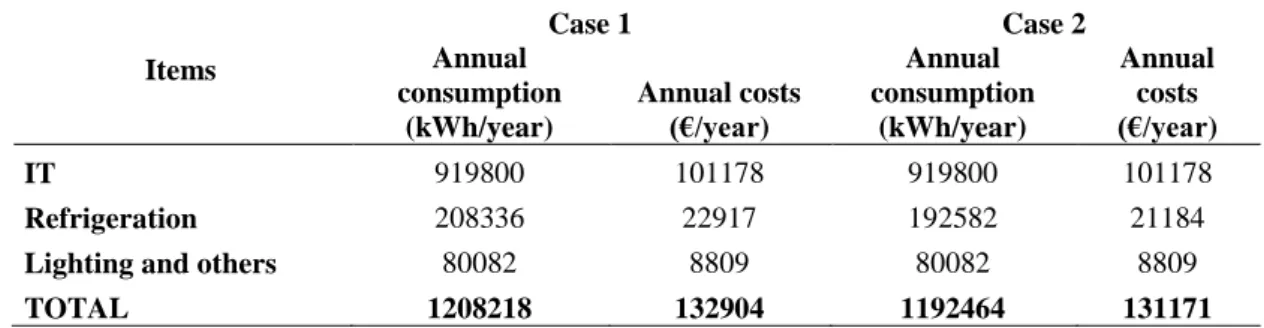
As in the previous case, six unitswill be installed. Each CRAC unit has a total thermal power of 66 kW, but also has two independent circuits of refrigerant, which means that each circuit will account for half of the total thermal power, ie. 33 kW. This particularity of the unit having two refrigerant fluid circuits, each one with a compressor, allows the unit to operate only with one circuit, thereby giving a greater modularity in terms of operating ranges and in case of rupture of the refrigerant tubing only half of the unit will be inoperative, the other circuit being fully operational. Table 2 shows a comparison between the results obtained through simulations for the two systems under consideration.
Table 2 - Comparison of the main parameters of the two case studies.
Items Case 1 Case 2 Annual consumption (kWh/year) Annual costs (€/year) Annual consumption (kWh/year) Annual costs (€/year) IT 919800 101178 919800 101178 Refrigeration 208336 22917 192582 21184 Lighting and others 80082 8809 80082 8809
TOTAL 1208218 132904 1192464 131171
It can be seen that there is a significant reduction in the annual energetic consumption of the new proposed refrigeration equipment’swhen compared with the old one. The results are displayed in Table 3.
Table 3 - Comparison of the main parameters of the two case studies. Case 1 370 366 kWh/ano
Case 2 386 056 kWh/ano The PUE value for case 1 is:
𝑃𝑈𝐸 =1208254
919800 = 1.31 For case 2 is:
𝑃𝑈𝐸 =1192464 919800 = 1.30 According to the end-user requirements,
the energy efficiency levels are achieved in both cases as the average annual PUE is less than 1.4. Also in case 1, the annual cost of electricity is € 132904. It is seen that there is a decrease of 41 534 € per year in relation to existing plant (see table 1), i.e., with this system one obtains a reduction of 64% compared to the current cost. It is this value that the
end user will save if they decide to deploy the installation 1.
In case 2, the annual cost of electricity is € 131171. There is a reduction of € 43267 per year in relation to the existing plant (see table 1), that is to say, this system achieves a reduction of 67% compared to the current cost. It is this value that the
www.ijera.com DOI: 10.9790/9622-07110XXXX 4 | P a g e
end user will save if they decide to deploy theinstallation 2.
IV. FREE COOLING
The Free Cooling (FC), [13, 14], in this particular case, can be implemented directly in the CRAC units. In case 1 one deals withfree water cooling and in case 2 with free air cooling, [3, 15].
Thetechnique of free air cooling can be implemented using a mixture of outdoor air and a recirculation system via an automatic air mixing system.Whenever the outdoor air is colder than indoor air, the amount of fresh air is increased and the amount of recirculated air is reduced to obtain the required air supply temperature. Thus, the cooling by refrigeration equipment is completely avoided at certain times of the year and often overnight.
In the case of free water cooling a CRAC unit of type CW,the main FC system must be applied in the chiller since this is the main producer of cold and as such, the one that consumes the most energy. Considering the unit's technical data sheet, [16], the airflow allowed by the fans is 14 840 m3h-1 and as such this will be the allowed flow per unit for the application of FC. In view of the First Law of Thermodynamics, [17]:
𝑄 𝑠𝐿 = 1.23 × 𝑉 × 𝑇𝑖− 𝑇𝑒 2
where:
𝑄 𝑠𝐿- Sensible gains [W]
𝑉 - Air flow rate [ls-1] Ti-Indoor air temperature [°C] Te-Outdoor air temperature [ºC]
Knowing the internal temperature, Ti, that is defined by the end user, 24ºC, and assuming that the six CRAC units of case 1 can operate in FC mode simultaneously, making a total of 89040 m3h-1 of available fresh air flow, the minimum air temperature to climatizethe space with FC is given from equation 1:
𝑇𝑒 = 15.29º𝐶
Observing the environmental conditions of the place where the installation is located, through [18], it is possible to verify that there are 5296 hours during the year when the outside temperature is lower than 15.29 ºC. So, in this installation, more than half of the year will be air-conditioned using the free-cooling system and the rest of the year the air conditioning will be made using the refrigeration equipment. Thus, the electric consumption of the refrigeration equipment will be reduced from the 208336kWh to 104168 kWh.
In case 2, the procedure for the determination of the FC system is similar to the previous one. However, the air flow rate of this CRAC unit is 20 000 m3h-1, [16]. Thus, for the same internal temperature of the data center, and through equation 2, the external temperature is:
𝑇𝑒= 17.53º𝐶
Therefore, observing the environmental conditions of the place where the installation is located, it is possible to verify that there are, during the year, 6566 hours when the outside temperature is below 17.53 ºC.
Thus, in this installation, about three quarters of the year will be air-conditioned using the FC system and in the rest of the year the air conditioning will be made using the refrigeration equipment. Thus, the electric consumption will be reduced.Thus, the electric consumption of the refrigeration equipment will be reduced from the 192582 kWh to 48146 kWh.
In both cases it was assumed constant weather conditions the year around.
V. ECONOMIC ANALYSIS
The determination and analysis of the profitability indices allow the user to quickly reach conclusions on the profitability of the investment projects, that is, it allows to verify if a certain investment is profitable or not.
For the determination of these indicators it is necessary to forecast the following variables, staggered in time when applicable:
• Costs of investments;
• Operating or operating revenues; • Operating or operating costs; • Economic life of the project; • Inflation rate;
• Interest rate.
Investment costs, revenues and operating costs are referred to as cash flow, which are the amounts received or expended by the user with the facility. Considering that there is currently an air-conditioning installation in the building under study, the maintenance costs will be the same for the new installation and as such will not be considered in this analysis.
For this specific case, a ten-year economic life with an inflation rate of 1% and an interest rate of 3% is defined for the project.
The indices of profitability are: Net Present Value (VAL)
The NPV aims to assess the feasibility of an investment project by calculating the present value of all its cash flows. Current value means the today value of a certain amount to be obtained in the future. Since any investment only generates cash flow in the future, it is necessary to update the value of each of these cash flows and to compare them with the value of the investment. In case the investment value is lower than the current value of the cash flows, the NPV is positive which means that the project has a positive profitability.
To update future cash flows, a rate is called the interest rate. This interest rate is no more than the
www.ijera.com DOI: 10.9790/9622-07110XXXX 5 | P a g e
rate that the user would have because of theopportunity cost of putting, for example, such amount of money in a savings (term deposit), to earn interest. The NPV is calculated by the following equation, [18, 19]: 𝑁𝑃𝑉 = 𝐹𝐶𝑡 (1 + 𝑖)𝑡 𝑛 𝑡=1 € (3) where:
FCt- Cash flow in year t;
t - Year in time when money will be invested; n-Number of years t;
i- Interest rate.
Internal Rate of Return (IRR)
IRR is the discount rate at which the present value of future cash flows equals the initial current investment, ie the discount rate at which cash flows are financially equivalent to investment costs. In summary, the IRR is the update rate for which the NPV is equal to zero:
𝑇𝐼𝑅 = 𝑖 ↔ 𝑉𝐴𝐿𝑖 = 0 (4)
This rate should be compared to the interest rate. If IRR is higher than the interest rate, the project is acceptable.
Return Of Investment (ROI)
The ROI is an index that represents the ratio between the amount earned as a result of an investment and the amount invested, ie in our case:
𝑅𝑂𝐼 =𝐸𝑛𝑒𝑟𝑔𝑒𝑡𝑖𝑐 𝑆𝑎𝑣𝑖𝑛𝑔𝑠 𝐼𝑛𝑣𝑒𝑠𝑡𝑚𝑒𝑛𝑡 𝑐𝑜𝑠𝑡𝑠 (5) Payback
This value is simply the inverse of the ROI and allows the calculation of the time needed to recover the invested capital.
Due to the variation in price of goods and services, it is necessary to update the cash flow because it will be higher since the unit price of energy will also be. This rate will be considered 1% per year. Therefore, cash flow will follow equation 6:
𝐹𝐶𝑡𝑅= 𝐹𝐶𝑡−1𝑅 × 1+∝ € (6) where: 𝐹𝐶 𝑡𝑅− 𝐴𝑐𝑡𝑢𝑎𝑙 𝑐𝑎𝑠 𝑓𝑙𝑜𝑤 𝑖𝑛 𝑦𝑒𝑎𝑟 𝑡; 𝐹𝐶 𝑡−1𝑅 − 𝐴𝑐𝑡𝑢𝑎𝑙 𝑐𝑎𝑠 𝑓𝑙𝑜𝑤 𝑖𝑛 𝑡𝑒 𝑝𝑟𝑒𝑣𝑖𝑜𝑢𝑠 𝑦𝑒𝑎𝑟 𝑡 − 1; ∝ − 𝐼𝑛𝑓𝑙𝑎𝑡𝑖𝑜𝑛 𝑟𝑎𝑡𝑒.
VI. ECONOMIC COMPARISON OF THE
TWO CASE STUDIES
With the equations 3 to 6 an economic comparison of the two cases studies have been done and the results are summarized in Table 4.
Table 4–Economic comparison of the two case studies. Initial cost Annual
savings
VAL TIR ROI Payback
Case 1 355 122.78€ 41 534€ 18 346.74€ 4% 12% 8.1 Case 2 273 581.52€ 43 267€ 115 470.96€ 10% 17% 6.1 From the above table, it is verified that for case 1,
the NPV is positive and as such the investment is profitable, the IRR has a rate of 4%, which is higher than the 3% interest rate, making this project acceptable. In addition, the investment made is made at a rate of 12% per year, and the initial investment will be fully recovered at 8.1 years of operation.
For case 2 the NPV is positive and as such the investment is profitable, the IRR has a rate of 10%, which is higher than the 3% interest rate, making this project acceptable. In addition, the investment is made at a rate of 17% per annum, and the initial investment will be fully recovered at 6.1 years of operation.
So, it is possible to conclude thatcase 2 is economically the most favourable in all respects. It
has a lower initial investment and a larger savings account, that is translated into a higher IRR and a lower Payback.
VII.
AVOIDED EMISSIONS OF CO
2IN
THE TWO CASE STUDIES
In both cases there is a reduction in electrical energy consumption regarding the actual refrigeration system and, as such, there is a decrease of CO2emissions to the atmosphere.
Each year, the Energy Services Regulatory Agency, [20], publishes the CO2 emission factors to be used for the determination of specific emissions. This publication is based on the most recent information on the electricity generation facilities of the Iberian Peninsula, Table 5.
Table 5 – CO2 emissions factors. Emission factor of CO2 (g/kWh) Year Hydri c Win d Renewable cogeneratio n Othersrenewa ble Solid urban waste Fossil cogeneratio n Natural gas Coal Nuclea r 2015 0 0 0 0 841 327 354 980 0
www.ijera.com DOI: 10.9790/9622-07110XXXX 6 | P a g e
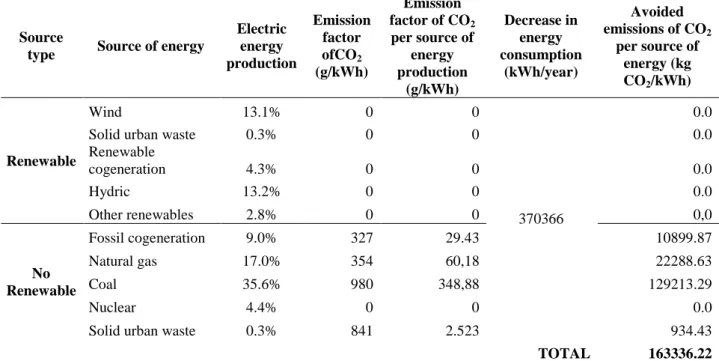
According to the data of the year 2015, theproduction of electricity was distributed taking into account the type of energy source. Table 6 shows that distribution as well as the avoided emissions of CO2 for case 1, taking in account table 3.
For case 2 the calculations are similar. Table 7 displays the comparison of the avoided CO2 emissions in both cases.
Table 7 - Comparison of the main economic parameters of the two case studies. Avoided emissions of CO2 (ton) Case 1 163 Case 2 170
Table 6–Avoided CO2 emissions per source type in case 1.
Source
type Source of energy
Electric energy production Emission factor ofCO2 (g/kWh) Emission factor of CO2 per source of energy production (g/kWh) Decrease in energy consumption (kWh/year) Avoided emissions of CO2 per source of energy (kg CO2/kWh) Renewable Wind 13.1% 0 0 370366 0.0
Solid urban waste 0.3% 0 0 0.0
Renewable cogeneration 4.3% 0 0 0.0 Hydric 13.2% 0 0 0.0 Other renewables 2.8% 0 0 0,0 No Renewable Fossil cogeneration 9.0% 327 29.43 10899.87 Natural gas 17.0% 354 60,18 22288.63 Coal 35.6% 980 348,88 129213.29 Nuclear 4.4% 0 0 0.0
Solid urban waste 0.3% 841 2.523 934.43
TOTAL 163336.22
VIII. CONCLUSIONS
In this work a data centre was analysed regarding the refrigeration system used, that is twenty years old, with production of chilled water. Two alternative solutions were studied in order to replace the existing one: the first with a more efficient refrigeration system with production of chilled water (case 1) and second one, also more efficient with a direct expansion system (DX, case 2). It was analysed both cases regarding the energetic
efficiency, economics aspects as well as avoided CO2 emissions.
The solution of case 1 uses CRAC units of type CW, consisting of air-water chiller. In the case 2 the solution uses CRAC units DX type. These units are autonomous and independentand are operated in a stand-alone type system.
Both cases were sized with saving modules, implemented in the CRAC units in order to take advantage of free cooling by introducing cooler outside air, leading to a saving in operating costs. A summary of both cases is shown in Table 8. Table 8 - Comparison ofthe two case studies.
Investment costs Annual
savings Payback(years)
Avoided CO2emissions (ton)
Case 1 355 122.78€ 41 534€ 8.1 163 Case 2 273 581.52€ 43 267€ 6 170
www.ijera.com DOI: 10.9790/9622-07110XXXX 7 | P a g e
From the analysis of the shown tables it is possibleto conclude that case 2 is the best implementation at all levels.
Despite the previous analysis, it will always be the end user to decide which solution to implement.
REFERENCES
[1]. Mellár, B. European Parlament. 10/2016,
Energetic Efficiency.2016:
http://www.europarl.europa.eu/atyourservice/ pt/displayFtu.html?ftuId=FTU_5.7.3.html .2016.
[2]. Telecommunications Industry Association - TIA. Telecommunications Infrastructure Standard for Data Centers. 2005.
[3]. ASHRAE®, ANSI/ASHRAE/IESNA 09.1-2004.
[4]. The Green Grid, PUE: A comprehensive examination of teh metric,2012. https://www.thegreengrid.org/en/resources/lib rary-and-tools/20-PUE:-A-Comprehensive-Examination-of-the-Metric.
[5]. Txapartegi, M., Mounier, E., Data CenterTechnoogies, New Technologies and Architectures for Efficient Data Center: http://www.imicronews.com/images/Flyers/P ower/Yole New Technologies and Architectures for Efficient Data Centers Flyer web.pdf. 2016.
[6]. Hewlett-Packard Portugal, Lda,Energetic Efficiency of data Centers in Public Administration in Portugal. 2010.
[7]. Moreira, J. Energy optimization in the air conditioning system of a data center, including the use of free cooling system. MSc. Thesis. FEUP editions, 2016.
[8]. Evans, T. The different Technologies for Cooling Data Centers. Schneider Electric. White paper 59. 2016.
[9]. CARRIER, HAP e-Help.
http://www.ahicarrier.gr/en/downloads/hourly -analysis-program/hap-e-help/. 2005
[10]. U.S. Environmental Protection Agency ENERGY STAR Program. Report to Congress on Server and Data Center Energy Efficiency. Public Law 109-431.2007. [11]. Turner, W. Seader, J., Renaud, V. Data
Center Site Infrastructure Tier Standard: Topology. Uptime Institute. 2009.
[12]. U.S. Environmental Protection Agency ENERGY STAR Program. Report to Congress on Server and Data Center Energy Efficiency. Public Law 109-431.2007. [13]. ASHRAE Technical Committee (TC 9.9)
Mission Critical Facilities, Data Centers, Technology Spaces, and Electronic Equipment, Data Center Networking Equipment – Issues and Best Practices. 2009. [14]. Petshchke, P. Free Cooling for Data Centers.
STULZGmbh. 2015.
[15]. Zhang,H., Shao, S., Xu, H., Zou, H., Tian, C. Free cooling of data centers: A review. Renewable and Sustainable Energy Reviews. V.35. 2014.
[16]. Liescheudt, S. Economizers in Air Handling Systems.
https://www.scribd.com/document/17449710 7/Economizers-in-Air-Handlinair-handlersg-Systems. 2017.
[17]. STULZ, www.stulz.com. 2018.
[18]. Afonso, C. Thermodynamics for Engineers. FEUP editions. ISBN.978-972-752-143-2. 2012.
[19]. National Laboratory of Energy and Geology.
Solterm, 5.1
http://solterm.software.informer.com/5.1/ 2015.
[20]. Megre, L., Analysis of investment projects - An economic perspective, 1st Edition Sílabo Editions, 2013.
[21]. Afonso, C., Rocha, C. Evaluation of the economic viability of the application of a trigeneration system in a small hotel. Futures Cities and Environment. DOI 10.1186/s40984-016-0017-z, 1-9, 2016. [22]. Afonso, C. Moutinho, T. Energetic,
Economical Analysis and Avoided CO2 Emissions in a Cogeneration System Regarding the Legislation. International Journal of Mechanical Engineering and Automation 1 (2014).
[23]. Energy Services Regulatory Agency.
http://www.erse.pt/pt/desempenhoambiental/r otulagemenergetica/Paginas/default.aspx .2017.