Universidade de Évora - Escola de Ciências e Tecnologia
Universidade de Lisboa - Instituto Superior de Agronomia
Mestrado em Gestão e Conservação de Recursos Naturais
Dissertação
Evaluation of an ecosystem service in restored quarry areas:
pollination
Carolina Maria Coelho de Almeida Carvalho
Orientador(es) | Amália Maria Marques Espiridião de Oliveira
Pedro Alexandre Marques da Silva Salgueiro
A dissertação foi objeto de apreciação e discussão pública pelo seguinte júri nomeado pelo
Diretor da Escola de Ciências e Tecnologia:
• Presidente | Pedro R. Almeida (Universidade de Évora)
• Vogal | Diogo Figueiredo (Universidade de Évora)
•
Vogal-orientador | Amália Maria Marques Espiridião de Oliveira (Universidade de
Évora)
IV Agradecimentos
Esta dissertação foi realizada no âmbito do projeto “ESTUDO E VALORIZAÇÃO DA BIODIVERSIDADE – COMPONENTE DA FAUNA – NA PROPRIEDADE SECIL-OUTÃO, 5ª FASE”, pelo que agradeço a todos os intervenientes no projeto (Alexandra Silva, António Mira, Amália Oliveira, Pedro Salgueiro Elsa Caeiro, Carmo Silva, Ana Sampaio, Vânia Salgueiro e Otília Miralto), e em especial à SECIL, Companhia Geral de Cal e Cimento, S.A., por todo o apoio disponibilizado a nível logístico e de cedência dos dados.
O meu primeiro agradecimento vai para os meus orientadores, Amália Oliveira e Pedro Salgueiro, que me apoiaram e aconselharam durante todas as fases de desenvolvimento desta tese, e sem os quais este trabalho não existiria. Foram incansáveis, e não poderia ter pedido nem imaginado orientadores melhores.
Agradeço também à Elsa Caeiro pelo apoio no laboratório de palinologia; à Ana Sampaio, Vânia Salgueiro e Marta Parrinha pela ajuda no trabalho de campo; à Otília Miralto e ao Jorge Almeida pela ajuda na identificação de insetos; à Carmo Silva por toda a ajuda logística; e a toda a equipa da UBC pelo acolhimento e pela paciência.
Agradeço ainda ao Instituto da Conservação da Natureza e das Florestas, Direção Regional de Conservação da Natureza e Florestas de Lisboa e Vale do Tejo - Parque Natural da Arrábida, em especial à Dra. Ana Sofia Palma, pela disponibilidade e ajuda prestada no fornecimento de informação sobre o PNA e aquisição das licenças de captura para a execução deste trabalho.
Um obrigada também à Cláudia, ao Rogério, à Catarina e ao João, pela companhia e distração durante os almoços na Mitra.
E por último, aos meus pais, que me seguraram quando vacilei, sem eles também não teria sido possível.
V Evaluation of an ecosystem service in restored quarry areas: pollination
ABSTRACT
Ecological restoration allows for accelerated recovery of a degraded ecosystem’s biodiversity, function, and ability to provide ecosystem services. However, the issues of when active restoration is necessary and how restoration effectiveness should be measured are still subject to considerable debate. Here we evaluate plant-pollinator networks in actively and passively restored quarries, comparing structure and composition to a natural area representing the reference ecosystem, to determine which restoration approach holds higher effectiveness on the rehabilitation of this ecological process. We found that while both approaches allowed for the restoration of pollination function, active restoration allowed for faster recovery. Nevertheless, the distinct strategies generated key structural vegetation differences, which influenced distinct pollinator communities providing the service in different areas. These results support the idea that restoration might be attained by distinct biological communities, and that both composition and function should be taken into account when evaluating restoration outcomes.
VI Avaliação de um serviço de ecossistema em áreas restauradas de pedreira: polinização
RESUMO
O restauro ecológico permite acelerar a recuperação da biodiversidade, função e serviços de um ecossistema degradado. No entanto, existe bastante debate sobre as situações em que é realmente necessário o restauro ativo e como deve ser avaliado. Neste estudo, avaliamos redes planta-polinizador em pedreiras restauradas ativamente e passivamente, comparando a sua estrutura e composição com uma área natural que representa o ecossistema de referência, para determinar a abordagem mais eficiente na reabilitação da polinização. Verificámos que, apesar de ambas permitirem o restauro desta função, o restauro ativo permite uma recuperação mais rápida. No entanto, estratégias distintas geraram diferenças estruturais na vegetação, o que influenciou o estabelecimento de comunidades de polinizadores distintas a polinizar as diferentes áreas. Estes resultados apoiam a ideia de que o restauro pode ser atingido com comunidades biológicas distintas, e que a composição e a função devem ambas ser tidas em conta na avaliação do restauro ecológico.
VII INDEX
Introduction ……….……… 1
Materials and Methods ………. 4
Study Area ……….………. 4
Field Methods ……….. 6
Laboratory Methods ………..…………. 7
Data Analysis ………..……….. 8
Results ……… 11
Network level analysis ………..…….. 16
Species level analysis ………. 18
Discussion ……… 21
Effects of restoration strategy on network structure ……..………..…… 21
Pollinator community: composition vs function ………. 24
Implications for restoration management ……….…… 27
References ………. 29
Annexes Annex I – Flowering period for the most relevant plant species present on site ………….….. 34
Annex II – Summary description of network metrics calculated in this study ………..…. 35
Annex III – List of plant groups whose pollen was carried by pollinators in this study …..…. 36
Annex IV – List of insect groups captured in this study ……….… 38
Annex V – List of bee species and groups included in the Wild Bees group for species level analysis ……….…… 44
Annex VI – Temporal trends in resource availability ………....…. 45
VIII FIGURE INDEX
Figure 1 – Map of the study area, representing sampling sites and their surrounding land uses …… 6
Figure 2 – Pollination networks incorporating all pollen transport data collected for each area (all months and sites) ……….. 12
Figure 3 – Number of individuals captured for the most overall abundant pollinator groups ………. 13
Figure 4 – Results of CCA analysis (first and second components) ……….. 15
Figure 5 – Bray-Curtis dissimilarity between sites ……… 16
Figure 6 – Temporal trends of each network metric for the different areas ………. 18
Figure 7 – Temporal trends of bee group abundances for the different areas ……… 19
Figure 8 – Summary of species level metrics calculated for each bee group in each area ……… 20
Figure 9 – Regression line representing the inverse relationship found between honey bee and wild bee abundance ………. 21
IX TABLE INDEX
Table 1 - Summary table of insect groups, pollinator groups, plant species, and distinct interactions observed in each area type……….11
1 Introduction
Resource extraction is considered amongst the most harmful activities, responsible for losses of more than 80% of biodiversity (Oberle et al., 2019). Open-air quarry exploration in particular leaves large areas entirely devoid of vegetation, with serious impacts for local fauna, and the removal of soil makes its recovery particularly difficult (Germano, Lopes, Pinto-Gomes, Pedro-Santos, & Martins, 2014). Ecological restoration rises as an opportunity to accelerate the recovery of an ecosystem that has been degraded, damaged, transformed or entirely destroyed as a direct or indirect consequence of human activities (Clewell et al., 2004). Generally, the intent of ecological restoration activities is to allow these degraded ecosystems to regain biodiversity, function, and their ability to provide ecosystem services (Benayas, Newton, Diaz, & Bullock, 2009). However, the issue of whether active restoration is always necessary is still a subject of considerable debate (Holl & Aide, 2010). Active restoration often involves the application of technical reclamation, while passive restoration relies on spontaneous succession (Prach & Hobbs, 2008). The last approach is much slower, especially in highly damaged sites such as quarries, but provides early successional heterogeneous surfaces with extreme abiotic conditions and minimum productivity(Tropek et al., 2010). Passive restoration can therefore create refugia for distinct taxa of conservation concern that thrive spontaneously in these sites (Tropek et al., 2010; Williams, 2011). There are also many examples where active restoration can slow or redirect recovery, and many others where passive restoration can be effective over large areas and enhance α and β diversity (Holl & Aide, 2010), while requiring a much lower investment of funds (Prach & Hobbs, 2008).
However, assessing restoration effectiveness depends on how it is measured. Restoration objectives and their evaluation usually address community composition (Ruiz-Jaen & Aide, 2005), but the focus has been changing towards functional and stability indicators (Montoya, Rogers, & Memmott, 2012; Shackelford et al., 2013). Compositional restoration traditionally focuses on the measures of species diversity that include only information on the presence and/or abundance of species (Cadotte,
2 Carscadden, & Mirotchnick, 2011). There are evidences that although post-restoration species assemblages can be quite distinct from the original pre-restoration state, they can still provide ecosystem services with as much efficiency as natural undisturbed communities in similar conditions (Denning & Foster, 2017; Forup & Memmott, 2005; Williams, 2011). Thus, attending functional goals instead of compositional ones has been largely defended as a more appropriate approach in certain contexts, such as restoration after mineral exploration and mining (Shackelford et al., 2013). It has been argued that interactions describing ecological function and ecosystem services can be a much better indicator of the richness and diversity of ecosystem functions than lists of species and respective abundances (Jordano, 2016). However, the majority of restoration projects fail to take species interactions into consideration in planning, implementation and evaluation of restoration actions (Kaiser-Bunbury, Traveset, & Hansen, 2009). In addition, ecological interactions might be lost at a higher rate than species become extinct, greatly affecting these same ecosystem services (Kaiser-Bunbury et al., 2009; Valiente-Banuet et al., 2015). Mutualistic interactions in particular have been pointed out as good candidates for success evaluation and definition of restoration targets (Kaiser-Bunbury et al., 2009).
Pollination is among the most well-studied mutualistic interactions, due to the importance of the service it represents (Goldstein & Zych, 2016). Pollination is vital for the maintenance of both wild plant communities and agricultural productivity (Potts et al., 2010). It is estimated that close to 90% of flowering plant species depend on pollinators, and it has been demonstrated that pollination influences seed viability, fruit production and genetic variability of plant populations through cross-fertilization (Cusser & Goodell, 2013; Forup, Henson, Craze, & Memmott, 2008; Menz et al., 2011). Pollination services depend on both domesticated and wild pollinator populations, but it is estimated that 85% of pollination services are provided by wild pollinators. Among all pollinator groups, insects (bees in particular) are the primary pollinators (Potts et al., 2010). Despite their importance, pollinator communities are in decline, endangering both the plant communities that depend on them and the ecosystem services they mediate as well (Christmann, 2019). Thus, such a
3 critical service should be restored for an ecosystem to be considered fully functional. Failure to promote and manage this service could lead to decline or collapse in ecological restoration (Menz et al., 2011).
Recently, some relatively quick and cost-efficient methods to evaluate pollination interactions are being advocated (Montoya et al., 2012). For instance, ecological networks allow us to represent and assess different aspects of interactions between living organisms, both analytically and visually (Pocock et al., 2016). Network representations allow for the calculation of several network-level and species-level metrics, which characterize different aspects of network and species behavior, respectively (Kaiser-Bunbury & Blüthgen, 2015). The potential usefulness of network-level metrics as indicators for evaluation of ecological restoration outcomes has been widely pointed out, but few studies have indeed applied it to empirical restoration projects (Menz et al., 2011). For instance, network-level metrics can be used to compare the overall functioning of community interactions in sites of distinct restoration status (Kaiser-Bunbury et al., 2017) while species-level metrics can have an important role in the identification of critical species (Cagua, Wootton, & Stouffer, 2019; Olesen, Bascompte, Dupont, & Jordano, 2007) and advise future restoration actions.
In this study, we will evaluate plant-pollinator networks in actively and passively restored quarries. We will compare both structure and composition of these networks while comparing to a natural area representing the reference ecosystem. Ultimately, we intend to determine which approach (active vs passive restoration) holds higher effectiveness on the rehabilitation of this ecological process. In a highly seasonal environment such as Mediterranean landscapes, where available resources vary highly along time, we will assess insect pollinator communities and pollination function during the most significant flowering period – spring.
Since active restoration aims at improving habitat condition of degraded sites more rapidly, we expect to find higher similarity between the network structure of actively restored and natural sites. We envision that network structure will vary mostly along sampling sessions according to resource
4 availability, and to a lesser extent between areas, from which passively restored sites may differ the most. We also expect that vegetation cover will mediate distinct species composition providing the service in different areas, and propose that species occurring in all areas might behave differently.
Materials and Methods Study Area
Our study was carried out within the protected area of Arrábida Natural Park, Setúbal, Portugal. The park owes its name to the most prominent geomorphological unit of the area, the Arrábida mountain range. The mountain range has an ENE-WSW orientation, with a length of 35 km, an average width of 6 km and reaching 501 m at its highest point. The terrestrial portion of the park encompasses also an area of plains north of the mountain range and a rocky shore facing the Atlantic Ocean (ICNF, n.d.).
The area presents strong Mediterranean characteristics, with two extreme seasons: a hot dry summer with temperatures close to those of tropical regions and prolonged drought periods that can last for several months, and a humid cold winter. The proximity to the Atlantic Ocean influences the prevailing Mediterranean climate, diminishing the thermal amplitude and causing a particular increase in humidity in the winter (ICNF, n.d.). These conditions have favored the development of highly valued natural habitats, such as the Mediterranean maquis. The maquis is a typical Mediterranean shrubland habitat, mainly composed of a dense perennial shrub layer, with very sparse herbaceous vegetation and rocky limestone outcrops. Important species include Cistus
albidus, Cistus ladanifer, Ulex densus, Quercus coccifera, Rhamnus alaternus and Arbutus unedo
(Freire et al., 1996).
Due to its limestone rich substrate, extractive industry has had a strong presence in the area for a long time, with an overall area of about 300 ha where exploration has been authorized (Freire et al.,
5 1996). Since the decade of 1980, legislation requires that quarries that are no longer under exploration be subjected to active ecological restoration. Nevertheless, there are several quarries within the park that were deactivated prior to this legislation and where all restoration takes place passively by natural processes.
We defined three areas within the mountain range that comprised: (1) a natural reference ecosystem (natural area), (2) an actively restored quarry (restored area) and (3) a passively restored quarry (abandoned area). The natural reference ecosystem presents the typical Mediterranean characteristics outlined above, i.e., a dense shrub maquis. The restored area is located within an active quarrying site owned by SECIL, Companhia Geral de Cal e Cimento, S.A., since 1904. The licensed quarrying area extends for about 99 ha, of which 44 ha are currently under restoration. Limestone extraction activities took place from top to bottom, leaving a series of 10-meter large benches separated about 20 meters apart in height. Several practices aiming to restore these benches have been under way since early 1980, mainly involving the reintroduction of substrate, hydroseeding of herbaceous and shrub vegetation and later planting. Besides local native vegetation, the plantation of a naturalized species (the Aleppo pine – Pinus halepensis) was adopted, resulting in dense pine-tree cover. This species creates an arboreal layer absent from natural areas that produces shade and promotes a less dense shrub layer (Nunes, Cabral, Branquinho, & Correia, 2014). The abandoned area consists of three closely located, smaller quarries (about 2.8 ha each) which were deactivated in 1982 (Esteves, 2015). Exploration was discontinued but no actions were undertaken except for the removal of the extractive activity and infrastructure. Therefore, soil and vegetation establishment has occurred gradually without intervention, following natural processes. The vegetation structure is also very distinct from both other areas, being in general sparser, with a much lower vegetation cover and representing an early successional stage after disturbance. Both the abandoned and restored area are surrounded by the same type of Mediterranean maquis found in the natural area.
6 Field Methods
We established three sampling sites (spatial replicates) in each area (Figure 1). Adjacent sites were separated by a minimum of 250 m to guarantee independence. This distance is above the mean distance (130 m) for successful pollen transfer among insect-pollinated plant species in urban habitats (Geert, Rossum, & Triest, 2010; Martins, Gonzalez, & Lechowicz, 2017).
Figure 1 - Map of the study area, representing sampling sites and their surrounding land uses.
At each site, a 150 m transect was walked by two researchers during 30 minutes. Each transect was surveyed twice in a day (once in the morning period and again in the afternoon) in order to avoid any bias from pollinators’ daily activity patterns. Each survey, with the duration of 3 days (one dedicated to each area), took place once per month, during four months, between February and May 2019, and with an interval of a minimum of three weeks in-between sampling sessions. Each transect was thus sampled for a total of 4 hours during the whole sampling period. This period
7 covered the majority of the flowering period for most relevant flowering species present on site (Annex I). Surveys only took place in days with favorable conditions for pollinator activity, such as dry weather, low nebulosity and low to moderate wind speed (Cusser & Goodell, 2013; Forup & Memmott, 2005). Insects were collected using entomological nets and collection jars while visiting or hoovering over flowers, stored in individual tubes to avoid pollen contamination, and frozen until handling in the laboratory.
Regarding vegetation, we set 10 (50x50 cm) quadrat points along each transect, 15 meters apart and on alternate sides of the transect to sample floral availability and vegetation cover. Floral availability was sampled on each survey by counting floral units inside each quadrat. Floral units were either flowers or compact inflorescences, defined as being different entities if a pollinator would be required to fly in order to move from one entity to the next (Timóteo et al., 2018). Samples of flowers observed on each transect were also collected each month for pollen harvesting, being kept in individual paper bags. Vegetation cover for all layers of vegetation and for bare soil was estimated in a single survey (June), using a sampling area of 100x100 cm centered in each quadrat point.
Laboratory methods
Pollen was harvested from the anthers of flowers collected in the field and stained with melted fuchsin gel. Microscope slides were sealed and all the samples compiled into a pollen reference collection.
For the extraction of pollen from individual insects, a coverslip-sized area of the microscope slide was lightly covered in Vaseline. The whole surface of the insect body was then rubbed on this surface, avoiding only specialized pollen transport structures in the case of bees, since the pollen carried in these structures is unlikely to be available for pollination (Alarcón, 2010; Forup & Memmott, 2005). Tweezers used to handle the insects were sterilized with alcohol in between
8 handling each individual in order to avoid pollen contamination. Pollen slides were stained with a drop of melted fuchsin gel, allowing 24 hours for the color to settle before observation and identification under light microscopy. Grains were counted and identified through comparison to the pollen reference collection compiled. All grains present in each slide were counted but only species containing 5 or more occurrences per slide were considered for network analyses, in order to prevent any possible contamination bias (Forup et al., 2008; Forup & Memmott, 2005). Insects and pollen grains were identified to the lowest possible taxonomic level. Most pollen grains were identified to species level, with exception of genera Allium and Carduus, as well as some grains belonging to unidentified species of Asteraceae and Poaceae. Of all Cistus species found on site, only
Cistus crispus was readily distinguishable from the others, so it was considered separately. Grains
belonging to other Cistus species were pooled together into a species complex including C. albidus,
C. monspeliesis, C. salviifolius, and C. ladanifer. Insect identification was accomplished through the
employ of identification keys (Baldock, Wood, Cross, & Smit, 2018; Barrientos (ed.) et al., 2004; Bogusch & Straka, 2012; Coe, 1953; Collins, 2012; Hackston, n.d., 2019; Hackston & Lompe, 2013; Kasparek, 2019; Ortiz-Sánchez, 1997; Scheuchl, n.d.; Smit, 2018; Unwin, 1984), field guides (Chinery, 2012; Garcia-Pereira et al., 2019) and with the aid of specialists. Insects were grouped according to the lowest taxonomic level to which they were identified, discriminated in Annex III.
Data Analysis
Firstly, we compared the composition of pollinator communities by calculating Bray-Curtis dissimilarity between sites. We performed a constrained correspondence analysis (CCA) in order to assess compositional differences between space (sites) and time (months). The CCA was performed using a species matrix representing the pollinator communities for each site and month, constrained by a matrix of vegetation structure variables (herbaceous cover, shrub cover, arboreal cover, bare soil cover and total number of floral units). Since communities are expected to vary between
9 months, we partialled out this effect by adding a condition to the ordination model. The model variables were chosen taking into account the structural characteristics that most differentiated the distinct areas.
Afterwards, we used the pollen transport data to build quantitative pollination networks. While the use of visitation networks is more generalized, pollen analysis provides a record of extended visitation history, rather than a snapshot of a single interaction (Bosch, González, Rodrigo, & Navarro, 2009). Since not all visitors effectively transfer or even transport pollen (Alarcón, 2010; Ballantyne et al., 2015), pollen-based networks are generally more accurate and may reveal structural characteristics hidden under visitation analysis. Pollen analysis also allows for the detection of links involving rare species, that would require very long observation periods to be recorded (Bosch et al., 2009). The measure used to quantify each interaction between a plant species and an insect group in the network was the total number of pollen grains of that plant species carried by all individuals of that particular insect group. A network was constructed for each site in each sampling session, totaling 36 networks.
To explore differences between networks in the different areas, several metrics were calculated, both at network and species level. At network level, the metrics used were interaction strength asymmetry (ISA), linkage density, interaction evenness, specialization asymmetry (SA), Shannon diversity of interaction, H2 (a measure of specialization for the whole network), number of pollinator groups, number of plant species, robustness of the insect community to plant extinction, robustness of the plant community to insect extinction and modularity (metric descriptions are provided in Annex II). These metrics were calculated for each of the 36 networks and then compared using linear mixed models with two fixed factors, area type (abandoned, natural and restored), month, and their interaction. The natural area values were set as reference for comparison. Since the structure of our data consists on a repeated measures approach, site was considered as a random factor in the models, thus controlling for possible site-related effects.
10 We further investigated the roles of the most relevant pollinators in the networks. The most relevant pollinators were determined taking into account pollinator abundance and amount of pollen transported. We measured the abundance of each of these groups for each of the 36 networks, and compared it across areas and months using a methodology similar to that used for network level metrics. Species level metrics for each group were calculated from global networks combining data of the four months for each site, totaling nine networks. Monthly networks include only flower resources available at a particular time, disregarding possible interactions of the same insect group with different plants whose flowering period does not overlap in time. Calculation of specialization-related species metrics should be more accurate when performed on these global networks that include all species interactions for each insect group. We calculated the following metrics for each pollinator group: species strength (which in this case represents group strength), pollination service index (PSI), partner diversity and Blüthgen’s d (metric descriptions are provided in Annex II). The values were then compared using a generalized linear model, this time taking into account only the area as a fixed factor.
We finally investigated any possible relationship between the abundance of the most relevant pollinator groups. For that purpose we measured the niche overlap using Pianka’s measure of niche overlap, which returns a symmetric measure of overlap that is preferred to other overlap measures (Krebs, 2014), and applied a linear regression in order to determine possible replacement between groups.
All the analyses were performed in R 3.5.2. (R Core Team, 2018). Package bipartite (Dormann, Gruber, & Fruend, 2008) was used to build networks and obtain values for network level and species level metrics, package nlme (Pinheiro, Bates, DebRoy, Sarkar & R Core Team, 2019) was used to construct linear models and compare the metrics, package vegan (Oksanen et al., 2018) was used to perform constrained correspondence analysis and calculate Bray-Curtis dissimilarity and spaa package (Zhang, 2016) was used to calculate niche overlap.
11 Results
A total of 1513 insects were captured, of which 679 (44.35%) insect individuals carried pollen from 35 plant species (Annex III). Overall, we obtained 269 distinct interactions between different species pairs. The plant species benefitting from largest pollen transport were Rosmarinus officinalis, the
Cistus species complex and Rubus ulmifolius. While Rosmarinus officinalis and Cistus spp. are
common to all areas, Rubus ulmifolius appears mostly in the abandoned area, being completely absent from the natural area and nearly so in the restored area. The insects belonged to 167 groups (Annex IV), of which 93 were found carrying pollen in at least one occasion. Richness of groups and interactions is evenly balanced across different areas, being slightly lower in natural areas (Table 1 and Figure 2).
Table 1 – Summary table of insect groups, pollinator groups, plant species, and distinct interactions observed in each area type.
RICHNESS Insect groups Pollinator groups Plant species Interactions
Abandoned 94 54 25 133
Natural 85 32 18 81
Restored 96 51 24 126
12
Figure 2 – Pollination networks incorporating all pollen transport data collected for each area (all months and sites). Line width represent the strength of interactions, and bar width represents total amount of pollen grains carried by each pollinator group (upper level) and total amount of pollen transported belonging to each plant species (lower level).
The pollinators which carried the largest amount of pollen grains belonged to Hymenoptera, Diptera and Coleoptera. Among hymenopterans, Apoidea (bees) carried 86% of all pollen grains transported. The soldier fly species Empis tessellata and two Coleoptera families (Oedemeridae - pollen-feeding beetles, and Melyridae - soft-winged flower beetles) carried among themselves less than 5% of all pollen grains. In addition, the proportion of individuals found carrying pollen in Apoidea was generally higher than in the other groups (Figure 3). The remaining pollinator groups were even less relevant, each of them carrying under 1% of all pollen grains.
13 Since Apoidea itself was responsible for the majority of pollen transport we further considered three groups of this superfamily: honey bees (Apis mellifera), responsible for 40% of pollen transport, bumblebees (Bombus terrestris and Bombus ruderatus) with 26%, and wild bees (23 groups) with 20%. The last group includes all solitary bee species and groups captured (Annex V), since individual groups were found in much lower abundance when compared to honey bees and bumblebees.
Figure 3 – Number of individuals captured for the most overall abundant pollinator groups. The blue portion of each group bar represents the number of insects of that group captured while carrying pollen.
Apis mellifera and Bombus terrestris were the most abundant pollinators in both the natural and
abandoned areas, followed by Oedemera barbara (Oedemeridae) in the natural area, and by wild bees in the abandoned area. The three bee groups were also the most abundant in the restored area, but in this case wild bees were in the lead, followed by Apis mellifera, Bombus terrestris and
14 Constrained correspondence analysis, despite explaining only 23% of variance, managed to clearly separate the different areas according to their most outstanding vegetation characteristics (Figure 4). The first axis is mostly explained by tree cover, which correlates greatly with the restored area. On the other hand, the second axis generally describes a gradient from open areas (dominated by either bare soil or herbaceous cover) to dense shrub cover. While the abandoned area greatly correlates with bare soil lacking shrub cover, the natural area is mostly associated to high shrub cover, and reduced herbaceous cover. These results are coherent with what can be observed on the field, where higher shrub cover is inversely related to bare soil and herbaceous cover. Both these areas do not show any correlation to tree cover, since it is mostly absent in them.
Regarding insect species, while both bumblebees and honey bees were not related to any particular area, we found a large number of wild bee groups overlapping the restored area polygon.
15
Figure 4 – Results of CCA (first and second components). The dotted ellipse represents 75% of wild bee groups, weighted by their abundance.
Bray-Curtis dissimilarity index shows that the pollinator communities appear to be most distinct on restored locations comparatively to other areas, while both natural and abandoned locations show higher similarity (Figure 5). Average dissimilarity values are the same between restored and natural sites and restored and abandoned sites (0.60), while the average value is lower between abandoned and natural sites (0.47). Restored site communities also seem to hold high variability among themselves (higher within-dissimilarity), which agrees with the higher area of the polygon obtained in the CCA (Figure 3).
16
Figure 5 – Bray-Curtis dissimilarity between sites. Colors range from red (most similar) to blue (most dissimilar).
Network level analysis
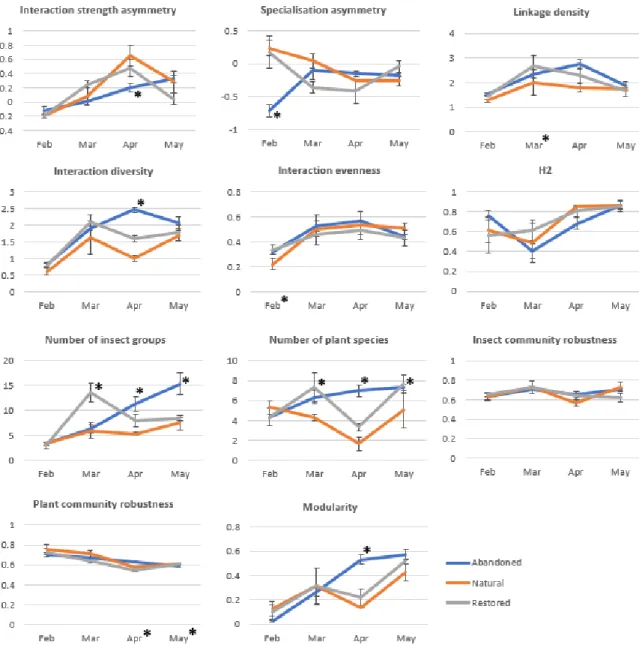
Significant differences were found for all metrics analyzed, except H2 and robustness of the insect community to plant extinctions (Figure 6, Annex VII-A). Linear mixed models showed that in some cases (linkage density, interaction evenness and plant community robustness), only month revealed to have significant differences on metric values, meaning that metrics varied significantly over time regardless of the area. For example, Shannon diversity was significantly lower in February, interaction evenness was significantly higher in March, and plant community robustness values were significantly lower for April and May showing a monotone decrease along time.
Nonetheless, in most cases, the interaction between area and month was significant (ISA, SA, interaction diversity, number of insect groups, number of plant species and modularity), showing that metrics varied inconsistently between areas over time.
The number of insect groups and plant species presented the most variation of all analyzed metrics, though very similar for all areas in February. In the abandoned area, the number of insect groups
17 and plant species increased consistently over time. Between restored and natural areas, despite the overall trends being more similar to each other than to abandoned areas, the restored sites had significantly higher peak values for insect groups in March and for plant species in March and May.
In general, for metrics with significant differences at least partly attributable to area type, values varied greatly over time. For both natural and restored areas, the overall outline is quite similar, with peaking and minimal values agreeing concurrently. This pattern is particularly apparent from the analysis of values of ISA, SA, interaction diversity and modularity (Figure 6). The abandoned area values, on the other hand, are inconsistent with this outline, showing consistent increase (ISA, modularity) or peaking values opposite those observed for the other two areas (SA, interaction diversity).
18
Figure 6 – Temporal trends of each network metric for the different areas. Trend lines were built using mean values for the metrics and error bars represent standard error. Asterisks signal instances where significant differences were detected by the linear mixed models.
Species level analysis
Abundance patterns were quite distinct between groups of species, with significant differences detected for all groups (Figure 7, Annex VII-B). Abundance of honey bees varied consistently in all three areas, except for the natural area in February where it assumed significantly higher abundance. Wild bees also showed a similar pattern between areas, though abundance peaked significantly in restored areas in March. Bumblebees were the only group where there was a significant difference in abundance consistent with an influence attributable only to area type. A
19 higher abundance was consistently observed in the abandoned area over the whole duration of the study.
Figure 7 – Temporal trends of bee group abundances for the different areas. Trend lines were built using mean values for abundance and error bars represent standard error. Asterisks and dashed lines signal instances where significant differences were detected by the linear mixed models.
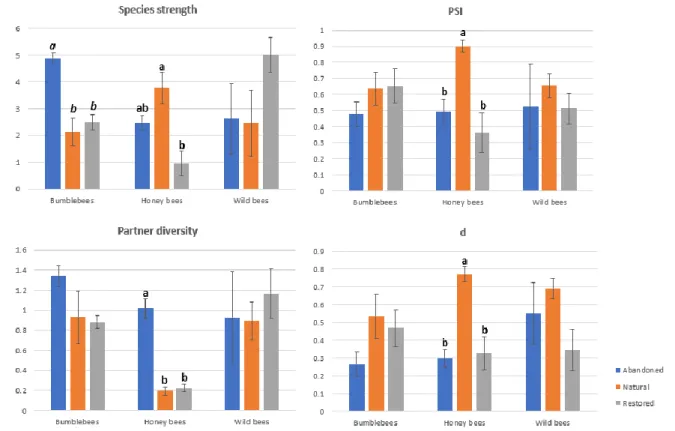
Species level metrics calculated for the global site networks showed significant differences for honey bees and bumblebees (Figure 8, Annex VII-C). Species strength was higher for honey bees in natural areas, indicating a higher relevance for the plant community, though the difference was only significant when compared to the restored area. PSI and Blüthgen’s d were significantly higher in natural areas, indicating respectively a better pollination service provision and a more specialized behavior when compared to values presented in both restored and abandoned locations. On the other hand partner diversity was significantly higher in abandoned locations, demonstrating more generalized behavior. For bumblebees, only species strength was significantly different, being much higher in the abandoned area.
20
Figure 8 – Summary of species level metrics calculated for each bee group in each area. Bars represent mean values and error bars represent standard error. For metrics and groups where significant differences were found, letters in the respective bars are used to represent how the different areas are grouped together according to values obtained.
Regarding wild solitary bees, no significant differences were found for any of the metrics, even when apparent from visual representations, which could be due to higher standard error, particularly in abandoned locations.
Although practically only honey bees varied significantly in the ecological roles they play according to the area, an interesting pattern emerges regarding a shift of the group with higher strength for each area type: honey bees appeared to be more important in the natural area, bumblebees in the abandoned, and wild bees in restored area. Niche analysis showed high values of overlap (over 84%) between all bee groups. Further exploring these relations, we found a significantly inverse relationship between honey bee and wild bee abundance (r2 = 0.453, p-value = 0.047), so that in sites where honey bees were more abundant, the combined abundance of wild solitary bee species was lower (Figure 9). Relationships between bumblebee and honey bee abundance (r2 = 0.007,
p-21 value = 0.831) as well as bumblebee and wild bee abundance (r2 = 0.011, p-value = 0.788) were not significant.
Figure 9 – Regression line representing the inverse relationship found between honey bee and wild bee abundance.
Discussion
Effect of restoration strategy on network structure
We detected functional differences in pollination service as expected, since network metrics in the restored area seem to follow more closely the patterns found in the natural area. Nonetheless, the differences found were only sporadic in the abandoned areas, which implies that the service is being sufficiently provided and that communities associated to that specific restoration strategy are not significantly less proficient than others are. The few differences found were related to expected monthly differences, or occasionally localized in time, and can be attributed to intrinsic local conditions. Thus, as expected, the temporal variable had a significant impact on network structure,
22 with all significant differences observed at least partly related to it. Structural differences were found mainly in February and April, reflecting variations in flower resource availability and diversity, which varied considerably across sampling sessions (Annex VI). Our results are in accordance with other studies that found that resource availability has a strong influence in network structure (e.g. for bacteria-bacteriophage: Lepennetier, Martinez, Ramsayer, & Hochberg, 2011; and for plant-frugivore networks: Carnicer, Jordano, & Melián, 2009; Ramos-Robles, Andresen, & Díaz-Castelazo, 2016), mediating both structural properties of networks and species behavior.
In February, interaction evenness is lower since the interactions between Apoidea (namely, Apis
mellifera and Bombus terrestris) and Rosmarinus officinalis dominate over all others. At this point
interactions are not diverse and networks are mostly similar across all sites. Along the flowering period, both insect groups and plant species diversify, with an impact on interaction diversity and other structural metrics. Floral diversity and dominance variation were very similar for the natural and restored area, while the abandoned area presented a different pattern. While in the natural and restored sites, diversity was at its maximum and dominance at its minimum in March, these peak values occurred only in April in the abandoned area. Between the sampling sessions of March and April, flower availability decreased severely in all areas (Annex VI). However, in abandoned sites, where there is a richer herbaceous layer composed of ruderal species, the floral diversity remained high, contrary to what occurred in shrub-dominated natural and restored areas. Accordingly, the network structure reflected these events, with April being the month where most differences were detected. For instance, while the networks are quite symmetric in general, with insects and plants similarly specialized and dependent on each other, in April natural and restored area insects become very dependent on the few plant species available and interactions themselves become less diverse. The more diverse plant community in the abandoned area provides enough resources to support an also increasingly diverse pollinator community, diverse interactions and the increasingly modular pattern of interactions between species, which is characteristic of larger networks (Olesen et al., 2007).
23 The pollination networks in this study can be considered specialized in general, meaning that both plants and pollinators interact with only a few partners. On the other hand, network modularity is generally low and the networks’ community robustness is consistently high for both insects and plants, even though specialized networks are considered to be more vulnerable to extinction than generalist ones (Weiner, Werner, Linsenmair, & Blüthgen, 2014). In April and May, abandoned area networks can be considered modular, with weakly interlinked subsets of species (modules), which internally consist of strongly connected species (Olesen et al., 2007). Therefore, plants are more dependent on a few pollinator insects (showing higher level of specialization), and thus plant community robustness lowers slightly during these months, and increases its vulnerability to random extinctions. Therefore, the fact that our pollination network structure was in general not modular may have counteracted the effects of high specialization, by increasing the robustness of both communities to random extinctions. In line with these results, a previous study has shown that while modularity may be advantageous for trophic networks, it can decrease the persistence of mutualistic networks (Thébault & Fontaine, 2010).
Overall, restored metrics tend to follow the same patterns as observed in the natural area, while metrics in the abandoned area show the most differences. Pollination itself as a process is being performed at similar levels in all areas. In fact, specialized symmetrical pollinator networks such as those present in this study have been observed in Canada associated with low disturbance sites (Villalobos, Sevenello-Montagner & Vamosi, 2019), which seems to point to a recovered state of the service. Thus, the abandoned area represents a still evolving early successional stage, and its distinctive pattern can be explained by local conditions potentiated by lack of intervention. This might mean that abandoned area function must likely suffer some adjustments until it reaches a pattern more similar to that found in the natural area.
24 Pollinator community: composition vs function
In our pollination case-study, the compositional evaluation yielded results which were quite distinct from those obtained from functional evaluation, to such an extent as to be called opposite. Composition singled out restored area pollinator communities as the most distinct, revealing the abandoned area closer to the natural reference ecosystem in terms of composition, despite them being on opposite situations in terms of vegetation structure. By itself, this result would suggest that the restoration had been better attained by passive means. Conversely, when observing function, the restored area follows the natural reference patterns much closer, as we had hypothesized. The abandoned area patterns present several significant differences, suggesting at first glance that restoration effectiveness may be best achieved by implementing active measures.
As expected, vegetation cover promotes distinct species composition. Our results show that, despite pollination service not differing greatly between areas, community index shows high dissimilarity in pollinator community composition. This fact is especially true for the restored area, where most differences were observed. These results suggest that pollination service is being held by different species or groups regarding the area.
Further analysis on the role of species allowed to determine that honey bees are the only group that behaves differently across all areas. They are more relevant for the plant community in the natural area, significantly more so than in restored sites. Pollinators should be more important for plant species if they are common and specialized (Dormann, 2011), which is exactly what honey bees are in natural sites, using pollen resources independently from their availability, and providing a high-quality pollination service. In restored areas, where they are less relevant to the plant community, honey bees interact with only a few partners at a time, but they are opportunistic, using floral resources as they become available. This could be related to the scarcity of floral resources in this area, since low resource availability can favor opportunistic behavior (Rueffler, Dooren, & Metz, 2007).
25 Bumblebees had a more consistent behavior, showing similar importance as pollinators among sites. However, the dependence of the plant community (species strength) of the abandoned area is much higher than in other areas. In the abandoned area, bumblebees are consistently and significantly more abundant, and their high density results in a more generalized and opportunistic foraging behavior. Such diet expansion has been observed in areas of higher bumblebee density (Fontaine, Collin, & Dajoz, 2018). The higher dependence of the abandoned plant community should then be explained by their disproportionate abundance instead of a higher quality of the service provided to the community.
From the three bee groups studied, only wild solitary bee species had a consistent behavior across all areas. They are similarly relevant for all plant communities, and have a similar degree of moderate specialization, though a slightly more opportunistic behavior was obtained in restored sites. However, it should be taken into account that these measures were obtained for wild bees as a group, while pooling all species pollination data, so individual species might actually be more specialized.
Looking at species strength of the different bee groups within each area, we can observe that there is a group with higher relevance for each, and that this group is consistent with significant differences in abundance. Honey bees play the most important role in the natural area, bumblebees in the abandoned one and wild bees in the restored sites, with the CCA results supporting also the association of most wild bee species with these sites.
The negative relationship of honey bee and wild bee abundance, coupled with their high niche overlap, suggests a putative replacement of the role of wild bee species by honey bees as pollinators. This result supports growing concerns reported in other studies that indicate that in the Mediterranean basin, honey bee abundance has been increasing over the last century, leading to the replacement and decline of wild bee species (Herrera, 2019). It has also been shown that the exclusion of a bee species can favor higher abundance of other bees, especially in cases of limited
26 resource availability (Wignall et al., 2019). The restored area might be less attractive for honey bees since it is poorer in floral resources (less abundant in general and less diverse). Their ability to forage along larger distances when compared to other bee groups (Alarcón, Waser, & Ollerton, 2008) allows the species a larger choice of pollen foraging grounds, avoiding resource poor locations. Wild bees, on the other hand, have low foraging capabilities and tend to nest close to the location where they were reared (Fortel, Henry, Guilbaud, Mouret, & Vaissière, 2016). The low honey bee density coupled with larger bare soil cover and local presence of stone piles, which are important habitat requirements for many ground-nesting and cavity-nesting bee species respectively, are what makes the restored area more appealing to wild bee species (Tiedeken & FitzPatrick, 2016).
Overall, high abundance of honey bees (high dominance) contributes to a higher homogenization of the pollinator community, while a more heterogeneous pollinator community composed of diverse wild bee species is attained when honey bees abundance is lower. Bumblebees are favored by the presence of late-flowering species that allow them to build up energy stores before winter dormancy (NRCS, 2013), which could explain their preference for the abandoned quarries. While other areas show an earlier tendency for flower resource depletion, abandoned area flower diversity is more stable over time, ensuring a steadier pollen supply that can sustain bumblebees leading up to hibernation periods.
In our study, the pollination service is being provided by different species in different areas, consistent with a relatively steady network structure, while some species and groups change their roles within the networks. This is commonly found in the literature for pollination networks, where alteration of species, interactions and species roles can occur without major alterations in the overall network structure (Alarcón et al., 2008; Forup et al., 2008; Forup & Memmott, 2005; Nielsen & Totland, 2014; Petanidou, Kallimanis, Tzanopoulos, Sgardelis & Pantis, 2008). In this study, we observed a process in which the vegetation structure promoted by different restoration approaches dictates the type of plant species available in each area, and hence resource availability, whose
27 variation in turn affects network structure and the roles species play within the networks themselves, ultimately influencing the way in which the ecosystem service of pollination is provided in each area.
Implications for restoration management
Our results highlight the importance of taking function into account when evaluating restoration endeavors. In our case study, evaluating composition alone could single out active restoration as a non-successful approach, while the actively restored area has not only achieved similar function to that observed in the natural reference ecosystem, but in addition also harbored a heterogeneous pollinator community which included many wild bee species. Using compositional measures alone to evaluate restoration might, therefore, hinder the achievement of the desired outcome and lead to bad allocation of funds towards unnecessary actions intended to restore a function that is already at its desired state. Our results point out that restoration can be achieved with distinct biological communities providing function and ecosystem services as effectively as the communities found in natural reference ecosystems (Denning & Foster, 2017; Forup & Memmott, 2005; Williams, 2011). However, we are not advocating that functional measures should replace compositional measures altogether, but instead that they should complement each other in restoration planning and evaluation. Both are attributes of restored ecosystems according to the SER Primer (Clewell et al., 2004), and their use as complementary measures should help maximize biodiversity at a landscape scale, as well as increase stability through functional redundancy.
Our results suggest that active restoration allowed for a faster restoration of function, since, in a shorter time period, the restored quarries attained functional patterns more similar to those observed in the natural reference ecosystem. After 20-30 years of active restoration, function in restored areas is more similar to natural areas than 40 years of natural succession. Passive restoration, nonetheless, also appears to allow for function recovery. However, some
28 considerations must be weighed before considering its promotion as an effective alternative to active restoration efforts. In our study, abandoned areas were located at much smaller quarrying sites. This means that the whole area under passive recovery is closer to remnant natural habitat than most of the actively restored area, a factor that has a positive influence on pollinator community recovery (Cusser & Goodell, 2013), and may have lessened the effect of scant vegetation. With this in mind, we should expect different outcomes in the observed patterns of network structure in abandoned area if the size was the same, and recovery would not have reached this advanced state in such a short amount of time. Nevertheless, we stress that the ongoing natural process of secondary succession has allowed for the establishment of ruderal opportunistic plants (e.g. Rubus ulmifolius) that contributed positively to maintenance of a steady pollination service, buffering against the shortage of resources detected at both natural and restored areas in April and May. It would be interesting for future restoration research work to evaluate passive restoration in quarries of different sizes to possibly determine a size threshold for effectiveness and applicability of this restoration approach.
In the case of the restored quarry, the enhancement of wild bee species was not an original target but a welcome side effect of restoration, namely the use of a diverse array of plant species for revegetation, resulting on the provision of suitable habitat conditions and varied flower resources. Keeping this in mind for future restoration actions, the benefits for this vulnerable group of bees could easily be amplified with minimal costs, effortlessly improving overall restoration benefits. The lower robustness of the plant community in April and May could also be circumvented in the restored area through the use of “bridging” plants that flower during periods of lower availability and provide nectar and pollen resources (Menz et al., 2011), such as herbaceous plants (species of
Allium, Carduus and Malva, for instance). This should promote floral heterogeneity, strengthening
the insect community and, as a consequence, increase the robustness of the plant community as well. The addition of nesting substrates for wild bees (creation of sand pits and piles, log placement,
29 installation of bee hotels) can be easily undertaken and might be an opportunity to involve school groups and the community, while educating about the importance of the restoration process.
29 References
Alarcón, R. (2010). Congruence between visitation and pollen-transport networks in a California plant pollinator community. Oikos, 119, 35–44.
https://doi.org/10.1111/j.1600-0706.2009.17694.x
Alarcón, R., Waser, N. M., & Ollerton, J. (2008). Year-to-year variation in the topology of a plant-pollinator interaction network. Oikos, 117(12), 1796–1807.
https://doi.org/10.1111/j.2008.0030-1299.16987.x
Baldock, D., Wood, T. J., Cross, I., & Smit, J. (2018). The Bees of Portugal (Hymenoptera: Apoidea: Anthophila). Entomofauna, 22(164).
Barrientos (ed.), J. A., Abelló, P., Alba-Tercedor, J., Alonso-Zaragaza, M. Á., Alonso, M., Bach, C., … Zaragoza, J. A. (2004). Curso Práctico de Entomología. (J. A. Barrientos, Ed.). Alicante,
Bellaterra: Asociación Española de Entomología, CIBIO, Universidad Autònoma de Barcelona - Servei de Publicacions.
Benayas, J. M. R., Newton, A. C., Diaz, A., & Bullock, J. M. (2009). Enhancement of biodiversity and ecosystem services by ecological restoration: a meta-analysis. S, 325(5944), 1121–1124. https://doi.org/10.1126/science.1172460
Bogusch, P., & Straka, J. (2012). Review and identification of the cuckoo bees of central Europe (Hymenoptera: Halictidae: Sphecodes). Zootaxa, 3311, 1–41.
Bosch, J., González, A. M. M., Rodrigo, A., & Navarro, D. (2009). Plant – pollinator networks : adding the pollinator’s perspective. Ecology Letters, 12, 409–419.
https://doi.org/10.1111/j.1461-0248.2009.01296.x
Cadotte, M. W., Carscadden, K., & Mirotchnick, N. (2011). Beyond species : functional diversity and the maintenance of ecological processes and services. Journal of Applied Ecology, 48(5), 1079–1087. https://doi.org/10.1111/j.1365-2664.2011.02048.x
Cagua, E. F., Wootton, K. L., & Stouffer, D. B. (2019). Keystoneness , centrality , and the structural controllability of ecological networks. Journal of Ecology, 1–12.
https://doi.org/10.1111/1365-2745.13147
Carnicer, J., Jordano, P., & Melián, C. J. (2009). The temporal dynamics of resource use by frugivorous birds: a network approach. Ecology, 90(7), 1958–1970.
Chinery, M. (2012). Insects of Britain and Western Europe (3rd ed.). London: Bloomsbury Publishing.
Christmann, S. (2019). Do we realize the full impact of pollinator loss on other ecosystem services and the challenges for any restoration in terrestrial areas ? Restoration Ecology.
https://doi.org/10.1111/rec.12950
Clewell, A., Aronson, J., Winterhalder, K., Higgs, E., Martinez, D., Hobbs, R., … Rieger, J. (2004). The
SER International Primer on Ecological Restoration.
Coe, R. L. (1953). Handbook for the Identification of British Insects - Diptera: Syrphidae. London: Royal Entomological Society of London.
Collins, G. (2012). Identification: Keys to genera. In BWARS - Bees in Britain. Author’s online edition.
30 Restoration of Plant – Pollinator Networks on a Reclaimed Strip Mine. Restoration Ecology,
21(6), 713–721. https://doi.org/10.1111/rec.12003
Denning, K. R., & Foster, B. L. (2017). Flower visitor communities are similar on remnant and reconstructed tallgrass prairies despite forb community differences. Restoration Ecology,
26(4), 751–759. https://doi.org/10.1111/rec.12615
Dormann, C F, Gruber, B., & Fruend, J. (2008). Introducing the bipartite Package: Analysing Ecological Networks. R News, 8(2), 8–11.
Dormann, Carsten F. (2011). How to be a specialist? Quantifying specialisation in pollination networks. Network Biology, 1(1), 1–20.
Dormann, Carsten F, Fruend, J., & Gruber, B. (2018). Package “bipartite.”
Esteves, S. (2015). Proposta de Requalificação e Sustentabilidade da Serra de São Luís. Universidade Atlântica.
Fontaine, C., Collin, C. L., & Dajoz, I. (2018). Generalist foraging of pollinators: diet expansion at high density. Journal of Ecology, 96(5), 1002–1010. https://doi.org/10.1111/j.1365-2745.2008.01405.x
Fortel, L., Henry, M., Guilbaud, L., Mouret, H., & Vaissière, B. E. (2016). Use of human-made nesting structures by wild bees in an urban environment. Journal of Insect Conservation, 20, 239–253. https://doi.org/10.1007/s10841-016-9857-y
Forup, M. L., Henson, K. S. E., Craze, P. G., & Memmott, J. (2008). The restoration of ecological interactions: plant – pollinator networks on ancient and restored heathlands. Journal of
Applied Ecology, 45, 742–752. https://doi.org/10.1111/j.1365-2664.2007.01390.x
Forup, M. L., & Memmott, J. (2005). The Restoration of Plant – Pollinator Interactions in Hay Meadows. Restoration Ecology, 13(2), 265–274.
Freire, A. L., Couto, A., Herdeiro, A. J., Segurado, A., Carqueijeiro, E., Viegas, G., … David, N. (1996).
Paque Natural da Arrábida - Plano de Ordenamento, 1a Fase - Estudos de Caracterização.
Setúbal.
Garcia-Pereira, P., Monteiro, E., Soares, A., Félix, R., Antunes, S., Santos, R., & Maravalhas, E. (2019). Guia das Borboletas Comuns de Portugal Continental. Tagis.
Geert, A. Van, Rossum, F. Van, & Triest, L. (2010). Do linear landscape elements in farmland act as biological corridors for pollen dispersal ? Journal of Ecology, 98, 178–187.
https://doi.org/10.1111/j.1365-2745.2009.01600.x
Germano, D., Lopes, L., Pinto-Gomes, C., Pedro-Santos, A., & Martins, R. (2014). O Impacte das Pedreiras Inactivas na Fauna, Flora e Vegetação da Zona dos Mármores: Problema ou Benefício? Callipole - Revista de Cultura, 21, 149–171.
Goldstein, J., & Zych, M. (2016). What if we lose a hub? Experimental testing of pollination
network resilience to removal of keystone floral resources. Arthropod-Plant Interactions, 10, 263–271. https://doi.org/10.1007/s11829-016-9431-2
Hackston, M. (n.d.). Family Empididae - Key to genus adapted from Collin (1960). 2012. Retrieved from
https://docs.google.com/viewer?a=v&pid=sites&srcid=ZGVmYXVsdGRvbWFpbnxtaWtlc2luc2 VjdGtleXMyfGd4OjYzYjg4NDVlZGNhOGU4NmY
31 Hackston, M., & Lompe, A. (2013). Family Dasytidae - Key to British Species. Retrieved from
https://docs.google.com/viewer?a=v&pid=sites&srcid=ZGVmYXVsdGRvbWFpbnxtaWtlc2luc2 VjdGtleXN8Z3g6MTI0NTNkZjIyMDkzZTdlNA
Herrera, C. (2019). Gradual replacement of wild bees by honeybees in flowers of the Mediterranean
Basin over the last 50 years.
Holl, K. D., & Aide, T. M. (2010). When and where to actively restore ecosystems? Forest Ecology
and Management, 261(10), 1558–1563. https://doi.org/10.1016/j.foreco.2010.07.004
ICNF. (n.d.). Parque Natural da Arrábida. Retrieved December 2, 2019, from http://www2.icnf.pt/portal/ap/p-nat/pnar
Jordano, P. (2016). Sampling networks of ecological interactions. Functional Ecology, 30, 1883– 1893. https://doi.org/10.1111/1365-2435.12763
Kaiser-Bunbury, C. N., & Blüthgen, N. (2015). Integrating network ecology with applied conservation : a synthesis and guide to implementation. AoB Plants, 7.
https://doi.org/10.1093/aobpla/plv076
Kaiser-Bunbury, C. N., Mougal, J., Whittington, A. E., Valentin, T., Gabriel, R., Olesen, J. M., & Blüthgen, N. (2017). Ecosystem restoration stregthens polination network resilience and function. Nature, 542, 223–227. https://doi.org/10.1038/nature21071
Kaiser-Bunbury, C. N., Traveset, A., & Hansen, D. M. (2009). Conservation and restoration of plant – animal mutualisms on oceanic islands. Perspectives in Plant Ecol, Evol and Systematics,
12(2), 131–143. https://doi.org/10.1016/j.ppees.2009.10.002
Kasparek, M. (2019). Bees in the genus Rhodanthidium - A Review and Identification Guide.
Entomofauna, 23(128).
Krebs, C. J. (2014). Niche Measures and Resource Preferences. In Ecological Methodology (3rd (in pr, pp. 597–653). Boston: Addison-Wesley Educational Publishers.
Lepennetier, G., Martinez, E., Ramsayer, J., & Hochberg, M. E. (2011). Resource availability affects the structure of a natural bacteria – bacteriophage community. Biology Letters, 7, 201–204. Martins, K. T., Gonzalez, A., & Lechowicz, M. J. (2017). Patterns of pollinator turnover and
increasing diversity associated with urban habitats. Urban Ecosyst, 20, 1359–1371. https://doi.org/10.1007/s11252-017-0688-8
Menz, M. H. M., Phillips, R. D., Winfree, R., Kremen, C., Aizen, M. A., Johnson, S. D., & Dixon, K. W. (2011). Reconnecting plants and pollinators : challenges in the restoration of pollination mutualisms. Trends in Plant Science, 16(1), 4–12.
https://doi.org/10.1016/j.tplants.2010.09.006
Montoya, D., Rogers, L., & Memmott, J. (2012). Emerging perspectives in the restoration of biodiversity-based ecosystem services. Trends in Ecology & Evolution, 27(12), 666–672. https://doi.org/10.1016/j.tree.2012.07.004
Nielsen, A., & Totland, Ø. (2014). Structural properties of mutualistic networks withstand habitat degradation while species functional roles might change. Oikos, 123, 323–333.
https://doi.org/10.1111/j.1600-0706.2013.00644.x
NRCS. (2013). Pollinator biology and habitat - Michigan Biology Technical Note No. 20.
Nunes, A., Cabral, M. S., Branquinho, C., & Correia, O. (2014). Beneficial effect of pine thinning in mixed plantations through changes in the understory functional composition. Ecological
32
Engineering, 70, 387–396. https://doi.org/10.1016/j.ecoleng.2014.06.026
Oberle, B., Bringezu, S., Hatfield-dodds, S., Hellweg, S., Schandl, H., Clement, J., … Kaviti, J. (2019).
Global Resources Outlook 2019: Natural Resources for the Future We Want.
Oksanen, J., Blanchet, F. G., Friendly, M., Kindt, R., Legendre, P., McGlinn, D., … Wagner, H. (2018). vegan: Community Ecology Package. Retrieved from
https://cran.r-project.org/package=vegan
Olesen, J. M., Bascompte, J., Dupont, Y. L., & Jordano, P. (2007). The modularity of pollination networks. PNAS, 104(50), 19891–19896.
Ortiz-Sánchez, F. J. (1997). An update on the Ibero-balearic species of Xylocopa LATREILLE, 1802, with new data in Morocco (Hymenoptera, Anthophoridae). Entomofauna, 18(18), 237–244. Petanidou, T., Kallimanis, A. S., Tzanopoulos, J., Sgardelis, S. P., & Pantis, J. D. (2008). Long-term
observation of a pollination network : fluctuation in species and interactions , relative invariance of network structure and implications for estimates of specialization. Ecology
Letters, 11, 564–575. https://doi.org/10.1111/j.1461-0248.2008.01170.x
Pinheiro, J., Bates, D., DebRoy, S., Sarkar, D., & Team, R. C. (2019). nlme: Linear and Nonlinear Mixed Effects Models. Retrieved from https://cran.r-project.org/package=nlme
Pocock, M. J. O., Evans, D. M., Fontaine, C., Harvey, M., Juilliard, R., McLaughlin, Ó., … Bohan, D. A. (2016). The Visualisation of Ecological Networks, and Their Use as a Tool for Engagement, Advocacy and Management. In Advances in Ecological Research (pp. 41–85).
https://doi.org/10.1016/bs.aecr.2015.10.006
Potts, S. G., Biesmeijer, J. C., Kremen, C., Neumann, P., Schweiger, O., & Kunin, W. E. (2010). Global pollinator declines: trends , impacts and drivers. Trends in Ecology & Evolution, 25(6), 345– 353. https://doi.org/10.1016/j.tree.2010.01.007
Prach, K., & Hobbs, R. J. (2008). Spontaneous Succession versus Technical Reclamation in the Restoration of Disturbed Sites. Restoration Ecology, 16(3), 363–366.
https://doi.org/10.1111/j.1526-100X.2008.00412.x
Ramos-Robles, M., Andresen, E., & Díaz-Castelazo, C. (2016). Temporal changes in the structure of a plant-frugivore network are influenced by bird migration and fruit availability. PeerJ,
4(e2048). https://doi.org/10.7717/peerj.2048
Rueffler, C., Dooren, T. J. M. Van, & Metz, J. A. J. (2007). The Interplay between Behavior and Morphology in the Evolutionary Dynamics of Resource Specialization. The American
Naturalist, 169(2), E34–E52.
Ruiz-Jaen, M. C., & Aide, T. M. (2005). Restoration success: how is it being measured? Restoration
Ecology, 13(3), 569–577.
Scheuchl, E. (n.d.). Key to the genera of Turkish bees.
Shackelford, N., Hobbs, R. J., Burgar, J. M., Erickson, T. E., Fontaine, J. B., Ramalho, C. E., … Lalibert, E. (2013). Primed for Change : Developing Ecological Restoration for the 21st Century.
Restoration Ecology, 21(3), 297–304. https://doi.org/10.1111/rec.12012
Smit, J. (2018). Identification key to the European species of the bee genus Nomada SCOPOLI, 1770 (Hymenoptera: Apidae), including 23 new species. Entomofauna.
Team, R. C. (2018). R: A language and environment for statistical computing. R Foundation for Statistical Computing, Vienna, Austria. Retrieved from https://www.r-project.org/