RESEARCH ARTICLE
Genome-Wide Association Study with
Targeted and Non-targeted NMR
Metabolomics Identifies 15 Novel Loci of
Urinary Human Metabolic Individuality
Johannes Raffler1, Nele Friedrich2,3, Matthias Arnold1, Tim Kacprowski4, Rico Rueedi5,6, Elisabeth Altmaier7, Sven Bergmann5,6, Kathrin Budde2, Christian Gieger7,
Georg Homuth4, Maik Pietzner2, Werner Römisch-Margl1, Konstantin Strauch8,9, Henry Völzke3,10, Melanie Waldenberger7, Henri Wallaschofski2, Matthias Nauck2,3, Uwe Völker3,4, Gabi Kastenmüller1*, Karsten Suhre1,11
1Institute of Bioinformatics and Systems Biology, Helmholtz Zentrum München, German Research Center for Environmental Health, Neuherberg, Germany,2Institute of Clinical Chemistry and Laboratory Medicine, University Medicine Greifswald, Greifswald, Germany,3DZHK (German Center for Cardiovascular Research), partner site Greifswald, Greifswald, Germany,4Interfaculty Institute of Genetics and Functional Genomics, University Medicine Greifswald, Greifswald, Germany,5Department of Medical Genetics, University of Lausanne, Lausanne, Switzerland,6Swiss Institute of Bioinformatics, Lausanne, Switzerland,
7Research Unit Molecular Epidemiology, Institute of Epidemiology II, Helmholtz Zentrum München, German Research Center for Environmental Health, Neuherberg, Germany,8Institute of Genetic Epidemiology, Helmholtz Zentrum München, German Research Center for Environmental Health, Neuherberg, Germany,
9Institute of Medical Informatics, Biometry and Epidemiology, Chair of Genetic Epidemiology, Ludwig-Maximilians-Universität, Munich, Germany,10 Institute for Community Medicine, University Medicine Greifswald, Greifswald, Germany,11 Department of Physiology and Biophysics, Weill Cornell Medical College in Qatar, Doha, Qatar
Abstract
Genome-wide association studies with metabolic traits (mGWAS) uncovered many genetic variants that influence human metabolism. These genetically influenced metabotypes (GIMs) contribute to our metabolic individuality, our capacity to respond to environmental challenges, and our susceptibility to specific diseases. While metabolic homeostasis in blood is a well investigated topic in large mGWAS with over 150 known loci, metabolic detoxification through urinary excretion has only been addressed by few small mGWAS with only 11 associated loci so far. Here we report the largest mGWAS to date, combining targeted and non-targeted1H NMR analysis of urine samples from 3,861 participants of the
SHIP-0 cohort and 1,691 subjects of the KORA F4 cohort. We identified and replicated 22 loci with significant associations with urinary traits, 15 of which are new (HIBCH,CPS1, AGXT,XYLB,TKT,ETNPPL,SLC6A19,DMGDH,SLC36A2,GLDC,SLC6A13,ACSM3, SLC5A11,PNMT,SLC13A3). Two-thirds of the urinary loci also have a metabolite associa-tion in blood. For all but one of the 6 loci where significant associaassocia-tions target the same metabolite in blood and urine, the genetic effects have the same direction in both fluids. In contrast, for theSLC5A11locus, we found increased levels ofmyo-inositol in urine whereas mGWAS in blood reported decreased levels for the same genetic variant. This might
PLOS Genetics | DOI:10.1371/journal.pgen.1005487 September 9, 2015 1 / 28
OPEN ACCESS
Citation:Raffler J, Friedrich N, Arnold M, Kacprowski T, Rueedi R, Altmaier E, et al. (2015) Genome-Wide Association Study with Targeted and Non-targeted NMR Metabolomics Identifies 15 Novel Loci of Urinary Human Metabolic Individuality. PLoS Genet 11(9): e1005487. doi:10.1371/journal.pgen.1005487
Editor:Michael Snyder, Stanford University School of Medicine, UNITED STATES
Received:March 31, 2015
Accepted:August 6, 2015
Published:September 9, 2015
Copyright:© 2015 Raffler et al. This is an open access article distributed under the terms of the
Creative Commons Attribution License, which permits unrestricted use, distribution, and reproduction in any medium, provided the original author and source are credited.
indicate less effective re-absorption ofmyo-inositol in the kidneys of carriers. In summary, our study more than doubles the number of known loci that influence urinary phenotypes. It thus allows novel insights into the relationship between blood homeostasis and its regula-tion through excreregula-tion. The newly discovered loci also include variants previously linked to chronic kidney disease (CPS1,SLC6A13), pulmonary hypertension (CPS1), and ischemic stroke (XYLB). By establishing connections from gene to disease via metabolic traits our results provide novel hypotheses about molecular mechanisms involved in the etiology of diseases.
Author Summary
Human metabolism is influenced by genetic and environmental factors defining a person’s metabolic individuality. This individuality is linked to personal differences in the ability to react on metabolic challenges and in the susceptibility to specific diseases. By investigating how common variants in genetic regions (loci) affect individual blood metabolite levels, the substantial contribution of genetic inheritance to metabolic individuality has been demonstrated previously. Meanwhile, more than 150 loci influencing metabolic homeosta-sis in blood are known. Here we shift the focus to genetic variants that modulate urinary metabolite excretion, for which only 11 loci were reported so far. In the largest genetic study on urinary metabolites to date, we identified 15 additional loci. Most of the 26 loci also affect blood metabolite levels. This shows that the metabolic individuality seen in blood is also reflected in urine, which is expected when urine is regarded as“diluted blood”. Nonetheless, we also found loci that appear to primarily influence metabolite excretion. For instance, we identified genetic variants near a gene of a transporter that change the capability for renal re-absorption of the transporter’s substrate. Thus, our find-ings could help to elucidate molecular mechanisms influencing kidney function and the body’s detoxification capabilities.
Introduction
Genome-wide association studies with metabolic traits (mGWAS) investigate the relationship between genetic variance and metabolic phenotypes (metabotypes). In 2008, Giegeret al. pre-sented the first mGWAS in serum of 284 individuals [1]. Since then, numerous mGWAS using different analytical platforms and ever larger study populations were published [2–8]. These studies discovered more than 150 genetic loci that associate with blood levels of more than 300 distinct metabolites. We refer to these loci as the genetically influenced metabotypes (GIMs), their ensemble defining the genetic part of human metabolic individuality. Many of the single nucleotide polymorphisms (SNPs) that associate with metabolic traits map to genetic regions coding for enzymes or metabolite transporters that are biochemically linked to the associated metabolites. Moreover, a large number of these GIMs have been previously linked to clinically relevant phenotypic traits. As intermediate traits on the pathways of many disorders, these GIMs have become valuable tools that allow unraveling disease mechanisms on the molecular level [9].
However, so far mGWAS have mostly been limited to studies of serum or plasma metabolite levels, thereby focusing on genetically influenced metabolic homeostasis in blood. Only a few studies investigated urine as a complementary body fluid enabling studies of kidney function
15 Novel Loci of Urinary Human Metabolic Individuality
PLOS Genetics | DOI:10.1371/journal.pgen.1005487 September 9, 2015 2 / 28
Funding:SHIP (Study of Health in Pomerania) is part of the Community Medicine Research net of the University of Greifswald, Germany, which is funded by the German Ministry of Education and Research (BMBF,http://bmbf.de) (grants no. 01ZZ9603, 01ZZ0103, and 01ZZ0403), the University Medicine Greifswald as well as a joint grant from Siemens Healthcare, Erlangen, Germany and the Federal State of Mecklenburg-West Pomerania. Generation of genome-wide data in SHIP has also been supported by the BMBF (grant no. 03ZIK012). The KORA research platform (KORA, Cooperative Research in the Region of Augsburg) was initiated and financed by the Helmholtz Zentrum München - German Research Center for Environmental Health, which is funded by the BMBF and by the Federal State of Bavaria. Furthermore, KORA research was supported within the Munich Center of Health Sciences (MC Health), Ludwig-Maximilians-Universität, as part of LMUinnovativ. MA is supported by the Helmholtz Cross Program Activity“Metabolic Dysfunction and Human Diseases”. TK and JR were supported by the GANI_MED project funded by the BMBF and the State of Mecklenburg-West Pomerania (grant no. 03IS2061A). SB received funding from the Swiss Institute of Bioinformatics and the Swiss National Science Foundation (grant no. FN 310030_152724/1). WRM is supported by the Helmholtz Cross Program Initiative“Personalized Medicine (iMed)”. KSu is supported by the “Biomedical Research Program”funds at Weill Cornell Medical College in Qatar, a program funded by the Qatar Foundation (http://www.qf.org.qa). The funders had no role in study design, data collection and analysis, decision to publish, or preparation of the manuscript.
and the detoxification capabilities of the human body. In 2011, we published the first mGWAS in urine [10] using proton nuclear magnetic resonance spectroscopy (1H NMR) to determine metabolite concentrations in urine of 862 male participants of the SHIP-0 cohort. We identi-fied five genetic loci (SLC6A20,AGXT2,NAT2,HPD, andSLC7A9) that modulate urinary metabolite levels. While for this study metabolite concentrations were manually derived from the NMR spectra for a targeted set of metabolites, Nicholsonet al. [5] directly used spectral fea-tures as abstract, non-targeted urinary metabolic traits in an mGWAS. Based on data for 211 participants of the MolTWIN and MolOBB studies, the authors identified SNPs at three loci (ALMS1/NAT8,AGXT2, andPYROXD2) that were associated with metabolic traits in urine. Two of these loci (ALMS1/NAT8andPYROXD2) were replicated in an NMR-based mGWAS published by Montoliuet al. For that study, the authors analyzed non-targeted urinary traits from 265 subjects from the São Paolo metropolitan area [11]. Recently, Rueediet al. [12] reported significant associations of NMR-derived non-targeted urinary traits in ten loci (ALMS1/NAT8,ACADL,AGXT2,NAT2,ABO,PYROXD2,ACADS,PSMD9,SLC7A9, and
FUT2) using data from 835 participants of the CoLaus study, thus bringing the total number of reported urinary GIMs to eleven.
Here, we substantially extend our previous mGWAS with metabolic traits in urine, both in size and in scope. First, we metabolically characterize the urine samples of 3,861 male and female participants of the SHIP-0 study, thereby quadrupling the sample size when compared to previous studies. Second, we combine both targeted and non-targeted NMR-based metabo-lomics. In this way, we implement the approaches used in the studies by Nicholsonet al., Mon-toliuet al., and Rueediet al. alongside the targeted metabolomics approach used in our previous study. For an unbiased interpretation of our mGWAS results, we apply tools for evi-dence-based locus-to-gene mapping and automated assignment of metabolites to non-targeted NMR spectral features. Finally, besides determining the overlap of variants identified in our study with variants previously linked to clinical traits, we specifically investigate the overlap between variants influencing metabolic traits in both urine and blood.
Results
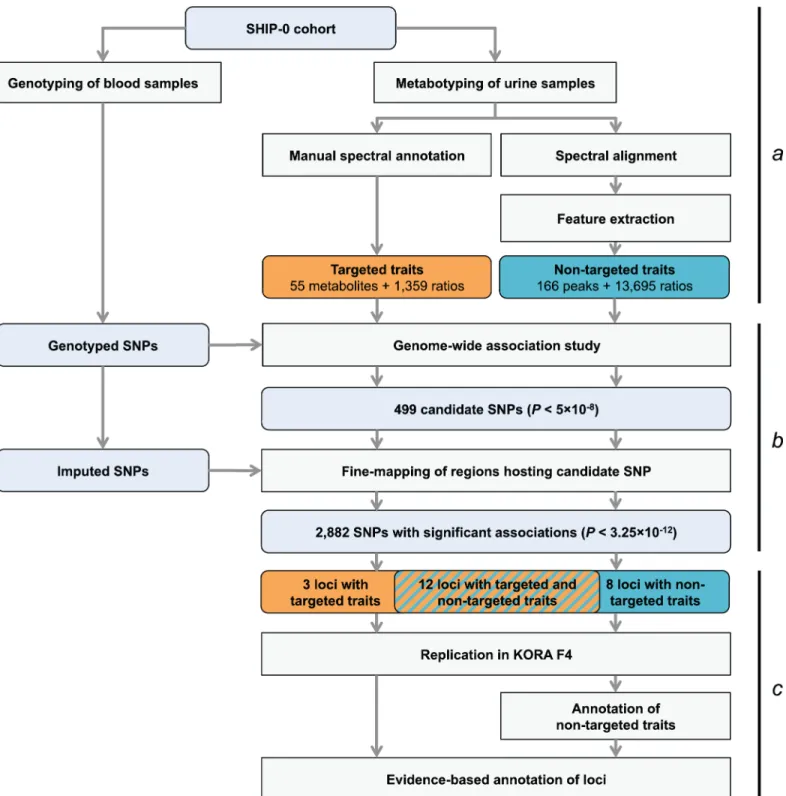
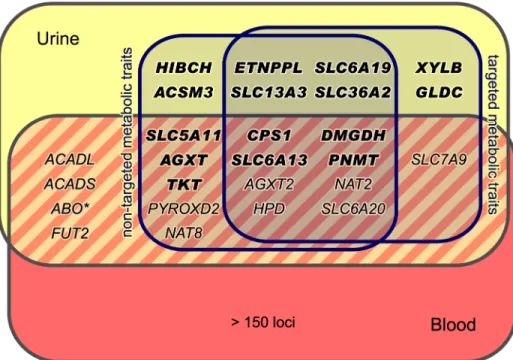
Our study is based on one-dimensional1H NMR spectra of urine samples from 3,861 geno-typed participants in the SHIP-0 cohort (seeMethods). For the targeted metabolomics analysis, we manually quantified a set of 60 metabolites in these spectra (Fig 1A). For the non-targeted analysis, we used the same spectra and applied an automated processing algorithm to align the spectra and to perform dimensionality reduction [13]. In the subsequent analysis, we screened the targeted and the non-targeted metabolic traits as well as the pairwise ratios within each trait type for associations with genotyped and imputed variants in a two-step approach (Fig 1B). We identified a total of 23 genetic loci that display significant associations with targeted and/or non-targeted metabolic traits (Fig 2, Tables1and2). All but one of the discovered loci replicated in data from the KORA F4 cohort (N = 1,691). For 15 loci, our study is, to the best of our knowledge, the first to report associations with urinary traits. For 7 of these 15 loci, associa-tions have previously been reported with blood metabolites. Thus, 8 loci are entirely new (Fig 3). Finally, 11 of the 22 replicated loci host significantly associated variants that were previously associated with phenotypes of clinical relevance (Table 3).
mGWAS with targeted and non-targeted NMR features
For the targeted metabolomics analysis, the1H NMR spectra were manually annotated to derive absolute metabolite concentrations (out of a panel of 60 compounds) for each sample. For the non-targeted analysis, the same spectra were automatically aligned and processed using
15 Novel Loci of Urinary Human Metabolic Individuality
Fig 1. Study design.(a) Genotyping and metabotyping of 3,861 SHIP-0 study participants. One-dimensional1H NMR spectra of the urine samples were
recorded to derive targeted and non-targeted metabolic traits. (b) Two-staged mGWAS. First stage: genome-wide association tests using genotyped SNPs and 15,379 targeted and non-targeted traits. Second stage: fine mapping of regions with potentially significant associations using imputed SNPs. (c) Replication and interpretation. Genome-wide significantly associated SNPs were assigned to one of 23 distinct genetic loci. The loci and the significantly associated non-targeted traits were annotated using algorithmic approaches. 22 of the 23 loci could be replicated using genotype and metabotype data from 1,691 KORA F4 participants.
doi:10.1371/journal.pgen.1005487.g001
15 Novel Loci of Urinary Human Metabolic Individuality
the FOCUS package [13]. This resulted in NMR signal intensities at 166 distinct spectral posi-tions (“chemical shifts”) per sample (seeMethods). In previous mGWAS, we demonstrated the potential of testing pairwise ratios of metabolite concentrations to boost genetic association sig-nals [1,4,6,8,10,21,53]. Recently, we showed that this approach can also be successfully applied to NMR-based mGWAS with non-targeted features [22]. Thus, we calculated the pair-wise ratios of all metabolite concentrations with at least 300 valid data points over all samples (55×54/2 = 1,485 ratios of targeted traits) and NMR signal intensities (166×165/2 = 13,695 ratios of non-targeted traits), respectively (Fig 1A). Out of all 15,401 metabolic features (tar-geted and non-tar(tar-geted traits and the ratios thereof), a total of 15,379 features with at least 300 valid data points were screened for genetic associations using 620,456 genotyped autosomal SNPs (Fig 1B). To this end, we computed age- and sex-adjusted linear models under the assumption of additive genetic effects for each SNP-metabolic trait pair. A total of 499 geno-typed variants display associations with metabolic traits withP-values below 5×10⁻⁸.
Fine-mapping of chromosomal regions with associated variants
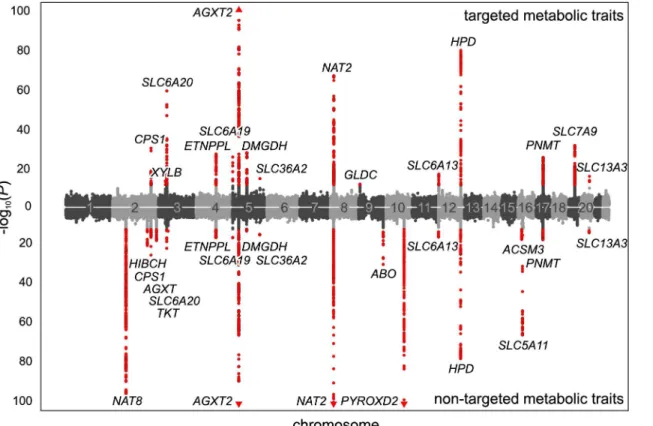
We used the 499 variants identified in the mGWAS to tag 54 distinct chromosomal regions at a window size of at least 2 Mb (centered to the tag SNPs). We then performed additional asso-ciation studies using imputed variants (1000 genomes project imputation) in the tagged regions (Fig 1B). We considered associations with aP-value below the Bonferroni-adjusted significance Fig 2. Manhattan plot of genetic associations to targeted and non-targeted traits.SNPs are plotted according to chromosomal location and the-log10
transformedP-value of the strongest association with targeted traits (top) and non-targeted traits (bottom). In case of associations with ratios, only associations withP-gain exceeding 15,180 (targeted metabolic traits) or 138,610 (non-targeted traits) were considered. Associations of genome-wide significance (P<3.25×10⁻¹²) are plotted in red. Triangles indicate associations withP<1.0×10−100. Significant associations within a physical distance of 1
Mb were assigned to a locus labeled after the most likely causative gene (as determined using an evidence-based approach for the identification of candidate genes; seeMethods).
doi:10.1371/journal.pgen.1005487.g002
15 Novel Loci of Urinary Human Metabolic Individuality
threshold ofα’= 5×10⁻⁸/15,379 = 3.25×10⁻¹²to be genome-wide significant. For ratio traits, we also required theP-gain to be greater than 1.52×10⁴for targeted traits and 1.38×10⁵for non-targeted traits (10 times the number of tested traits [53]).P-gain reflects the increase of association strength with the ratio trait when compared to theP-values that result from associ-ations with the individual traits buildinging the ratio. A total of 2,882 genotyped or imputed SNPs display association signals belowP<3.25×10⁻¹²and, in case of ratios, above the imposed
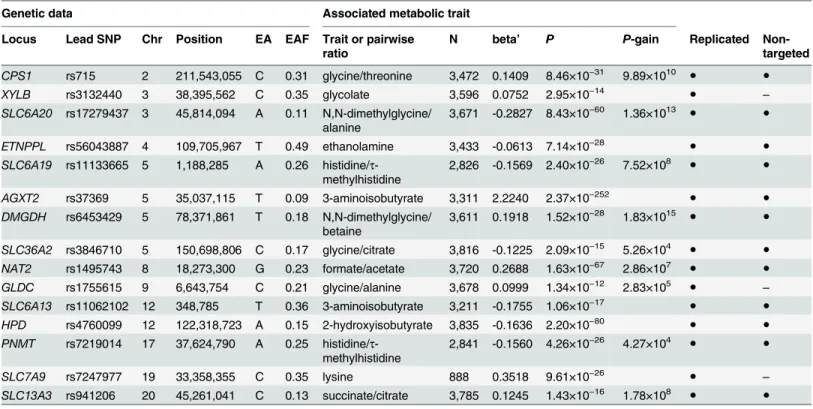
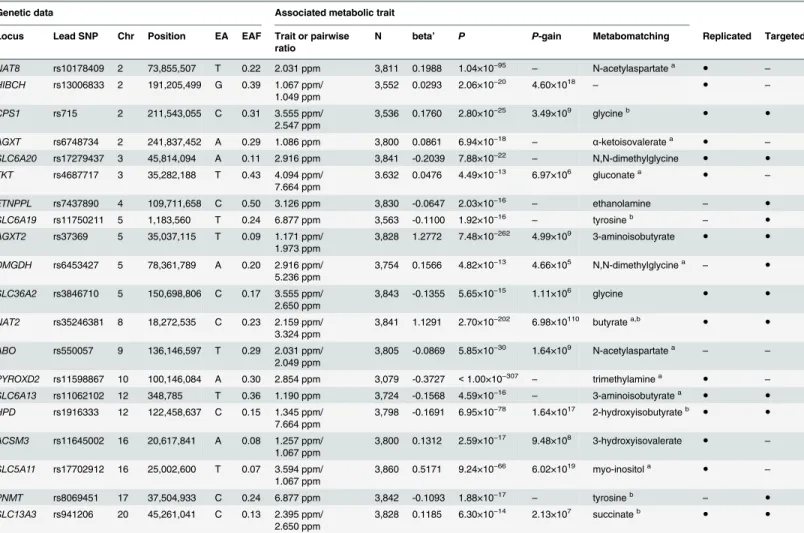
P-gain threshold (Fig 2). All significantly associated SNPs within a physical distance of 1 Mb were assigned to one of 23 distinct genetic loci. Three loci display significant association signals only when imputed SNPs were used, and 8 loci show significant associations only when pair-wise ratios of metabolic traits were considered. Twelve loci show significant associations in both targeted and non-targeted data sets. Three loci are only significantly associated with tar-geted traits (i.e., quantified metabolite concentrations or ratios thereof), whereas 8 loci are only significantly associated with non-targeted traits (spectral features or ratios thereof) (Fig 3). For each locus, we list the SNP that displays the strongest association signal (lead SNP) and its associated metabolic trait in Tables1and2. In addition, we provide boxplots, regional Table 1. Fifteen genetic loci as discovered in the SHIP-0 data set and their most significant associations to targeted metabolic traits.
Genetic data Associated metabolic trait
Locus Lead SNP Chr Position EA EAF Trait or pairwise ratio
N beta’ P P-gain Replicated
Non-targeted
CPS1 rs715 2 211,543,055 C 0.31 glycine/threonine 3,472 0.1409 8.46×10⁻³¹ 9.89×10¹⁰ ● ●
XYLB rs3132440 3 38,395,562 C 0.35 glycolate 3,596 0.0752 2.95×10⁻¹⁴
● –
SLC6A20 rs17279437 3 45,814,094 A 0.11 N,N-dimethylglycine/ alanine
3,671 -0.2827 8.43×10−60 1.36×10¹³
● ●
ETNPPL rs56043887 4 109,705,967 T 0.49 ethanolamine 3,433 -0.0613 7.14×10⁻²⁸
● ●
SLC6A19 rs11133665 5 1,188,285 A 0.26 histidine/τ
-methylhistidine
2,826 -0.1569 2.40×10⁻²⁶ 7.52×10⁸
● ●
AGXT2 rs37369 5 35,037,115 T 0.09 3-aminoisobutyrate 3,311 2.2240 2.37×10−252
● ●
DMGDH rs6453429 5 78,371,861 T 0.18 N,N-dimethylglycine/ betaine
3,611 0.1918 1.52×10⁻²⁸ 1.83×10¹⁵ ● ●
SLC36A2 rs3846710 5 150,698,806 C 0.17 glycine/citrate 3,816 -0.1225 2.09×10⁻¹⁵ 5.26×10⁴ ● ●
NAT2 rs1495743 8 18,273,300 G 0.23 formate/acetate 3,720 0.2688 1.63×10−67 2.86×10⁷
● ●
GLDC rs1755615 9 6,643,754 C 0.21 glycine/alanine 3,678 0.0999 1.34×10⁻¹² 2.83×10⁵
● –
SLC6A13 rs11062102 12 348,785 T 0.36 3-aminoisobutyrate 3,211 -0.1755 1.06×10⁻¹⁷
● ●
HPD rs4760099 12 122,318,723 A 0.15 2-hydroxyisobutyrate 3,835 -0.1636 2.20×10−80 ● ●
PNMT rs7219014 17 37,624,790 A 0.25 histidine/τ
-methylhistidine
2,841 -0.1560 4.26×10⁻²⁶ 4.27×10⁴
● ●
SLC7A9 rs7247977 19 33,358,355 C 0.35 lysine 888 0.3518 9.61×10⁻²⁶
● –
SLC13A3 rs941206 20 45,261,041 C 0.13 succinate/citrate 3,785 0.1245 1.43×10⁻¹⁶ 1.78×10⁸
● ●
Chr/Position: Chromosomal location of the SNP according to the human reference genome (GRCh37).EA/EAF: Effect allele and frequency.Trait or pairwise ratio: Tested metabolic trait. In case of ratios, the trait that shows the stronger association signal is in the numerator.N: Number of samples for which both genotype and phenotype data were available for the tested SNP/metabolic trait pair.beta’: beta’is defined as 10beta-1 where beta depicts the
relative effect size representing the slope of the regression line in the linear model when using log10-scaled metabolic traits and the occurrence of the
SNP’s minor allele (coded as 0,1, and 2). Thus, beta’describes the relative difference per minor allele copy for non-scaled metabolic traits in comparison to the estimated mean of the metabolic trait in the major homozygote test subjects.P-gain: Defined as min(P(M1)/P(M1/M2),P(M2)/P(M1/M2)), where M1
and M2represent the two traits of which the ratio M1/M2is built.Replicated: SNP/metabolic trait pair was replicated in KORA F4 (P<1.32×10⁻³) (S1 Table).Non-targeted: SNP or proxy in linkage disequilibrium (LD) is also associated with a non-targeted metabolic trait (P<3.25×10⁻¹²) (Table 2).
doi:10.1371/journal.pgen.1005487.t001
15 Novel Loci of Urinary Human Metabolic Individuality
association plots, and Q-Q plots for each locus inS2 Fig. The summary statistics for all associa-tion signals withP<0.05 (P<1×10⁻⁴andP-gain10 for associations with ratios) for each tested SNP can be downloaded fromhttp://www.gwas.eu.
Systematic assignment of loci to genes and annotation of non-targeted
metabolic traits
In general, the biological interpretation of association results from mGWAS requires the map-ping of SNPs to candidate genes that are most likely causally linked to the observed changes in Table 2. Twenty genetic loci as discovered in the SHIP-0 data set and their most significant associations to non-targeted metabolic traits.
Genetic data Associated metabolic trait
Locus Lead SNP Chr Position EA EAF Trait or pairwise ratio
N beta’ P P-gain Metabomatching Replicated Targeted
NAT8 rs10178409 2 73,855,507 T 0.22 2.031 ppm 3,811 0.1988 1.04×10−95 – N-acetylaspartatea ● – HIBCH rs13006833 2 191,205,499 G 0.39 1.067 ppm/
1.049 ppm
3,552 0.0293 2.06×10⁻²⁰ 4.60×10¹⁸
– ● –
CPS1 rs715 2 211,543,055 C 0.31 3.555 ppm/ 2.547 ppm
3,536 0.1760 2.80×10⁻²⁵ 3.49×10⁹ glycineb ● ●
AGXT rs6748734 2 241,837,452 A 0.29 1.086 ppm 3,800 0.0861 6.94×10⁻¹⁸
– α-ketoisovaleratea ● –
SLC6A20 rs17279437 3 45,814,094 A 0.11 2.916 ppm 3,841 -0.2039 7.88×10⁻²² – N,N-dimethylglycine ● ●
TKT rs4687717 3 35,282,188 T 0.43 4.094 ppm/ 7.664 ppm
3.632 0.0476 4.49×10⁻¹³ 6.97×10⁶ gluconatea
● –
ETNPPL rs7437890 4 109,711,658 C 0.50 3.126 ppm 3,830 -0.0647 2.03×10⁻¹⁶ – ethanolamine – ●
SLC6A19 rs11750211 5 1,183,560 T 0.24 6.877 ppm 3,563 -0.1100 1.92×10⁻¹⁶
– tyrosineb
– ●
AGXT2 rs37369 5 35,037,115 T 0.09 1.171 ppm/
1.973 ppm
3,828 1.2772 7.48×10−262 4.99×10⁹ 3-aminoisobutyrate ● ●
DMGDH rs6453427 5 78,361,789 A 0.20 2.916 ppm/ 5.236 ppm
3,754 0.1566 4.82×10⁻¹³ 4.66×10⁵ N,N-dimethylglycinea
– ●
SLC36A2 rs3846710 5 150,698,806 C 0.17 3.555 ppm/ 2.650 ppm
3,843 -0.1355 5.65×10⁻¹⁵ 1.11×10⁶ glycine ● ●
NAT2 rs35246381 8 18,272,535 C 0.23 2.159 ppm/ 3.324 ppm
3,841 1.1291 2.70×10−202 6.98×10110 butyratea,b
● ●
ABO rs550057 9 136,146,597 T 0.29 2.031 ppm/ 2.049 ppm
3,805 -0.0869 5.85×10⁻³⁰ 1.64×10⁹ N-acetylaspartatea – –
PYROXD2 rs11598867 10 100,146,084 A 0.30 2.854 ppm 3,079 -0.3727 <1.00×10−307
– trimethylaminea
● –
SLC6A13 rs11062102 12 348,785 T 0.36 1.190 ppm 3,724 -0.1568 4.59×10⁻¹⁶ – 3-aminoisobutyratea ● ●
HPD rs1916333 12 122,458,637 C 0.15 1.345 ppm/ 7.664 ppm
3,798 -0.1691 6.95×10−78 1.64×10¹⁷ 2-hydroxyisobutyrateb
● ●
ACSM3 rs11645002 16 20,617,841 A 0.08 1.257 ppm/ 1.067 ppm
3,800 0.1312 2.59×10⁻¹⁷ 9.48×10⁸ 3-hydroxyisovalerate ● –
SLC5A11 rs17702912 16 25,002,600 T 0.07 3.594 ppm/ 1.067 ppm
3,860 0.5171 9.24×10−66 6.02×10¹⁹ myo-inositola
● –
PNMT rs8069451 17 37,504,933 C 0.24 6.877 ppm 3,842 -0.1093 1.88×10⁻¹⁷ – tyrosineb – ● SLC13A3 rs941206 20 45,261,041 C 0.13 2.395 ppm/
2.650 ppm
3,828 0.1185 6.30×10⁻¹⁴ 2.13×10⁷ succinateb
● ●
aalternative candidates for metabomatching exist (S1 Fig)
badditional candidates match to other non-targeted traits that also associate with SNP (S1 Fig)
Chr/Position: Chromosomal location of the lead SNP according to the human reference genome (GRCh37).EA/EAF: Effect allele and frequency.Trait or pairwise ratio: Tested metabolic trait (chemical shift). In case of ratios, the trait that drives the association (i.e., shows the stronger association signal) is namedfirst.N: Number of samples where both genotype and phenotype data were available for the tested SNP/metabolic trait pair.beta’: beta’is defined as 10beta-1 where beta depicts the relative effect size representing the slope of the regression line in the linear model when using log
10-scaled metabolic
traits and the occurrence of the SNP’s minor allele (coded as 0,1, and 2). Thus, beta’describes the relative difference per minor allele copy for non-scaled metabolic traits in comparison to the estimated mean of the metabolic trait in the major homozygote test subjects.P-gain: Defined as min(P(M1)/P(M1/M2),
P(M2)/P(M1/M2)), where M1and M2represent the two traits of which the ratio M1/M2is built.Metabomatching: Annotation of the non-targeted metabolic
trait at the given chemical shift as suggested by metabomatching (S1 Fig).Replicated: SNP/metabolic trait pair was replicated in KORA F4 (P<
1.32×10⁻³) (S2 Table).Targeted: SNP or proxy in LD is also associated with a targeted metabolic trait (P
<3.25×10⁻¹²) (Table 1).
doi:10.1371/journal.pgen.1005487.t002
15 Novel Loci of Urinary Human Metabolic Individuality
the metabotype. Furthermore, non-targeted metabolic traits that exhibit significant association signals have to be assigned to distinct metabolites. In our study, we implemented algorithmic approaches for both the locus-to-gene mapping and the assignment of non-targeted metabolic features.
As the first step in the candidate gene selection, we assigned the significantly associated SNPs to distinct loci using a physical distance threshold of 1Mb. Assigning variants within a locus to one of the covered genes based only on proximity or plausibility ignores haploblock structure and existing regulatory information for the SNPs such as expression quantitative trait loci (eQTL). To take such information into account and to achieve an unbiased selection of candidate genes, we collected evidence for each significantly associated SNP and its proxies in strong linkage disequilibrium (LD) using the SNiPA web server [51]. For each locus, we received a list of candidate genes that are linked to one or more associated variants (or a proxy in LD). Thereby, genes are linked via genomic proximity (i.e., if any of the variants is located within the candidate gene or is in close proximity), via eQTL associations (i.e., if any of the var-iants is associated with expression levels of the gene in a previous eQTL study), or via regula-tory element association (i.e., if any of the variants is contained in a promoter/enhancer/ repressor element that is associated with the gene). Moreover, missense variants or known pathogenic variants in the locus are considered to provide additional types of evidence for the linked genes. We finally assigned the locus to the gene with the strongest functional evidence (i.e., the gene showing the highest number of different types of evidences (max. 5) among the Fig 3. Loci with associated urinary metabolic traits and their overlap with previous mGWAS in blood and urine.We identified and replicated genome-wide significant associations between metabolic traits and genetic variants in 22 genetic loci (named after the most likely causative gene). Three loci could only be identified using targeted metabolic traits, while 7 loci were exclusively discovered with non-targeted traits. 12 loci were identified using both targeted and non-targeted approaches. Loci with hitherto unknown
associations with urinary metabolic traits are highlighted (totaling 15). We identified and replicated significant associations in 7 of the 11 loci that were reported in previous mGWAS in urine [5,10–12]. We also discovered significant associations of theABOlocus (marked with an asterisk) with non-targeted traits, but this locus could not be replicated in KORA F4. When compared to previous mGWAS in blood, we find 14 loci that display associations with metabolic traits in both urine and blood [1,4,6–8,14–24].
doi:10.1371/journal.pgen.1005487.g003
15 Novel Loci of Urinary Human Metabolic Individuality
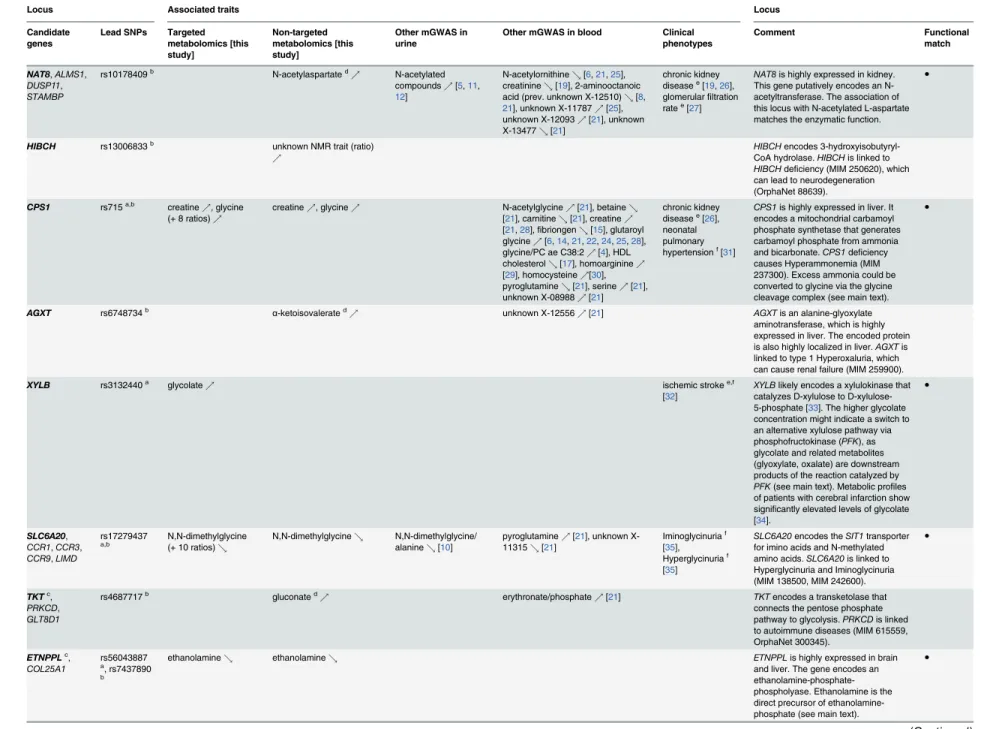
Table 3. Twenty-two identified and replicated loci and their overlap with associations to metabolic traits and clinical phenotypes.
Locus Associated traits Locus
Candidate genes
Lead SNPs Targeted metabolomics [this study]
Non-targeted metabolomics [this study]
Other mGWAS in urine
Other mGWAS in blood Clinical phenotypes
Comment Functional
match
NAT8,ALMS1, DUSP11, STAMBP
rs10178409b N-acetylaspartated
% N-acetylated compounds%[5,11,
12]
N-acetylornithine&[6,21,25], creatinine&[19], 2-aminooctanoic acid (prev. unknown X-12510)&[8,
21], unknown X-11787%[25], unknown X-12093%[21], unknown X-13477&[21]
chronic kidney diseasee[19,26],
glomerularfiltration ratee[27]
NAT8is highly expressed in kidney. This gene putatively encodes an N-acetyltransferase. The association of this locus with N-acetylated L-aspartate matches the enzymatic function.
●
HIBCH rs13006833b unknown NMR trait (ratio) %
HIBCHencodes 3-hydroxyisobutyryl-CoA hydrolase.HIBCHis linked to HIBCHdeficiency (MIM 250620), which can lead to neurodegeneration (OrphaNet 88639).
CPS1 rs715a,b creatine
%, glycine (+ 8 ratios)%
creatine%, glycine% N-acetylglycine%[21], betaine&
[21], carnitine&[21], creatine%
[21,28],fibriongen&[15], glutaroyl glycine%[6,14,21,22,24,25,28], glycine/PC ae C38:2%[4], HDL cholesterol&[17], homoarginine%
[29], homocysteine%[30], pyroglutamine&[21], serine%[21], unknown X-08988%[21]
chronic kidney diseasee[26],
neonatal pulmonary hypertensionf[31]
CPS1is highly expressed in liver. It encodes a mitochondrial carbamoyl phosphate synthetase that generates carbamoyl phosphate from ammonia and bicarbonate.CPS1deficiency causes Hyperammonemia (MIM 237300). Excess ammonia could be converted to glycine via the glycine cleavage complex (see main text).
●
AGXT rs6748734b α-ketoisovalerated% unknown X-12556%[21] AGXTis an alanine-glyoxylate
aminotransferase, which is highly expressed in liver. The encoded protein is also highly localized in liver.AGXTis linked to type 1 Hyperoxaluria, which can cause renal failure (MIM 259900).
XYLB rs3132440a glycolate% ischemic strokee,f
[32]
XYLBlikely encodes a xylulokinase that catalyzes D-xylulose to D-xylulose-5-phosphate [33]. The higher glycolate concentration might indicate a switch to an alternative xylulose pathway via phosphofructokinase (PFK), as glycolate and related metabolites (glyoxylate, oxalate) are downstream products of the reaction catalyzed by PFK(see main text). Metabolic profiles of patients with cerebral infarction show significantly elevated levels of glycolate [34].
●
SLC6A20, CCR1,CCR3, CCR9,LIMD
rs17279437
a,b
N,N-dimethylglycine (+ 10 ratios)&
N,N-dimethylglycine& N,N-dimethylglycine/ alanine&[10]
pyroglutamine%[21], unknown X-11315&[21]
Iminoglycinuriaf
[35], Hyperglycinuriaf
[35]
SLC6A20encodes theSIT1transporter for imino acids and N-methylated amino acids.SLC6A20is linked to Hyperglycinuria and Iminoglycinuria (MIM 138500, MIM 242600).
●
TKTc, PRKCD, GLT8D1
rs4687717b gluconated
% erythronate/phosphate%[21] TKTencodes a transketolase that
connects the pentose phosphate pathway to glycolysis.PRKCDis linked to autoimmune diseases (MIM 615559, OrphaNet 300345).
ETNPPLc, COL25A1
rs56043887
a, rs7437890 b
ethanolamine& ethanolamine& ETNPPLis highly expressed in brain
and liver. The gene encodes an ethanolamine-phosphate-phospholyase. Ethanolamine is the direct precursor of ethanolamine-phosphate (see main text).
Table 3. (Continued)
Locus Associated traits Locus
Candidate genes
Lead SNPs Targeted metabolomics [this study]
Non-targeted metabolomics [this study]
Other mGWAS in urine
Other mGWAS in blood Clinical phenotypes
Comment Functional
match
SLC6A19c, SLC6A18
rs11133665
a,
rs11750211b
histidine (+ 3 ratios)
&, tyrosine (+ 1 ratio)
&
tyrosine& SLC6A18andSLC6A19encode
transporters for neutral amino acids in kidney. Both genes are linked to Iminoglycinuria [MIM 242600, OrphaNet 42062];SLC6A19is linked to Hyperglycinuria (MIM 138500) and Hartnup disorder (MIM 234500).
AGXT2, DNAJC21, PRLR,RAD1
rs37369a,b 3-aminoisobutyrate% 3-aminoisobutyrate% 3-aminoisobutyrate%
[5,10,12]
3-aminoisobutyrate%[28], symmetric/asymmetric dimethylarginine%[20], homoarginine&[29]
heart rate variabilitye[20]
AGXT2expression is enriched in brain and liver. It catalyzes the biosynthesis of 3-aminoisobutyrate. The non-synonymous variant rs37369 is most likely causative for
Beta-aminoisobutyric aciduria (MIM 21010) [10,36].
●
DMGDH, BHMT,ARSB
rs6453429a,
rs6453427b N,N-dimethylglycine(+ 5 ratios) %
N,N-dimethylglycined% betaine&[21], dimethylglycine%
[24,28], selenium%[18]
DMGDHexpression is highly enriched in kidney and liver, and so is the gene product.DMGDHencodes dimethylglycine dehydrogenase. DMGDHdeficiency causesfish-like body odor (MIM 605850). In the same locus,BHMTcatalyzes N,N-dimethylglycine and L-methionine to betaine and homocysteine (EC 2.1.1.5).
●
SLC36A2 rs3846710
a,b glycine/citrate
& glycine& SLC36A2expression is enriched in
kidney. The gene encodes a transporter (PAT2) for small amino acids (including glycine). Like SLC6A20,SLC36A2is linked to Hyperglycinuria and Iminoglycinuria (MIM 138500, MIM 242600).
●
NAT2,ASAH1, PCM1
rs1495743a,
rs35246381b formate (+ 8 ratios)% formate%, butyrate d
%, acetylcarnitined
%, N-acetylputrescined%,τ
-methylhistidined&,
1,3-dimethylurated &
formate/succinate%
[10], unknown NMR trait%[12]
4-acetamidobutanoate%[21], 1-methylurate&[21], 1-methylxanthine&[21], total cholersterol%[17,37], triglycerides
%[17,37]
bladder cancere
[38,39], drug response (slow acetylation)f[40 –
43]
NAT2encodes an arylamine N-acetyltransferase.NAT2is linked to speed of acetylation (MIM 243400).
●
GLDC rs1755615a glycine/alanine% GLDCencodes the mitochondrial
glycine dehydroxygenase (decarboxylating), which is part of the glycine cleavage system. Mutations in GLDCcan cause glycine
encephalopathy (MIM 605899).GLDC expression is enriched in kidney and liver.
●
PYROXD2, HPS1
rs11598867b trimethylamined
& trimethylamine&[5,
11,12], unknown NMR trait&[12]
1-methyl-2-piperidine carboxylic acid (prev. unknown X-12092)&[8,21], caprolactam [16], asymmetric dimethylarginine&[28], dimethylamine&[5], unknown NMR trait&[22], unknown X-12093&[8,
21]
Hermansky-Pudlak syndrome If[44]
PYROXD2codes for“pyridine nucleotide-disulphide oxidoreductase domain 2”.
SLC6A13 rs11062102
a,b
3-aminoisobutyrate (+ 1 ratio)&
3-aminoisobutyrated& 3-aminoisobutyrate&[28],
pyroglutamine&[21]
chronic kidney diseasee[26]
SLC6A13is highly expressed in kidney. It encodesGAT2that transports betaine, which serves as an osmolyte in kidney, and gamma-aminobutyric acid (GABA).SLC6A13might also be a transporter for 3-aminoisobutyrate, which has a similar chemical structure to betaine and GABA.
Table 3. (Continued)
Locus Associated traits Locus
Candidate genes
Lead SNPs Targeted metabolomics [this study]
Non-targeted metabolomics [this study]
Other mGWAS in urine
Other mGWAS in blood Clinical phenotypes
Comment Functional
match
HPD,WDR66, PSMD9
rs4760099a,
rs1916333b
2-hydroxyisobutyrate
&
2-hydroxyisobutyrate& 2-hydroxyisobutyrate
&[10,12]
2-hydroxyisobutyrate&[21] Tyrosinemiaf[45],
Hawkinsuriaf[45], HPDdeficiencyf
[45]
TheHPDgene product catalyzes 4-hydroxyphenylpyruvate to homogentisate. 2-hydroxyisobutyrate may be related to branched chain amino acid degradation metabolites. HPDis linked to type 3 Tyrosinemia (MIM 276710) and Hawkinsuria (MIM 140350).HPDis highly expressed and localized in liver and kidney.
ACSM3c, ACSM1
rs11645002b 3-hydroxyisovalerate
% TheACSM3gene product (aliasSaor
SAH) is an acyl-CoA synthetase medium-chain family member.
“Isobutyrate is the most preferred fatty acid among C2-C6 fatty acids forSa protein.”[46] To lesser extent,ACSM3 shows substrate specificity for the C5 fatty acid isovalerate [46]. It is estimated thatACSM3acts on“acids from C4 to C11 and on the corresponding 3-hydroxy (. . .) unsaturated acids”(UniProt Q53FZ2). ACSM3is suspected to be a risk locus for overweight and hypertension (MIM 145505).
●
SLC5A11, ARHGAP17, TNRC6A
rs17702912b myo-inositold% myo-inositol&[21], scyllo-inositol&
[21]
SLC5A11is short for solute carrier family 5 sodium/myo-inositol transporter, member 11 (see main text).
●
PNMT,MED1, PPP1RB, STARD3
rs7219014a,
rs8069451b
histidine (+ 1 ratio)&, tyrosine&
tyrosine& HDL cholesterol&[17,37] rheumatoid arthritis
e[47], reduced PNMTactivityf[48]
PNMTcodes for phenylethanolamine N-methyltransferase and is part of tyrosine metabolism (EC 2.1.1.28).
● SLC7A9, C19orf40, CEP89, RHPN2, TDRD12
rs7247977a lysine (+ 8 ratios)% lysine/valine%[10],
lysine%[12]
homocitrulline&[21], NG-monomethyl-arginine&[28]
chronic kidney diseasee[26]
Table 3. (Continued)
Locus Associated traits Locus
Candidate genes
Lead SNPs Targeted metabolomics [this study]
Non-targeted metabolomics [this study]
Other mGWAS in urine
Other mGWAS in blood Clinical phenotypes
Comment Functional
match
SLC13A3, SLC2A10
rs941206a,b succinate/citrate
% succinate% SLC13A3is a high-affinity
dicarboxylate transporter that mediates the transport of succinate [49]. It is highly expressed in kidney.
●
aSNP with the strongest association to targeted metabolic traits (
“lead SNP”) bSNP with the strongest association to non-targeted metabolic traits
cmanually added to the list of most plausible candidate genes derived by evidence-based selection
dadditional candidates match to other non-targeted traits that also associate with the lead SNP
eresults from GWAS (P<5.0×10⁻⁸)
fmutations determined in clinical studies
For each locus, we selected all variants that displayed genome-wide significant association signals to metabolic traits in the SHIP-0 cohort. We added their proxy variants in LD (r2
0.8; based on 1000 genomes project data [50,51]). These variant sets were used for the selection of candidate genes and the comparison with association results from other studies.Candidate genes:selection of genes based on variant evidence (genes hit or close-by, eQTL, potentially regulatory effects, or missense variants) (S3 Table). Genes with the highest evidence counts are listed. Genes with the most plausible biochemical relation to the associated trait are highlighted in bold typeface.Associated traits: Targeted/non-targeted metabolomics: traits that display genome-wide significant association signals in SHIP-0. The arrows indicate whether the trait increases (%) or decreases (&) per copy of the effect allele. For non-targeted traits, the most plausible metabolite candidates according to metabomatching are given.Other mGWAS in urine/blood:metabolic traits that were previously found to be associated with a locus variant. The arrows indicate the directionality of the effect for the reported effect allele (where available).Clinical phenotypes: overlap with variants found to be associated with clinical traits.Comment: Gene expression rates were taken from the Illumina Body Map 2.0 (S4 Table). Protein localizations were taken from the Human Protein Atlas (version 12) [52]. For genes linked to clinical traits, we provide OMIM or OrphaNet accession numbers if available.Functional match: Indicates which associations exhibit a sound biological link between gene function and the biochemical nature of the associated metabolite(s).
doi:10.1371/journal.pgen.1005487.t003
15
Novel
Loci
of
Urinary
Human
Metabolic
Individu
ality
PLOS
Genetic
s
|DOI:10.13
71/journal.
pgen.10054
87
Septemb
er
9,
2015
12
candidate genes; seeMethods). In case of ambiguous assignments, the gene with the most plau-sible biological function was chosen. As an example, one locus contains a high number of SNPs with strong associations with non-targeted traits corresponding to N-acetylated compounds. These SNPs cover 12 different genes (see regional association plots inS2 Fig). The gene covered by the highest number of SNPs isALMS1. However, there are 3 more genes in this locus with the same amount of functional evidence count asALMS1(S3 Table). One of these genes is
NAT8, which encodes an N-acetyltransferase. Since there is a biologically meaningful link between the function of theNAT8gene product and the associated metabolic traits, we anno-tated this locus withNAT8as the most likely candidate gene. According to our evidence-based candidate genes assignment approach, the 23 loci map to the genesNAT8,HIBCH,CPS1,
AGXT,XYLB,SLC6A20,TKT,ETNPPL,SLC6A19,AGXT2,DMGDH,SLC36A2,NAT2,ABO,
GLDC,PYROXD2,SLC6A13,HPD,ACSM3,SLC5A11,PNMT,SLC7A9, andSLC13A3.S3 Tableprovides a complete list of candidate genes and the corresponding collected evidences.
For the identification of metabolites underlying non-targeted NMR traits, we used pseudo-spectra that display the strength of associations of a given SNP across the complete NMR spec-trum [12,22]. If the association is strong enough, these“association spectra”often exhibit a striking similarity to the reference NMR spectrum of the underlying metabolite(s). For the present study, we applied the“metabomatching”method introduced by Rueediet al. [12] to perform an automated annotation of the association spectra for each genetic locus of interest. For 19 of the 20 loci that display significant associations with non-targeted traits, metabo-matching suggests plausible metabolite candidates metabo-matching signals present in the association spectra (S1 Fig). For 10 of these 19 loci (CPS1,SLC6A20,ETNPPL,SLC6A19,AGXT2,
SLC36A2,HPD,ACSM3,PNMT, andSLC13A3), the match between the association signal and the NMR spectrum of the candidate metabolite (as provided by the Urine Metabolome Data-base [54]) is strong and unique, which makes the assignment of a metabolite identity to a non-targeted trait unambiguous in these cases.
Replication
To replicate our findings, we used genotype data and urine samples from participants of the KORA F4 cohort (N = 1,691). From recorded1H NMR spectra of the urine samples, we derived the targeted and non-targeted metabolic traits (metabolite concentrations, NMR spectral fea-tures, and the respective pairwise ratios) as for the discovery study. For 14 of the 15 new loci that show significant associations with targeted metabolic traits in the SHIP-0 data set, the top-ranking SNP/metabolic trait association replicates in KORA F4 (S1 Table). For theSLC7A9
locus, the association with lysine/valine does not replicate, possibly due to the difficulty in annotating lysine from the NMR spectra (>75% missing values for lysine). However, the
sec-ond-best, still genome-wide significant association of the tested SNP with valine replicates. For 15 of 20 loci that display significant association signals in the GWAS with non-targeted traits, we were able to replicate the best SNP/NMR trait association or, if this failed, the next, still sig-nificant follow-up association (S2 Table). The failure to replicate the remaining 5 loci might be due to the lower sample size in KORA, due to different fasting states of the subjects in the dif-ferent cohorts, or due to a less perfect alignment of the NMR spectra, since we chose the same FOCUS parameters for aligning SHIP and KORA spectra instead of treating them separately. However, 4 of these 5 loci (ETNPPL,SLC6A19,DMGDH,PNMT) show also significant associa-tions in the targeted SHIP-0 data set that replicate in the targeted KORA F4 data set (Table 1). Out of the 23 loci identified in the discovery study,ABOis the only locus that could not be rep-licated using either a targeted or a non-targeted metabolic trait in KORA F4, leaving 22 loci that display stable associations with metabolic traits in urine.
15 Novel Loci of Urinary Human Metabolic Individuality
Overlap with previous mGWAS in urine and blood
We evaluated each identified and replicated locus in the light of previously reported associa-tions with metabolic phenotypes and clinical traits. To this end, we selected all SNPs within a locus for which we found genome-wide significant associations with any urinary metabolic trait in the SHIP-0 cohort. Furthermore, we added all bi-allelic variants from the 1000 genomes project [50] (phase 1, version 3, European ancestry) that are in strong LD to these SNPs (r2
0.8).
For 15 of the 22 loci, no associations with urinary metabolic traits were reported so far (HIBCH,CPS1,AGXT,XYLB,TKT,ETNPPL,SLC6A19,DMGDH,SLC36A2,GLDC,SLC6A13,
ACSM3,SLC5A11,PNMT, andSLC13A3) (Fig 3,Table 3). The remaining 7 loci were already identified in our previous urine mGWAS (AGXT2,HPD,SLC7A9,SLC6A20, andNAT2) [10] or in the studies by Nicholsonet al. [5] and Rueediet al. [12] (NAT8andPYROXD2). For all 7 loci, both trait association and direction of the observed effect are consistent with the results previously published.
We further compared our association results with those of published mGWAS with meta-bolic traits in blood (P<5×10⁻⁸), including all studies listed in the NHGRI GWAS catalog [23] and other studies such as the mGWAS by Shinet al., which is based on metabolomics data from the KORA F4 and TwinsUK cohorts [1,4,6–8,14–22,24]. In total, 14 loci show signifi-cant associations with metabolic traits both in blood in one of these mGWAS and in urine in our study (Fig 3,Table 3). For 3 of these 14 loci (SLC6A20,PNMT,AGXT), we consider the associated metabolic traits in both media to be unrelated. In 5 cases (NAT2,NAT8,PYROXD2,
SLC7A9,TKT), the genetic association analyses identified different, but related metabolites (i.e., the associated metabolites from urine and blood are either products/substrates of the locus’candidate gene product, or are biochemically converted within another known enzy-matic reaction, or belong to the same metabolite class). In 6 cases, the associations target the same metabolites in urine and blood (CPS1,AGXT2,DMGDH,SLC6A13,HPD,SLC5A11). For 5 of these 6 loci, the direction of the observed effect is the same, whereas forSLC5A11(associated withmyo-inositol), we observe an increase in urinary metabolite concentration per copy of the effect allele, as opposed to decreased levels reported in blood (Table 3). For this locus, we addi-tionally investigated whether the effects seen in blood and urine are directly coupled. To this end, we made use ofmyo-inositol levels (normalized to circulating creatinine) measured through mass spectrometry (MS) in blood serum samples of the same KORA F4 participants [6] that form the replication cohort in this study. The ratio between the urinarymyo-inositol (this study) and the serummyo-inositol levels shows an increase in association strength to the lead SNP in
SLC5A11(rs17702912) by seven orders of magnitude in comparison to the association of urinary
myo-inositol alone (Purine<1.95×10⁻²⁴,Pblood<1.50×10⁻⁴,Pratio<2.43×10⁻³¹).
Overlap with disease-associated variants and risk genes
For 11 loci, our mGWAS identified significantly associated variants for which either the same variant or a proxy in strong LD was previously reported to be associated with clinical pheno-types according to data from the NHGRI GWAS catalog [23] (P<5×10⁻⁸), OMIM variation, ClinVar [55], HGMD [56], or dbGaP [57]. Amongst others, these variants have been linked to chronic kidney disease (NAT8,CPS1,SLC6A13, andSLC7A9), pulmonary hypertension (CPS1), ischemic stroke (XYLB), Iminoglycinuria (SLC6A20), heart rate variability (AGXT2), Hawkinsuria (HPD), and pharmacogenomically relevant acetylation phenotypes (NAT2) (Table 3). In addition to these 11 loci with disease-associated variants, we found previously dis-covered connections between clinical traits and the assigned candidate gene for another 7 loci (HIBCH,AGXT,SLC6A19,DMGDH,SLC36A2,GLDC,ACSM3).
15 Novel Loci of Urinary Human Metabolic Individuality
Discussion
In this study, we present the largest genome-wide association study with metabolic traits (mGWAS) in urine to date. In addition to quadrupling the sample size compared to previous mGWAS in urine, we analyzed both targeted traits (metabolite concentrations manually derived from NMR spectra) and non-targeted traits (NMR spectral features).
Fifteen new genetic loci linked to urinary metabolic traits
In total, we identified 23 genetic loci with significant associations between genetic variants and targeted or non-targeted metabolic traits in urine of SHIP-0 participants, 22 of which replicate in the independent KORA F4 cohort. To the best of our knowledge, 15 loci have not been linked to changes in the urine metabolome before. For the remaining 7 loci, our results are in line with the results from previous mGWAS in urine [5,10,12] regarding both the associated metabolic traits and the direction of the genetic effects (Table 3).
Targeted and non-targeted metabolomics are complementary
Though derived from the same NMR spectra, the list of GIMs identified with targeted traits and non-targeted traits partly differ. Of the 22 genetic loci reported in this study, only 12 loci were discovered in both targeted and non-targeted traits, whereas 7 loci show significant asso-ciations only with non-targeted traits, and 3 only with targeted traits (Fig 3andTable 3).
For the data set used in the targeted analysis, the NMR spectra were manually annotated to identify and quantify the metabolites underlying the spectra. Involving human expert knowl-edge usually allows metabolite identification with very high confidence and yields more precise quantification, especially if signals of multiple metabolites overlap in the NMR spectrum. Fur-thermore, a manual annotation can to some extent compensate for different experimental and sample conditions, as alignment and pre-processing can be optimized for each spectrum indi-vidually. As an example, lysine exhibits characteristic signals in the NMR spectral region betweenδ= 1.68 and 1.76 ppm, which is often dominated by signals from a variety of addi-tional metabolites, making the annotation of lysine a very difficult task. Thus, while lysine con-centrations could be determined for 888 samples of the discovery cohort through manual quantification and yielded a significant genetic association atSLC7A9, the non-targeted approach did not capture any association signals for this locus.
However, a manual spectral annotation as performed in the targeted analysis is quite labori-ous, which limits the number of quantifiable metabolites in large studies. This leads to a bias towards a certain set of metabolites and, as a consequence, significant associations actually present in the NMR data might be missed. Also, a manual annotation in general bears some risk of annotator-induced bias [58]. As an automated method, the non-targeted analysis of spectra has the potential to overcome some of the limitations of targeted analyses. Here, the most prominent example is thePYROXD2locus, where SNPs display exceptionally strong associations (P<1.0×10−307) to the NMR signal intensities atδ= 2.854 ppm. We could not identify any significant associations within this locus using the targeted data. Thus, we assumed that our set of targeted traits did not cover the metabolite(s) corresponding to these signals. The challenge with genetically associated non-targeted traits lies in the lack of biochemical interpretability. To facilitate the assignment of non-targeted NMR traits to chemical com-pounds, we applied the metabomatching algorithm introduced by Rueediet al. [12]. In case of
PYROXD2, metabomatching suggests that the associated NMR signals correspond to trimethy-lamine. Thereby, the automated method replicates the findings of Nicholsonet al. [5] where the authors manually annotated the associated signals based on expert knowledge. In case of our mGWAS with targeted traits, trimethylamine was not part of the metabolite panel and
15 Novel Loci of Urinary Human Metabolic Individuality
thus the association withPYROXD2could only be discovered using non-targeted metabolic traits in combination with the automated metabomatching processing. Of course, automated annotation of non-targeted traits also has its limitations: the annotation through metabo-matching relies on the association signals that genetic variants display over the NMR spectral range (“association spectra”) as well as on the existence of the relevant reference metabolite spectrum (seeMethodsandS1 Fig). In some cases, these association spectra are not meaningful enough to allow an unambiguous assignment of non-targeted features to metabolites, or they may be pointing to a metabolite not present in the reference set.
In summary, our study demonstrates that GWAS with NMR-determined metabolic traits can benefit from a combined application of both targeted and non-targeted metabolomics. Our results suggest that a targeted approach is better suited for the annotation of metabolites for which the corresponding NMR signals are in regions with a plethora of other signals as in some cases these signals cannot be resolved through non-targeted methods. Furthermore, genetic associations with targeted traits appear to be more robust, since 5 of the 12 loci that dis-play associations with both targeted and non-targeted traits clearly disdis-play stronger association signals in the targeted data set (several orders of magnitude in case of theSLC6A20locus; Tables1and2). However, the non-targeted metabolic traits provide a less biased view on the metabolome, which in our case results in additional significantly associated genetic loci.
Functional metabolomics: from GIMs to testable hypotheses
Fifteen of the 22 identified and replicated loci show a plausible biochemical connection between functionally annotated genes and their associated metabolic traits (Table 3). This is similar to observations from previous mGWAS. For instance, Shinet al. reported biologically meaningful links between metabolites and genetic loci for 101 of 145 GIMs [21]. In case of genes with vague functional annotations, gene-metabolite associations from mGWAS provide testable hypotheses for further gene characterization. As an example, Suhreet al. experimen-tally confirmed the mGWAS driven hypothesis ofSLC16A9being a carnitine transporter [6]. Vice versa, with the help of mGWAS, the chemical structure of a non-targeted metabolic trait was elucidated through the function of the associated gene [8].Another prominent finding of previous mGWAS is the overlap between disease relevant genetic variants and variants associated with metabolic traits. In the present study, we found 11 loci hosting variants that have previously been linked to clinical phenotypes. This includes associations with the estimated glomerular filtration rate (eGFR) and chronic kidney disease (CKD). Thus, the associated metabolites might, on the one hand, serve as intermediate traits for clinical endpoints. On the other hand, the associations might provide new insights regard-ing the involvement of specific metabolic pathways in pathomechanisms and the mediation of genetic risk loci through metabolic changes. For all 22 GIMs, we provide information on both the match of gene and metabolite function and the link to clinical traits inTable 3. In the fol-lowing, we exemplify the value of our results for the characterization of gene functions in the light of clinical phenotypes.
As a first example, we identified significant associations of variants upstream ofETNPPL
with ethanolamine. Interestingly, at the time when we received the first results from our associ-ation studies this gene was namedAGXT2L1and was assumed to encode an alanine-glyoxy-late-aminotransferase. Based on this gene annotation, there was no obvious relation to the associated metabolite ethanolamine. In such cases, only dedicated experiments (similar to the one for the carnitine/SLC16A9 association mentioned above [6]) could validate the connection of ethanolamine to the gene product. Meanwhile, Veiga-da-Cunhaet al. experimentally inves-tigated the locus in an independent study and found thatAGXT2L1actually encodes an
15 Novel Loci of Urinary Human Metabolic Individuality
ethanolaminephosphate-phospholyase [59]. As a consequence,AGXT2L1now carries the gene symbolETNPPL. As ethanolamine is a direct precursor of ethanolaminephosphate via ethanol-amine kinase (EC 2.7.1.28), our finding indeed matches the actual gene function. Besides the functional characterization of this locus, Veiga-da-Cunhaet al. suggest that theETNPPL -medi-ated degradation of ethanolaminephosphate balances the concentration of that metabolite in the central nervous system. They concluded that an altered ethanolaminephosphate homeosta-sis might contribute to mental disorders such as schizophrenia [59]. In line with this hypothe-sis, theETNPPLexpression rate in brain was previously found to be associated with
schizophrenia [60].ETNPPLis primarily expressed in brain and liver and the encoded protein is, amongst other tissues, highly localized in the cerebral cortex and the kidney (S4 Tableand The Human Protein Atlas [52],http://www.proteinatlas.org/ENSG00000164089/tissue). Our results suggest that an excess of ethanolamine in urine could indicate alterations in ethanolami-nephosphate homeostasis linked to a genetically reduced enzymatic activity ofETNPPL.
As a second example, we identified significant associations of genetic variants with 2-hydro-xyisobutyrate (2-HIBA) in a locus comprising 9 different genes. According to our evidence-based locus to gene assignment,4-hydroxyphenylpyruvate dioxygenase(HPD) is the most prob-able effector gene candidate. The association between 2-HIBA and this locus represents a well replicated finding: it was already identified in our previous NMR-based mGWAS in urine [10] and it has meanwhile also been discovered in an MS-based GWAS with blood metabolites [21]. Nonetheless, to the best of our knowledge, there is no obvious, known biological link between 2-HIBA and theHPDgene or any of the remaining 8 genes covered by this locus. In the litera-ture, 2-HIBA is often referred to as a secondary metabolite that can be found in urine of humans and rats exposed to the volatile gasoline additives methyl-tert-butylether and
ethyl-tert-butylether [61–63]. However, 2-HIBA has been identified by both MS- and NMR-based methods in almost all serum and urine samples of large human cohorts (e.g. ARIC [25], CoLaus [12], KORA [6,21], SHIP [10], TasteSensomics [12], and TwinsUK [6,21]) in rela-tively high concentrations (~ 40μM in urine in this study), which suggests sources beyond gas-oline for this metabolite (e.g. microbiota [64] or medication [65]). Interestingly, Daiet al. recently showed that 2-HIBA is an intermediate for the newly discovered but common 2-hydroxyisobutyrylation of lysine residues of histones [66], thus indicating an endogenous role of 2-HIBA. In this context, it is interesting to note thatSETD1Bis one of the genes within the identified locus on chromosome 12.SETD1Bis a component of the methyltransferase com-plex that specifically methylates the lysine-4 residue of histone H3 [67]. This residue is amongst the 63 sites for 2-hydroxyisobutyrylation presented by Daiet al. [66]. Thus, one could speculate that in addition to its activity as a histone methylase,SETD1Bmay also be involved in the newly discovered process of histone hydroxyisobutyrylation, a hypothesis that may now be tested by dedicated experiments.
As a third example, we discuss the association of variants inXYLBwith increased urinary glycolate levels. One of these variants, rs17118, causes an amino acid exchange in theXYLB
gene product.XYLBencodes the enzymexylulokinase[33], which catalyzes the phosphoryla-tion of D-xylulose to D-xylulose-5-phosphate. In humans, the vast majority of D-xylulose is metabolized viaxylulokinase[33,68,69]. However, there is an alternative metabolic pathway in which D-xylulose is metabolized byphosphofructokinase(PFK) (S3 Fig) [70]. Therein, one of the downstream products is glycolate. Thus, the genetic variants inXYLBmight reduce the enzymatic activity ofxylulokinaseand thereby cause a shift towards the alternative pathway. Interestingly, the minor allele of rs17118 has been implicated in increased susceptibility for ischemic stroke [32]. Furthermore, Junget al. found a significant association between elevated glycolate levels in plasma and cerebral infarction [34]. In the alternative pathway, glycolate is a precursor of oxalate, whose toxic effect has been demonstrated repeatedly [33,71]. Very
15 Novel Loci of Urinary Human Metabolic Individuality
recently, Raoet al. postulated that circulating oxalate precipitate might be a potential mecha-nism for stroke [72]. In this context, the association between the SNP rs17118 and glycolate (identified in our study) suggests that the carriers of this variants have a higher risk of stroke (identified in [32]) possibly via increased levels of glycolate or oxalate through favoring the alternative D-xylulose degradation. Unfortunately, oxalate or any other metabolite in the two D-xylulose degradation pathways are not detected in our metabolomics analysis to further sup-port our hypothesis.
Extending blood GIMs to urine
In total, 26 genetic loci that associate with urinary metabolic traits are known to date (22 iden-tified or confirmed in this study plus 4 ideniden-tified in previous studies [5,11,12],Fig 3). Of the 26 loci, only 8 loci lack corresponding SNP-metabolite associations in blood, and, based on current mGWAS, represent urine specific hits. All of these 8 loci were first reported in the pres-ent study. In case of the 14 loci with overlapping associations between blood and urine in our study (Table 3), 6 target the same metabolite in both media (CPS1,AGXT2,DMGDH,
SLC6A13,HPD,SLC5A11). Interestingly, in all but one case (SLC5A11) the genetic effect has the same direction in both fluids, thus indicating that urine can be regarded as“diluted plasma” to some extent. For 5 of the 14 loci, we considered the associated metabolic traits in blood and urine to be biochemically related. Here, the metabolites are either products of the enzyme coded by the candidate gene (NAT8: N-acetylated compounds), or they are linked through an enzymatic reaction other than the reaction catalyzed by the candidate gene’s product (NAT2: 1,3-dimethylurate and 1-methylurate [73];PYROXD2: trimethylamine and dimethylamine [EC 1.5.8.2];SLC7A9: lysine and homocitrulline [EC 2.1.3.8]), or they belong to the same metabolite class (TKT: gluconate and erythronate are aldonates). The observed associations of related but different metabolites in blood and urine may be indicative either for biochemical conversions before excretion, or simply be a result of differences in the composition of the metabolite panels covered by the various mGWAS. In case of the remaining 3 loci, we find no direct biochemical or metabolic relationship between the metabolites in both media, since
AGXTassociates with an unknown compound in blood,PNMTassociates with amino acids in urine and HDL cholesterol in blood, andSLC6A20targets loosely related amino acid
derivatives.
As an example for parallel effects in blood and urine, we identified an association between variants in theCarbamoyl-Phosphate Synthetase 1(CPS1) gene and elevated urinary glycine levels. The strongest associated SNP rs715 was also identified in previous mGWAS with higher glycine concentrations in blood [14,21,24]. This variant has been highlighted previously as a putative regulator ofCPS1expression [74–76]. Furthermore, the second strongest glycine-asso-ciated SNP rs1047891 causes a non-synonymous mutation (Thr>Asn) in the C-terminal
domain of theCPS1polypeptide, which hosts the binding site for the allosteric activator N-acteyl-L-glutamate (NAG) [77]. Both SNPs are therefore potentially causative variants in this metabolic association.CPS1is highly expressed in liver (S4 Table) and controls the first step in the urea cycle: ammonia is catalyzed to carbamoyl-phosphate, which in turn is the entry sub-strate of the urea cycle.CPS1deficiency can lead to high ammonia levels in the body (Hyper-ammonemia, OMIM #237300) (S4 Fig). The association of theCPS1variants with glycine can be explained by the conversion of excess ammonia to glycine via the glycine cleavage system [78,79] and is thus biologically meaningful. The association between common variants in
CPS1and glycine might therefore be driven by mild forms of genetically induced Hyperammo-nemia. In this study, we could establish a link between genetic factors and a potential urinary marker for this condition.
15 Novel Loci of Urinary Human Metabolic Individuality
SLC5A11is the only locus where we observe an association with exactly the same metabolite in blood and urine but with reversed effects: whilemyo-inositol concentrations in urine increase per effect allele copy of the lead SNP, they decrease in serum (Table 3) [21]. TheSolute Carrier Family 5 (Sodium/Inositol Cotransporter),Member 11(SLC5A11) is a co-transporter of
myo-inositol with sodium [80].SLC5A11was postulated to play a role in the regulation of serummyo-inositol concentrations [81], which was recently confirmed by an mGWAS in blood [21]. On the one hand, the influence ofSLC5A11onmyo-inositol concentrations has been linked to apical transport and absorption in intestine [82]. On the other hand,SLC5A11
may be implicated in the re-absorption ofmyo-inositol in the proximal tubule of the kidney [83]. The opposite direction of the genetic influence in blood and urine as observed in our study suggests thatSLC5A11is actively involved in the re-absorption ofmyo-inositol. This assumption is further supported by the strong increase of the association strength when testing the ratio between urinary and serummyo-inositol. This could indicate that the reduced levels in blood are indeed caused by a reduced re-absorption rate in subjects that are homozygous regarding the effect allele.
As these examples demonstrate, mGWAS in urine extend our understanding of genetically influenced biochemical processes and can facilitate the knowledge transfer from blood to urine and vice versa. Currently, this transfer is limited by the comparatively low number of GIMs in urine (26) versus blood (>150). Further increasing the sample sizes of mGWAS in urine and
the application of more sensitive MS-based metabolomics platforms as already used for blood mGWAS could compensate this bias.
Methods
Study samples
For this study, we used data from SHIP (Study of Health in Pomerania) and, for replication, from the KORA (Kooperative Gesundheitsforschung in der Region Augsburg) study. Both studies have been described extensively in the study design papers [84–86] and in our previous publications [4,6,10,21].
SHIP is a longitudinal population study conducted in West-Pomerania, located in the northeastern part of Germany. 4,308 inhabitants in that region participated in the first phase “SHIP-0”. For the GWAS presented here, metabolically characterized urine samples and geno-type data were jointly available for 3,861 study participants (1,960 female and 1,901 male, aged 20 to 81 years). KORA is a population study conducted in the municipal region of Augsburg in southern Germany. The KORA F4 cohort comprises 3,080 subjects. For the study presented here, both genotype and urine samples from 1,691 participants (865 female and 826 male, age 32 to 77) were available. In both studies, all participants have given written informed consent and the local ethics committees (SHIP: ethics committee of the University of Greifswald; KORA: ethics committee of the Bavarian Chamber of Physicians, Munich) have approved the studies.
Metabolomics data acquisition and processing
NMR measurements. In SHIP-0, non-fasting, spontaneous urine samples were collected from the study participants. In contrast, KORA F4 study participants were overnight-fasting prior to urine sample collection. All urine samples were stored at -80°C until the analysis. In preparation for the recording of NMR spectra, 75μl of phosphate buffer were added to 675μl of urine to set the pH to 7.0 (+/- 0.35). The deuterated buffer contained 0.5 mM sodium tri-methylsilylphosphate (TSP) to provide a reference substance for the annotation of the NMR spectra. One-dimensional1H NMR spectra were recorded at the University of Greifswald,
15 Novel Loci of Urinary Human Metabolic Individuality