1 1 2 3 4 5 6 7
COMPARATIVE STUDY ON NUTRITIONAL COMPOSITION OF FISH AVAILABLE IN
8
PORTUGAL
9 10
Running Title: NUTRITIONAL COMPOSITION OF FISH IN PORTUGAL
11 12 13
Ivone Marques1, Goreti Botelho2*, Raquel P. F. Guiné3 14
15 16 17
1Department of Food Industry, Agrarian School, Polytechnic Institute of Viseu, Portugal.
18
2
Department of Food Science and Technology, CERNAS Research Centre, Coimbra College of Agriculture, 19
Polytechnic Institute of Coimbra, Portugal. 20
3
CI&DETS and CERNAS Research Centre, Polytechnic Institute of Viseu, Portugal. 21 22 23 *Corresponding author: 24 Goreti Botelho 25
Coimbra College of Agriculture, Polytechnic Institute of Coimbra, Bencanta, 3045-601 Coimbra, Portugal. 26 Tel: +351 239 802 940; Fax: +351 239 802 979 27 E-mail: [email protected] 28 29 30 ACKNOWLEDGEMENTS 31
The authors thank the Company Beiragel, situated in Viseu, Portugal, for providing some information 32
used in this work. 33
34 35
Published article / Citation:
Marques I, Botelho G, Guiné R (2019) Comparative study on nutritional composition of fish available in Portugal. Nutrition & Food Science, 49(5), 925-941.
2 36
Abstract
37
Purpose - The Mediterranean Diet is one of the healthiest eating patterns and relies much on the
38
regular consumption of fish, source of unsaturated fatty acids, protein, vitamins and minerals. The 39
present study was undertaken to describe and compare the macro and micronutrients’ profile of 24 40
commercial fish species available in the Portuguese market. 41
Methodology – A comparative study was undertaken based on nutritional datasheets information
42
provided by laboratories and from database of the Portuguese National Health Institute Doutor Ricardo 43
Jorge. 44
Findings - The results obtained showed that most of the fish species are low fat but the gilthead
45
(Sparus aurata) and salmon (Oncorynchus keta) are considered high in fat, with salmon presenting 46
important amounts of unsaturated fatty acids. The blue shark (Prionace glauca) shows the highest 47
protein while the codfish (Gadus morhua) evidenced a very high salt content. While sardine (Sardina 48
pilchardus) is much richer in terms of vitamins as compared to the other species, with respect to
49
minerals, they vary a lot among species. Nevertheless, it stands out the skate (Raja spp.) with high 50
amounts of sodium, calcium and phosphorus. Statistical analysis evidenced some relations between 51
the properties evaluated, and most especially between lipids and saturated fatty acids (r = 0.958) or 52
monounsaturated fatty acids (r = 0.951), or even between ash and phosphorus (r = 0.817) or between 53
carbohydrates and zinc (r = 0.903) (correlations significant with p < 0.01). Furthermore, it was possible 54
to establish two distinct groups of fish through Hierarchical Cluster Analysis, one of them including 55
species like salmon, sardine, seabass (Dicentrarchus labrax) and mackerel (Trachurus trachurus) 56
which are not, however, belonging to the same fat category. 57
Practical implications - The species evaluated revealed a very important nutritional value that
58
should be an incentive to their regular consumption. Moreover, a lack of nutritional information about 59
some micronutrients was found in several fish species, which should be studied in future studies. 60
Value – This paper fulfils an identified need to compare nutritional composition of fish available
61
in Portugal. 62
63
Keywords: Fish, Human consumption, Mediterranean Diet, Energetic and nutritional composition
64 65
3
1. INTRODUCTION
66
The Mediterranean Diet (MD) is one of the healthiest eating patterns in the world with a number 67
of studies showing that its followers have a lower mortality rate and a higher average life expectancy. 68
The consumption of fish is thus recommended inside this food pattern as it presents numerous health 69
benefits. The MD is a complete and balanced model providing an important source of unsaturated fatty 70
acids (from olive oil), oleic acid and omega-3 (from fish and nuts), which, together with a low 71
consumption of saturated and trans fatty acids (from red meats), is important for cardiovascular and 72
cerebral health (Martinez-Gonzalez et al., 2009; Martins et al., 2012; Trichopoulou et al., 2005, 2009; 73
Willett, 2006). 74
World consumption of fish per capita increased in developing regions from 5.2 kg in 1961 to 18.8 75
kg in 2013 while in the least developed countries with food deficits increased from 3.5 kg to 7.6 kg in 76
the same period. Hence, fish accounts for about 17% of the intake of animal protein by the world 77
population (FAO, 2016). Portuguese consumers record the highest fish consumption in the EU, around 78
56.8 kg/capita/year, while the European average is less than half of that (24.9 kg/capita/year) (PCP, 79
2016). Portuguese sardines and codfish are some of the most commonly consumed fish species in 80
Portuguese cuisine (Lidon and Silvestre, 2009). 81
Fish supply to the fish processing industry comes from two sources, domestic production (fish 82
landings and aquaculture) and imports. Bjørndal et al. (2016) analysed the development in the 83
Portuguese fish processing industry from the 1960s to 2016 as well as prospects for future expansion. 84
The evolution of fisheries in Portugal, from an economic point of view, was also investigated and 85
analysed (Goulart et al., 2018). Besides, in a recent review, Anastacio et al. (2019) compiled for the 86
first time the list of non-native faunal species in Portuguese freshwaters, briefly discussing the history 87
of introductions since 1800 and identifying the most probable vectors of introduction and their regions 88
of origin. 89
Fish is a healthy food, containing high quality protein, with all essential amino acids, being also a 90
source of dietary minerals such as calcium, iodine or selenium and providing important amounts of 91
polyunsaturated fatty acids (Araújo et al., 2010; Pestana, 2007). Pelagic species, usually smaller ones 92
such as sardines, are generally rich in omega-3 fatty acids, mainly eicosapentaenoic acid (EPA, 20:5 93
ω3) and docosahexaenoic acid (DHA, 22:6 ω3) (Pestana, 2007). 94
For a better food balance intake, the World Health Organization (WHO) recommends a regular 95
consumption of fish, corresponding to at least twice a week (Sousa, 2015). Nevertheless, other 96
organizations also make similar recommendations: 97
World Health Organization (WHO, 2018): Regular consumption of fish (1-2 servings per 98
week) protects against coronary heart disease and stroke. The dose should provide an 99
4
equivalent of 200-500 mg of eicosapentaenoic acid (EPA) and docosahexaenoic acid 100
(DHA). 101
American Heart Association (AHA, 2015): Eat several fish at least twice a week, 102
especially those that contain omega-3, such as, for example, salmon or trout (Oncorhynchus 103
mykiss).
104
Academy of Nutrition and Dietetics (Vannice and Rasmussen, 2014): Because of the health 105
benefits, consumption of omega-3 should be increased by eating more fish, nuts and seeds. 106
German Nutrition Association (DGE, 2018): Daily consumption of 1.1 to 1.2 g of omega-107
3. 108
EFSA European Food Safety Association (EFSA, 2017): A daily intake of 250 mg of long-109
chain omega-3 fatty acids in adults may reduce the risk of heart disease. 110
Portuguese Heart Foundation (Ferreira, 2016): A balanced consumption of omega-6 and 111
omega-3 fatty acids is achieved for a ratio varying from 2:1 to 4:1. 112
113
A recent study (Ribeiro et al., 2019) conducted in Portugal based on a self-administered 114
questionnaire showed that high consumption rate of fish (between daily, and a minimum of three times 115
a week), was reported by 47% of the respondents. 116
The link between fish consumption and health benefits seems to be well established. In fact, 117
studies have shown that the introduction of fish into the diet of infants (aged from 6 to 9 months) as 118
well as regular consumption of different types of fish at least once a week reduces asthma. Besides, 119
the fat intake from fish in older children helps their healthy development (Øyen et al., 2018; 120
Papamichael et al., 2018). A proper diet including fish during pregnancy and the introduction of fish 121
into the infant's diet promotes the production of antibodies against any food allergen (Zhang et al., 122
2017). Also Miles and Calder (2017) report that the consumption of fish oil in pregnancy reduces 123
asthma in children between 3 and 5 years of age, as well as, prevents childhood allergic diseases. A 124
diet with a high omega-3 content allows to fight the excess of inflammatory factors responsible for 125
several pathologies, particularly chronic noncommunicable diseases (NCDs). 126
Because Portugal is one of the countries with the highest level of fish consumption it is important 127
to characterize the energetic and nutritional composition of different fish species. Nevertheless, as far 128
as we know, a comparative study focused on this subject was never done. Hence, the main objective 129
of this work was to compare the energy value and nutritional composition, namely macro and 130
micronutrients, of 24 different fish species available on the Portuguese market. 131
5
2. MATERIALS AND METHODS
133
The data collection was carried out between January and March 2018 and was based on two 134
sources of information: a) data provided by a company from the central region of Portugal that is 135
engaged in the trade of frozen products, which includes a high variety of fish and b) database available 136
online developed by the National Health Institute Doutor Ricardo Jorge (INSA). The quantitative data 137
obtained through the company were collected from the original independent external laboratory reports 138
in order to ensure its reliability. However, since for many of the species there were no data available, 139
the authors consulted data available in the national database for food composition. The collected data 140
from the different sources considered were complementing and were then organized into tables to 141
facilitate the comparison of the energy value and amount of macro and micronutrients of a total of 24 142
different fish species. The species included in this work cover the most representative of the Portuguese 143
fish consumption. 144
2.1. Data analysis
145
The Pearson correlation coefficients (r) were used to evaluate the possible associations and 146
interdependence between properties. For absolute value of r = 0 there is no correlation, for r ]0.0, 147
0.2[ the correlation is very weak, for r [0.2, 0.4[ the correlation is weak, for r [0.4, 0.6[ the 148
correlation is moderate, for r [0.6, 0.8[ the correlation is strong, for r [0.8, 1.0[ the correlation is 149
very strong, for r = 1 the correlation is perfect (Maroco, 2012; Pestana and Gageiro, 2014). 150
Also a factor analysis (FA) was undertaken. The correlation matrix between the variables was 151
analysed to identify the level of intercorrelation between variables (Broen et al., 2015). After 152
confirming that the data were suitable for application of FA, this approach was applied considering 153
extraction by Principal Component Analysis (PCA) and Varimax rotation with Kaiser Normalization. 154
The number of components was established by the Kaiser criterion (eigenvalues ≥ 1). In all cases, the 155
communalities were calculated to show the percentage of variance explained by the factors extracted 156
(Broen et al., 2015). Factor loadings with an absolute value exceeding 0.4 were used, because this 157
lower limit accounts for about 16% of the variance in the variable (Rohm and Swaminathan, 2004; 158
Stevens, 2009). Finally, a Hierarchical Cluster Analysis (HCA) was performed, following the Ward 159
linkage method, with Squared Euclidean Distance. For all statistical analyses was used the software 160
SPSS version 25 (IBM, Inc.) and the level of significance considered was 5% (p < 0.05), unless 161 otherwise specified. 162 163 164 165
6
3. RESULTS AND DISCUSSION
166
3.1. Composition of the fish consumed in Portugal
167
A healthy diet involves the consumption of all the constituents necessary for the proper 168
functioning of the human body and, therefore, it is essential to incorporate fish in a balanced diet. The 169
diversity of species, the high nutritional value, the beneficial effects on health, particularly in the 170
prevention of cardiovascular accidents and the fact that they are the basis of the gastronomy of 171
numerous coastal populations, are factors that demonstrate the importance of fishery products 172
worldwide. Knowledge of the chemical composition of fishery products is one of the basic aspects to 173
assess their nutritional value, as well as, the benefits associated with their consumption. This is of great 174
interest to consumers and professionals in the fields of medicine and nutrition but also to all 175
participants in the fishing industry (Maulvault, 2009). 176
The main chemical components of fish muscle are water, protein and lipids, which together 177
account for 98% of the total weight of the muscle. These constituents are very important for 178
determining the nutritional value, texture, organoleptic quality and storage (Sikorski, 1994). 179
The chemical composition of the fish varies greatly, either interspecifically or intraspecifically, 180
depending on the age, sex, environment and time of year. However, the edible fraction of the fish 181
usually corresponds to about 45-50% of the total weight of its body and the fundamental constituents 182
of the edible part are: water, lipids and proteins. Among the minor components stand the non-protein 183
nitrogenous substances, minerals, vitamins and a small amount of carbohydrates (Rodrigues, 2014). 184
Fish can be classified according to the fat content present in the muscles as very low fat, if the 185
percentage of fat is less than 2%, low in fat if the percentage varies between 2% and 4%, average fat 186
content, if the percentage is between 4% and 8%, and finally high fat if greater than 8% (Ackman, 187
1990; Afonso, 2009; Gonçalves, 2010). However, these criteria for classification of fat content may 188
vary depending on the authors (Gonçalves, 2009, 2010). For example, Dias (2012) classifies fish in 189
terms of fat content into only three categories: lean, semi-fatty or fat. On the other hand, according to 190
Lopes (2009) lean species, also known as whitefish, include codfish (Gadus morhua), sole (Solea 191
solea) and European hake (Merluccius merluccius), and have a fraction of less than 5% of fat. Fatty
192
species (also called blue fish) have a lipid content of more than 10% and include pelagic species such 193
as sardine (Sardina pilchardus, between summer and autumn), chub mackerel (Scomber colias) and 194
salmon (Oncorynchus keta) (Lopes, 2009). Fish species which store lipids in small quantities similarly 195
to the fatty species or in limited areas of the body, qualify as semi-fatty species in which the lipid 196
content is between 5 to 10%. This is the case of sardine (between winter and spring), wreckfish 197
(Polyprion americanus) and European seabass (Dicentrarchus labrax) (Lopes, 2009). 198
7
The lean fish is typical of deep water and tends to accumulate fat in the liver. On the contrary, 199
fatty fish tend to remain close to the surface of the water and accumulate fat, not only in the liver, but 200
also in the muscular tissue, causing a darker coloration of the muscle as compared to that of lean fish. 201
This fat can, if necessary, be used as an energy reserve (Silva, 2016). Table 1 shows the classification 202
of the 24 fish species analysed according to their fat content, energy value and nutritional composition. 203
204
Please insert Table 1 here
205
From the fish species analysed there are several that can be considered as lean since their fat 206
content is lower than 2%. Among these are tadpole codling (Salilota australis), pink cusk-eel 207
(Genypterus blacodes), skate (Raja spp.), monkfish (Lophius piscatorius), dentex (Dentex dentex), 208
catfish (Pangasius hypopthalmus), smooth-hound (Mustelus mustelus), codfish (Gadus morhua), hake 209
from South Africa (Merluccius capensis), croaker (Protonibea diacanthus), hake from Chile 210
(Merluccius australis), plaice (Hipoglossoides platessoides), hake from Argentina (Merluccius 211
hubbsi), mackerel (Trachurus trachurus) and sand smelt (Atherina boyeri). Some fish species have a
212
low fat content, namely perch (Lates niloticus), black scabbardfish (Aphanopus carbo), sardine 213
(Sardina pilchardus) and redfish (Sebastes spp.). Fish that have a medium fat content are fewer and 214
include blue shark (Prionace glauca), seabass (Dicentrarchus labrax) and sprat (Sprattus sprattus). In 215
relation to the fish classified as fat, with a high fat content, stand out gilthead (Sparus aurata) and 216
salmon (Oncorynchus keta), with 9.8% and 21.9%, respectively. 217
From the evaluated fish species, many do not contain saturated fatty acids, namely: tadpole codling 218
(Salilota australis), cusk-eel (Genypterus blacodes), skate (Raja spp.), monkfish (Lophius 219
piscatorius), common dentex (Dentex dentex), catfish fillet (Pangasius hypopthalmus), smooth-hound
220
(Mustelus mustelus) and perch (Lates niloticus). On the other hand, the species with higher lipid 221
content also showed higher content of saturated fatty acids: gilthead seabream and salmon, with 2.1 222
and 4.2 g/100 g, respectively. In what concerns the energetic value, the catfish fillet (Pangasius 223
hypopthalmus) and streak (Raja spp.) present the lowest values, 50 and 58 kcal/100 g, respectively.
224
The highest energetic content was found in salmon (Oncorynchus keta), with 262 kcal/100 g and 225
gilthead (Sparus aurata) with 167 kcal/100 g. 226
As for the protein content, also evaluated in this work, the seabass (Dicentrarchus labrax) and 227
catfish fillet (Pangasius hypopthalmus) are those that present a lower content, with 10 and 11 g/100 g. 228
Fish with the highest protein content include the smooth-hound (Mustelus mustelus) with 20 g/100 g, 229
the croaker (Protonibea diacanthus) with 20.4 g/100 g and blue shark (Prionace glauca) with 21 g/100 230
g. 231
8
Regarding the carbohydrate content for most of the evaluated species this they are absent: catfish 232
fillets (Pangasius hypopthalmus), skate (Raja spp.), black scabbardfish (Aphanopus carbo), salmon 233
(Oncorynchus keta), tadpole codling (Salilota australis), cusk-heel (Genypterus blacodes), monkfish 234
(Lophius piscatorius), hake from South Africa (Merluccius capensis), hake from Chile (Merluccius 235
australis), codfish (Gadus morhua), sand smelt (Atherina boyeri), plaice (Hipoglossoides
236
platessoides), perch (Lates niloticus), dentex (Dentex dentex), gilthead (Sparus aurata), smooth-hound
237
(Mustelus mustelus), croaker (Protonibea diacanthus) and blue shark (Prionace glauca). However, it 238
stands out the seabass (Dicentrarchus labrax) and the sardine (Sardina pilchardus) both with a value 239
of 2.3 g/100 g of carbohydrates. 240
In what concerns sugars, the short chain carbohydrates – monosaccharides and disaccharides, they 241
are absent in all those species analysed which did not contain carbohydrates and which were referred 242
before. The seabass (Dicentrarchus labrax) which has the highest carbohydrates content also shows 243
the highest sugar content, 1.5 g/100 g. Nevertheless, from the carbohydrates present sugars represent 244
just a minority. 245
Because the salt content is very important due to its relation with heart and cardiovascular diseases 246
this was also evaluated in this work. It was observed that sand smelt (Atherina boyeri) and croaker 247
(Protonibea diacanthus) present the lowest salt content, both with 0.1 g/100 g. On the other hand, the 248
seabass (Dicentrarchus labrax) and codfish (Gadus morhua) present the highest values: 1.1 and 9.3 249
g/100 g, respectively. It is worth mention that in Portugal the codfish is not consumed in natura, being 250
firstly salted for storage and then desalted in soaking water prior to preparation. Because this process 251
takes at least 24-48 hours, nowadays it is a common practice to desalt the codfish industrially and then 252
freeze the product for a ready usage by the consumers. Due to this processing, it is natural that the salt 253
content of the codfish might be quite higher when compared to other fish species. According to the 254
USDA – Food Composition Database (USDA, 2018), the sodium content in Atlantic codfish is 54.0 255
mg/100 g, which is equivalent to 0.1 g/100 g of sodium chloride, thus evidencing that the high salt 256
content in Portuguese codfish results from the salting process. 257
One other aspect evaluated within this work was the fatty acids and cholesterol contents of the 24 258
fish species consumed in Portugal. It is worth noting that regarding this type of food constituents there 259
is still much unavailable data, which highlights the need to proceed with further studies in this area. 260
The results presented in Table 1 show that some species do not present monounsaturated fatty 261
acids (MUFAs), namely, tadpole codling (Salilota australis), smooth-hound (Mustelus mustelus), 262
cusk-eel (Genypterus blacodes), skate (Raja spp.) and monkfish (Lophius piscatorius). Salmon 263
(Oncorynchus keta) on the other hand stands out with a high value, 10 g/100 g, followed by sardine 264
(Sardina pilchardus) with 4 g/100 g. The tadpole codling (Salilota australis) and monkfish (Lophius 265
9
piscatorius) also do not present polyunsaturated fatty acids (PUFAs), while salmon (Oncorynchus
266
keta) and sardine (Sardina pilchardus) show a high value: 5.1 g and 5.6 g/100 g. Most of the evaluated
267
fish species do not have linoleic acid (LA), being this present only in salmon (Oncorynchus keta), 268
which is the richest with 0.7 g/100 g, in sardine (Sardina pilchardus) and seabream (Sparus aurata), 269
both with 0.5 g/100 g, in seabass (Dicentrarchus labrax), 0.4 g/100 g and in monkfish (Lophius 270
piscatorius), 0.1 g/100 g. The values of cholesterol show that the hake species (Merluccius capensis,
271
Merluccius hubbsi and Merluccius australis), present the lowest content, 19.0 mg/100 g while the
272
plaice (Hipoglossoides platessoides) shows the highest cholesterol content, 85.0 mg/100 g. Also the 273
vitamin content was evaluated for some selected vitamins, namely A, D, B6, B12 and C, and the values
274
are presented in Table 2. 275
276
Please insert Table 2 here
277 278
Regarding the vitamin A content, the plaice (Hipoglossoides platessoides) reveals absence of this 279
fat soluble vitamin, while the codling (Salilota australis) and croaker (Protonibea diacanthus) show a 280
residual content of 1 μg/100g. Nevertheless, this vitamin can be found in higher amounts in sardine 281
(Sardina pilchardus), with 47 μg/100g, followed by seabass (Dicentrarchus labrax), with 36 μg/100g. 282
The vitamin D is not found in monkfish (Lophius piscatorius) while the sardine shows a high value of 283
21 μg/100g, followed by croaker (Protonibea diacanthus), with 16 μg/100g. With relation to vitamin 284
B6 the hake from South Africa (Merluccius capensis) presents the lowest value, with 0 mg/100g
285
whereas the sardine (Sardina pilchardus) is the richest, with 0.6 mg/100g, followed by seabass 286
(Dicentrarchus labrax) with 0.5 mg/100g. The monkfish (Lophius piscatorius) shows a low content 287
of vitamin B12, 0.3 μg/100g, and once again the sardine (Sardina pilchardus) shows the highest content
288
of this vitamin among the studies fish species, 10 μg/100g. It is noteworthy that concerning the 289
vitamins contents, sardine stands out by presenting the highest values for all the evaluated vitamins, 290
just with exception for vitamin C. By the way, from the 24 evaluated species neither of them revealed 291
the presence of vitamin C, for this reason, there is no data for vitamin C in Table 2. 292
The total mineral content, measured by ash, was very similar in all species, varying from 1 g/100 293
g in pink cusk-eel (Genypterus blacodes) and plaice (Hipoglossoides platessoides) to the maximum 294
value of 1.9 g/100 g in skate (Raja spp.). Regarding sodium (Na), while the salmon (Oncorynchus 295
keta) is the poorest, with only 38 mg/100 g, the skate (Raja spp.) is the species with the highest content,
296
220 mg/100 g. The potassium (K) is less variable among the species evaluated, varying from 230 297
mg/100 g in plaice (Hipoglossoides platessoides) to 430 mg/100 g in croaker (Protonibea diacanthus). 298
The calcium (Ca) varies markedly from specie so specie, being as low as 7.0 mg/100 g in monkfish 299
10
(Lophius piscatorius) while for the skate (Raja spp.) it is very high, 160 mg/100 g. Phosphorus (P) is 300
important in all species, with plaice (Hipoglossoides platessoides) showing the lowest content, 170 301
mg/100 g, as opposing to skate (Raja spp.), which shows a high amount, 320 mg/100 g. In relation to 302
magnesium (Mg), the contents vary from 23 mg/100 g in salmon (Oncorynchus keta) to 38 mg/100 g 303
in seabass (Dicentrarchus labrax). The iron (Fe) is very low for all species, with a maximum content 304
of 1.2 mg/100 g in mackerel (Trachurus trachurus). Regarding the zinc (Zn), the values are also low 305
in all cases, with sardine (Sardina pilchardus) showing the highest value, 1.6 mg/100 g. 306
307
3.2. Analysis of the data by means of Pearson correlations
308
Table A.1 in Annex A shows the values obtained for the Pearson correlations between all the 309
properties considered for the 24 species most representative of the fish under study. The most 310
expressive correlations, corresponding to values of r between 0.8 and 1.0, were found for the relations 311
between lipids with saturated fatty acids (r = 0.958), with monounsaturated fatty acids (r = 0.951) and 312
with polyunsaturated fatty acids (r = 0.856). Very strong correlations were also found between 313
saturated fatty acids and MUFAs (r = 0.957), PUFAs (r = 0.812) or linoleic acid (r = 0.900). The 314
correlation between MUFAs and PUFAs as well as that between MUFAs and LA were also very strong 315
(r = 0.874 and r = 0.891, respectively), and similarly the correlation between PUFAs and LA (r = 316
0.919). These correlations between different classes of lipids are expectable, as it is the association 317
between carbohydrates and sugar, expressed also by a very strong correlation (r = 0.925). 318
Regarding the ash content, the strongest correlation was with phosphorus (r = 0.817). Apart from 319
these it was also found a less intuitive correlation between carbohydrates and zinc (r = 0.903), being 320
this indicative a very strong association between these variables. All these signalled correlations were 321
significant at the level of 1% (p < 0.01). 322
323
3.3. Analysis of the data by using Factor Analysis
324
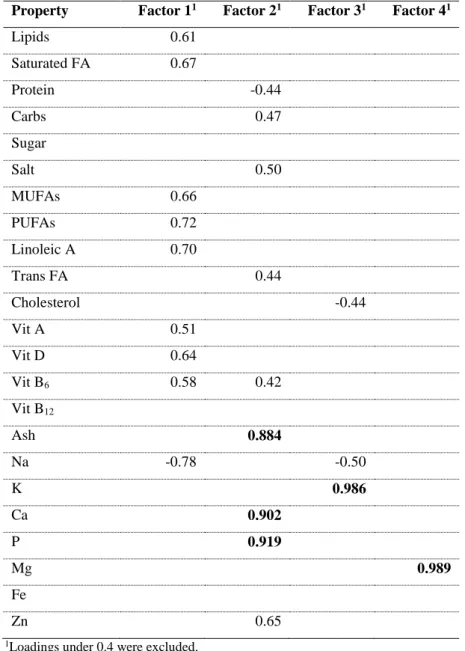
The correlation matrix showed that there were some significant correlations between the variables, 325
with 33% of the values of r being over 0.4, and with 12 values higher than 0.8. The solution obtained 326
by FA with Varimax rotation of PCA solution produced 4 components, based on the Keiser criterion 327
to consider eigenvalues greater than 1. The percentage of total variance explained by the solution was 328
96.3%, distributed by the factors as: F1 – 10.6%, F2 – 19.6%, F3 – 24.2% and F4 – 41.9%. The rotation 329
converged in 6 iterations and extracted 4 factors, as previously mentioned, which arrange the variables 330
as presented in Table 3. 331
332
Please insert Table 3 here
11 334
Factor 1 was visibly linked to fat and it also included the fat soluble vitamins, although there were 335
some other components that contributed for the definition of this factor, and all with high loadings 336
(absolute value), being the lowest equal to 0.505, indicating that all variables contributed importantly 337
for the definition of this factor. On the other hand, factors 2, 3 and 4 were clearly more linked to the 338
mineral composition, with some very expressive loadings (over 0.8). While factor 2 related strongly 339
with ash, calcium and phosphorus, factor 3 was very much determined by potassium and factor 4 340
essentially by magnesium. The variables sugar and iron did not present a representative loading (over 341
0.4) in any of the factors extracted. 342
343
3.4. Analysis of the data by Hierarchical Cluster Analysis
344
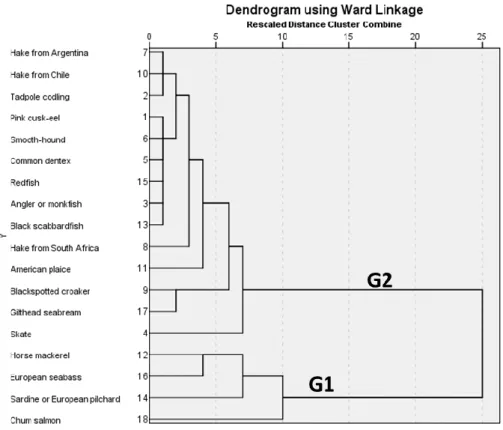
By performing the Hierarchical Cluster Analysis using the Ward linkage method considering 345
Squared Euclidean Distance, the fish species evaluated were grouped into two major groups, as 346
indicated by the dendogram in Figure 1. 347
348
Please insert Figure 1 here
349 350
The first group includes the following species: salmon, sardine, seabass and mackerel, while the 351
second group includes all other types of fish evaluated in this study. Nevertheless, as the as the distance 352
changes, the division of the samples becomes more frequent, based on the individual composition of 353
each species. Species that stayed in the same group, i.e., were not differentiated after all the levels, 354
include hake from Argentina, hake from Chile and tadpole codling, constituting a homogenous 355
subgroup. Another subgroup was defined by 6 species, cusk-eel, smooth-hound, common dentex, 356
redfish, monkfish and black scabbardfish. The croaker and gilthead seabream constituted another 357
subgroup and finally another subgroup was formed by other two species: mackerel and seabass. 358
359
4. CONCLUSION
360
As regards the fat content, fish species like gilthead and salmon are highlighted for having a fat 361
content of about 10% and 22%, respectively. Particularly the salmon presents very high values of 362
unsaturated fatty acids, 10 and 5 g/100 g, respectively for MUFAs and PUFAs. As for protein, the blue 363
shark is that with a higher content, 21 g/100g of edible part. Codfish evidenced a very high salt content, 364
9.3 g/100 g, which is probably due to the fact that in Portugal the codfish is used after a salting process. 365
Regarding the vitamin content, sardine presents a considerable higher amount as compared with the 366
12
other species evaluated. Concerning dietary minerals, skate and salmon show the highest amounts of 367
phosphorus, 320 and 310 mg/100 g, respectively. Particularly rich in calcium appears also the skate, 368
160 mg/100 g, being the difference to the generality of other species much pronounced. The croaker 369
and the hake from Argentina are the species with more potassium (430 and 410 mg/100 g, 370
respectively), while the sodium content is higher in skate and in smooth-hound (220 and 170 mg/100 371
g). Magnesium is highlighted in species like seabass (38 mg/100 g) and hake from South Africa (37 372
mg/100 g). The mackerel is the richest in iron (1.2 mg/100 g) and sardine stand out for the highest zinc 373
content (1.6 mg/100 g). 374
Very strong correlations were found between the properties related to lipid content, with values 375
ranging from 0.812 to 0.958. Factor analysis extracted 4 factors, explaining more that 96% of the 376
variance, being one factor much linked to the lipids whereas the other 3 factors were mostly explained 377
by the mineral composition of the species evaluated. Furthermore, cluster analysis allowed identifying 378
two major groups of fish and 4 undistinguishable subgroups. 379
As it was evidenced by this work, still much information is not available for the species concerned, 380
so it is recommended that more studies focus on the determination of those nutritional properties. Also, 381
because the information used in this study never referred if the species were collected from the wild 382
or if they were grown in aquaculture, further comparative studies would be advisable in the future. 383
384
5. CONFLICT OF INTEREST
385
The authors have no conflict of interest to declare. 386
387
6. ACKNOWLEDGEMENT
388
Not included for anonymity purposes. 389
390
7. REFERENCES
391
Ackman, R.G. (1990), “Seafood lipids and fatty acids”, Food Reviews International, Vol. 6 No. 4, pp. 392
617–646. 393
Afonso, C.I.M. (2009), Produtos da pesca capturados na costa Portuguesa: benefícios e perigos 394
associados ao seu consumo. Tese de Doutoramento em Farmácia, Universidade de Lisboa,
395
Lisboa, Portugal. 396
AHA. (2015), “The American Heart Association’s Diet and Lifestyle Recommendations”, American 397
Heart Association. 398
13
Anastácio, P.M., Ribeiro, F., Capinha, C., Banha, F., Gama, M., Filipe, A.F., Rebelo, R. and Sousa, R. 399
(2019), Non-native freshwater fauna in Portugal: A review. Science of the Total Environment, 400
Vol. 650, pp. 1923–1934. 401
Araújo, D.A.F.V., Soares, K.M.P. and Góis, V.A. (2010), “Características gerais, processos de 402
deterioração e conservação do pescado”, PUBVET, Publicações em Medicina Veterinária e 403
Zootecnia, Vol. 4 No. 9, pp. 1–29.
404
Bjørnd, T., Brasão, A., Ramos, J. and Tusvik, A. (2016), Fish processing in Portugal: An industry in 405
expansion, Marine Policy, Vol. 72, pp. 94–106. 406
Broen, M.P.G., Moonen, A.J.H., Kuijf, M.L., Dujardin, K., Marsh, L., Richard, I.H., Starkstein, S.E., 407
et al. (2015), “Factor analysis of the Hamilton depression rating scale in Parkinson’s disease”, 408
Parkinsonism & Related Disorders, Vol. 21 No. 2, pp. 142–146.
409
DGE. (2018), “Nahrungsergänzung - hypo-A: How much omega-3-fatty acids are useful?”, available 410
at: https://www.hypo-a.de/en/ihre-gesundheit/lexikon-nahrungsergaenzung/omega-3-411
fettsaeuren/menge-omega-3-fettsaeuren.html (accessed 1 November 2018). 412
Dias, M.F. (2012), Qualidade sensorial de peixes de aquacultura vs peixes capturados no mar. Tese 413
de Mestrado em Segurança e Qualidade Alimentar em Restauração, Escola Superior de
414
Hotelaria e Turismo do Estoril, Estoril, Portugal. 415
EFSA. (2017), Dietary reference values for nutrients - Summary Report, p. 92. 416
FAO. (2016), “FAO Fisheries & Aquaculture - The State of World Fisheries and Aquaculture 417
(SOFIA)”, available at: http://www.fao.org/fishery/sofia/en (accessed 1 November 2018). 418
Ferreira, J. (2016), “Ómegas 3 e 6”, Fundação Portuguesa Cardiologia, available at: 419
http://www.fpcardiologia.pt/omegas-3-e-6/ (accessed 1 November 2018). 420
Gonçalves, A.C. (2009), Qualidade e valorização em aquacultura: propriedades sensoriais e período 421
de conservação útil de peixe e bivalves. Tese de Doutoramento em Farmácia, Universidade de
422
Lisboa, Lisboa, Portugal. 423
Gonçalves, L.U. (2010), Lipídios e ácidos graxos nos desempenhos reprodutivo e zootécnico de 424
lambaris (Astyanax altiparanae). Tese de Doutoramento em Zootecnia, Universidade de São
425
Paulo, Pirassununga, Brasil. 426
Goulart, P., Veiga, F.J. and Grilo, C. (2018), The evolution of fisheries in Portugal: A methodological 427
reappraisal with insights from economics. Fisheries Research, Vol. 199, pp. 76–80. 428
14
Lidon, F. and Silvestre, M.M. (2009), Princípios de alimentação e nutrição humana, Escolar Editora, 429
Lisboa, available at: https://www.fnac.pt/Principios-de-Alimentacao-e-Nutricao-Humana-430
Fernando-Lidon/a279335# (accessed 1 November 2018). 431
Lopes, A.M.R.M. (2009), Avaliação da contaminação em metais pesados no pescado: análise da 432
situação do pescado comercializado em Portugal e dos alertas emitidos pelo sistema RASFF
433
(Rapid Alert System for Food and Feed). Tese de Mestrado em Tecnologia e Segurança
434
Alimentar, Faculdade de Ciências e Tecnologia da Universidade Nova de Lisboa, Lisboa,
435
Portugal. 436
Maroco, J. (2012), Análise estatística com o SPSS Statistics, 5a Ed., Report number, Brazil. 437
Martinez-Gonzalez, M.A., Bes-Rastrollo, M., Serra-Majem, L., Lairon, D., Estruch, R. and 438
Trichopoulou, A. (2009), “Mediterranean food pattern and the primary prevention of chronic 439
disease: recent developments”, Nutrition Reviews, Vol. 67 No. suppl_1, pp. S111–S116. 440
Martins, E., Mendes, F. and Fernandes, R. (2012), “Hábitos alimentares em crianças e jovens: nível de 441
adesão à Dieta Mediterrânica”, Congresso Ibérico: Contextos de Investigação em Saúde, pp. 442
507–518. 443
Maulvault, A.L.M.P.C. (2009), Valor nutricional de algumas espécies consumidas em Portugal. Tese 444
de Mestrado em Biologia Marinha, Universidade do Algarve, Faro, Portugal.
445
Miles, E.A. and Calder, P.C. (2017), “Can early Omega-3 fatty acid exposure reduce risk of childhood 446
allergic disease?”, Nutrients, Vol. 9 No. 7, p. 784. 447
Øyen, J., Kvestad, I., Midtbø, L.K., Graff, I.E., Hysing, M., Stormark, K.M., Wik, M., et al. (2018), 448
“Fatty fish intake and cognitive function: FINS-KIDS, a randomized controlled trial in 449
preschool children”, BMC Medicine, Vol. 16 No. 41, pp. 1–15. 450
Papamichael, M.M., Shrestha, S.K., Itsiopoulos, C. and Erbas, B. (2018), “The role of fish intake on 451
asthma in children: a meta-analysis of observational studies”, Pediatric Allergy and 452
Immunology, Vol. 29 No. 4, pp. 350–360.
453
PCP, (2016), Facts and Figures on the Common Fisheries Policy –Basic Statistical Data – 2016 454
Edition. Publications Office of the European Union, Luxembourg. 455
Pestana, C.M.P. (2007), Conservação de filetes de sardinha, Sardina pilchardus, sujeitos a 456
estabilização com gás solúvel (SGS), embalados em ar, vácuo e atmosfera modificada. Tese
457
de Mestrado. Mestrado em Controlo da Qualidade e Toxicologia dos Alimentos, Faculdade de
15
Farmácia da Universidade de Lisboa, Lisboa, Portugal, available at: 459
http://repositorio.ul.pt/handle/10451/247 (accessed 1 November 2018). 460
Pestana, M.H. and Gageiro, J.N. (2014), Análise de dados para Ciências Sociais – a 461
complementaridade do SPSS, 6a ed., Edições Sílabo, Brasil.
462
Ribeiro, A.R., Altintzoglou, T., Mendes, J., Nunes, M.L., Dinis, M.T. and Dias, J. (2019), Farmed fish 463
as a functional food: Perception of fish fortification and the influence of origin – Insights from 464
Portugal. Aquaculture, Vol. 501 pp. 22–31. 465
Rodrigues, P.M.T. (2014), Estudo de alternativas à remoção manual da pele da sardinha (Sardina 466
pilchardus) para conservas. Tese de Mestrado. Mestrado em Empreendedorismo e Inovação
467
na Indústria Alimentar, Instituto Politécnico de Viana do Castelo, Viana do Castelo, Portugal.
468
Rohm, A.J. and Swaminathan, V. (2004), “A typology of online shoppers based on shopping 469
motivations”, Journal of Business Research, Vol. 57 No. 7, pp. 748–757. 470
Sikorski, Z.E. (1994), Tecnologia de los productos del mar, Editorial Acribia, Zaragoza. 471
Silva, A.F.H. da (2016), Benefícios do consumo regular de pescado para a saúde humana, 472
Universidade Fernando Pessoa, Brasil, available at: https://bdigital.ufp.pt/handle/10284/5725 473
(accessed 1 November 2018). 474
Sousa, M.M. (2015), Análise dos hábitos alimentares e de consumo de pescado das populações de 475
Leiria e Peniche. Tese de Mestrado. Mestrado em Gestão da Qualidade e Segurança
476
Alimentar, Instituto Politécnico de Leiria, Leiria, Portugal.
477
Stevens, J.P. (2009), Applied multivariate statistics for the Social Sciences, 5th edition, Routledge, New 478
York. 479
Trichopoulou, A., Bamia, C. and Trichopoulos, D. (2005), “Mediterranean Diet and survival among 480
patients with coronary heart disease in Greece”, Archives of Internal Medicine, Vol. 165 No. 481
8, pp. 929–935. 482
Trichopoulou, A., Costacou, T., Bamia, C. and Trichopoulos, D. (2009), “Adherence to a 483
Mediterranean Diet and survival in a Greek population”, 484
Http://Dx.Doi.Org/10.1056/NEJMoa025039, research-article, 7 October, available
485
at:https://doi.org/10.1056/NEJMoa025039. 486
USDA. (2018), National nutrient database for standard reference legacy release, United States 487
Department of Agriculture - Agricultural Research Service. 488
16
Vannice, G. and Rasmussen, H. (2014), “Position of the academy of nutrition and dietetics: dietary 489
fatty acids for healthy adults”, Journal of the Academy of Nutrition and Dietetics, Vol. 114 No. 490
1, pp. 136–153. 491
WHO. (2018), “WHO | 5. Population nutrient intake goals for preventing diet-related chronic 492
diseases”, WHO, available at: http://www.who.int/nutrition/topics/5_population_nutrient/en/ 493
(accessed 1 November 2018). 494
Willett, W.C. (2006), “The Mediterranean Diet: science and practice”, Public Health Nutrition, Vol. 495
9 No. 1a, pp. 105–110. 496
Zhang, G.-Q., Liu, B., Li, J., Luo, C.-Q., Zhang, Q., Chen, J.-L., Sinha, A., et al. (2017), “Fish intake 497
during pregnancy or infancy and allergic outcomes in children: A systematic review and meta-498
analysis”, Pediatric Allergy and Immunology, Vol. 28 No. 2, pp. 152–161. 499 500 501 502 503 504 505
Figure 1. Dendogram obtained with Ward linkage for the 24 fish species analysed. Two main groups (G1 506
and G2) were found as grouping categories for distances higher than 10. 507
17 509
510
Table 1 – Energetic and nutritional value of the most important fish species consumed in Portugal. 511
Values per 100 g of edible part
Fish1 E nerg y (kca l) F a t co nte nt ce teg o ry 2 L ipi ds (g ) O f which sa tura ted fa tt y a cids ( g ) P ro teins (g ) Ca rbo hy dra tes (g ) O f which su g a rs (g ) Sa lt (g ) M o no un sa tura ted fa tt y a cids (M UF As) (g ) P o ly un sa tura ted fa tt y a cids (P UF As) (g ) L ino leic a cid (L A) ( g ) Cho leste ro l (mg ) So urce 4 Pink cusk-eel (Genypterus blacodes) 70 Very low 0.1 0 17.2 0 0 0.3 0 0.1 0 28 INSA Tadpole codling (Salilota australis) 70 Very low 0.1 0 17.2 0 0 0.2 0 0 0 22 INSA Angler or monkfish (Lophius piscatorius) 73 Very low 0.2 0 17.9 0 0 0.2 0 0 0.1 42 INSA Skate (Raja spp.) 58 Very low 0.2 0 14.1 0 0 0.6 0 0.1 0 39 INSA Common dentex (Dentex dentex) 79 Very low 0.2 0 19.4 0 0 0.2 0.1 0.2 0 34 INSA Atlantic codfish (Gadus morhua) 80 Very
low 0.4 0.1 19 0 0 9.3 N.A. N.A. N.A. N.A.
Striped catfish [fillet]
(Pangasius hypopthalmus) 50
Very
low 0.5 0 11 0 0 0.4 N.A. N.A. N.A. N.A. TF
Smooth-hound
(Mustelus mustelus) 82
Very
low 0.7 0 20 0 0 0.4 0.0 0.1 0 25 INSA
Hake from Argentina
(Merluccius hubbsi) 83
Very
low 1.2 0.4 18.1 <0.5 <0.5 0.3 0.4 0.4 0 19
IAB, INSA Hake from South Africa
(Merluccius capensis) 80
Very
18
Values per 100 g of edible part
Fish1 E nerg y (kca l) F a t co nte nt ce teg o ry 2 L ipi ds (g ) O f which sa tura ted fa tt y a cids ( g ) P ro teins (g ) Ca rbo hy dra tes (g ) O f which su g a rs (g ) Sa lt (g ) M o no un sa tura ted fa tt y a cids (M UF As) (g ) P o ly un sa tura ted fa tt y a cids (P UF As) (g ) L ino leic a cid (L A) ( g ) Cho leste ro l (mg ) So urce 4 Blackspotted croaker (Protonibea diacanthus) 94 Very low 1.4 0.3 20 0 0 0.1 0.5 0.2 0 50 INSA
Hake from Chile
(Merluccius australis) 86 Very low 1.5 0.3 18 0 0 0.5 0.4 0.4 0 19 INSA American plaice (Hippoglossoides platessoides) 90 Very low 1.6 0.3 19 0 0 0.7 0.4 0.4 0 85 INSA
Big-scale sand smelt
(Atherina boyeri) 90
Very
low 1.7 0.5 19 0 0 0.1 N.A. N.A. N.A. N.A. TF
Horse mackerel
(Trachurus trachurus) 93
Very
low 1.9 0.6 17.5 1.5 0.6 0.8 0.8 0.9 .0 36 INSA
Nile perch
(Lates niloticus) 94 Low 2 0 19.0 0 0 0.2 N.A. N.A. N.A. N.A. TF
Sardine or European pilchard [small]
(Sardina pilchardus)
94 Low 2 0.8 16.6 1.5 0.6 0.3 N.A. N.A. N.A. N.A. IAB
Black scabbardfish
(Aphanopus carbo) 88 Low 2.8 0.5 15.7 0 0 0.3 1.6 0.2 0 24 INSA
Sardine or European pilchard
(Sardina pilchardus) 108 Low 3.6 1.3 16.5 2.3 0.7 0.9 4 5.6 0.5 20 INSA
Redfish
(Sebastes spp.) 111 Low 4 0.9 18.8 <0.5 <0.5 0.3 0.9 0.5 0 42 INSA
European sprat
(Sprattus sprattus) 99 Medium 4.2 1.9 15 0.9 0.1 0.8 N.A. N.A. N.A. N.A. TF
Blue shark
(Prionace glauca) 130 Medium 5.0 1.0 21 0 0 N.A.
19
Values per 100 g of edible part
Fish1 E nerg y (kca l) F a t co nte nt ce teg o ry 2 L ipi ds (g ) O f which sa tura ted fa tt y a cids ( g ) P ro teins (g ) Ca rbo hy dra tes (g ) O f which su g a rs (g ) Sa lt (g ) M o no un sa tura ted fa tt y a cids (M UF As) (g ) P o ly un sa tura ted fa tt y a cids (P UF As) (g ) L ino leic a cid (L A) ( g ) Cho leste ro l (mg ) So urce 4 European seabass
(Dicentrarchus labrax) 145 Medium 7.9 1.8 10 2.3 1.5 1.1 2 1.7 0.4 52 INSA
Gilthead seabream
(Sparus aurata) 167 High 9.8 2.1 19.7 0 0 0.2 3.6 2.8 0.5 51 INSA
Chum salmon
(Oncorynchus keta) 262 High 21.9 4.2 16.2 0 0 0.2 10 5.1 0.7 40 INSA
1Common name (Scientific name).
512
2Very low fat content: < 2%; Low fat content: 2-4%; Medium fat content: 4-8%; High fat content: > 8% (classification according to Ackman (1990), Afonso (2009) and Gonçalves (2010).
513
3N.A. – Not available.
514
4TF – Technical File (documentation from the Company); IAB – Internal Analysis Bulletin (documentation from the company); INSA – National Health Institute Doutor Ricardo Jorge.
515 516 517 518 519 520 521 522 523 524 525
20
Table 2 – Vitamin and minerals content of the most important fish species consumed in Portugal. 526
Values per 100 g of edible part
Fish1 Vit a min A (µg ) Vit a min D (µg ) Vit a min B 6 (mg ) Vit a min B 12 (µg ) Ash (g) So diu m (Na ) (mg ) P o ta ss ium (K) (mg ) Ca lcium (ca ) (mg ) P ho sph o ru s (P) (mg ) M a g nes iu m (M g ) (mg ) Iro n ( F e) (mg ) Z inc ( Z n) (mg ) So urce 3 Pink cusk-eel
(Genypterus blacodes) 9 0.4 0.1 0.5 1.0 120 260 25 180 25 0.2 0.7 INSA
Tadpole codling
(Salilota australis) 1 0.4 0.1 0.4 1.1 63 360 11 230 28 0.2 0.5 INSA
Angler or monkfish
(Lophius piscatorius) 24 0 0.1 0.3 1.1 86 330 7 210 27 0.2 0.5 INSA
Skate
(Raja spp.) 2 0.4 0.2 0.5 1.9 220 260 160 320 28. 0.3 0.8 INSA
Common dentex
(Dentex dentex) 6 0.9 0.2 1.3 1.1 81 320 12 180 28 0.5 0.5 INSA
Atlantic codfish
(Gadus morhua) N.A.
2 N.A. N.A. N.A. N.A. N.A. N.A. N.A. N.A. N.A. N.A. N.A.
Striped catfish [fillet]
(Pangasius hypopthalmus) N.A. N.A. N.A. N.A. N.A. N.A. N.A. N.A. N.A. N.A. N.A. N.A.
Smooth-hound
(Mustelus mustelus) 3 0.4 0.1 3.3 1.1 170 290 14 190 32 0.1 0.3 INSA
Hake from Argentina
(Merluccius hubbsi) 10 1.4 0.1 0.7 1.1 69 410 15 220 26 0.5 0.7 INSA
Hake from South Africa
(Merluccius capensis) 7 1.1 0 0.6 1.3 120 330 20 180 37 0.3 0.6 INSA
Blackspotted croaker
(Protonibea diacanthus) 1 16 0.3 0.3 1.2 56 430 13 230 31 0.3 0.5 INSA
Hake from Chile
(Merluccius australis) 5 1.3 0.1 0.8 1.3 85 380 43 200 26 0.3 0.5 INSA
American plaice
21
Values per 100 g of edible part
Fish1 Vit a min A (µg ) Vit a min D (µg ) Vit a min B 6 (mg ) Vit a min B 12 (µg ) Ash (g) So diu m (Na ) (mg ) P o ta ss ium (K) (mg ) Ca lcium (ca ) (mg ) P ho sph o ru s (P) (mg ) M a g nes iu m (M g ) (mg ) Iro n ( F e) (mg ) Z inc ( Z n) (mg ) So urce 3
Big-scale sand smelt
(Atherina boyeri) N.A. N.A. N.A. N.A. N.A. N.A. N.A. N.A. N.A. N.A. N.A. N.A.
Horse mackerel
(Trachurus trachurus) 15 4.1 0.4 5.7 1.4 80 400 69 260 33 1.2 1.2 INSA
Nile perch
(Lates niloticus) N.A. N.A. N.A. N.A. N.A. N.A. N.A. N.A. N.A. N.A. N.A. N.A.
Sardine or European pilchard [small]
(Sardina pilchardus)
N.A. N.A. N.A. N.A. N.A. N.A. N.A. N.A. N.A. N.A. N.A. N.A.
Black scabbardfish
(Aphanopus carbo) 23 2.1 0.2 1.7 1.2 140 330 14 180 29 0.1 0.5 INSA
Sardine or European pilchard
(Sardina pilchardus) 47 21 0.6 10 1.7 65 370 72 310 31 1 1.6 INSA
Redfish
(Sebastes spp.) 20 2.3 0.2 2.3 1.2 78 310 15 200 29 0.6 0.6 INSA
European sprat
(Sprattus sprattus) N.A. N.A. N.A. N.A. N.A. N.A. N.A. N.A. N.A. N.A. N.A. N.A.
Blue shark
(Prionace glauca) N.A. N.A. N.A. N.A. N.A. N.A. N.A. N.A. N.A. N.A. N.A. N.A.
European seabass
(Dicentrarchus labrax) 36 5 0.5 1.3 1.7 95 350 52 230 38 0.4 1.2 INSA
Gilthead seabream
(Sparus aurata) 11 12 0.4 4.8 1.4 59 380 15 250 28 0.4 0.8 INSA
Chum salmon
(Oncorynchus keta) 33 11 0.5 1.9 1.3 38 300 12 210 23 0.5 0.5 INSA
1Common name (Scientific name).
527
2N.A. – Not available.
528
3INSA – National Health Institute Doutor Ricardo Jorge.
22 530 531 532 533 534 535 536
Table 5 – Component matrix obtained by factor analysis with Varimax rotation. 537
Property Factor 11 Factor 21 Factor 31 Factor 41
Lipids 0.61 Saturated FA 0.67 Protein -0.44 Carbs 0.47 Sugar Salt 0.50 MUFAs 0.66 PUFAs 0.72 Linoleic A 0.70 Trans FA 0.44 Cholesterol -0.44 Vit A 0.51 Vit D 0.64 Vit B6 0.58 0.42 Vit B12 Ash 0.884 Na -0.78 -0.50 K 0.986 Ca 0.902 P 0.919 Mg 0.989 Fe Zn 0.65
1Loadings under 0.4 were excluded.
23
8. ANNEX A
Table A.1. Pierson correlations between the properties analysed in the 24 most representative species of fish consumed in Portugal.
LIP SFA CAR SUG SALT MUFAs PUFAs LA Tr.FA V.A V.D V.B6 V.B12 ASH Na Ca P
Saturated FA 0.958** 1 Sugar 0.16 0.27 0.925** 1 MUFAs 0.951** 0.957** 0.19 0.14 0.00 1 PUFAs 0.743** 0.812** 0.503* 0.35 0.25 0.874** 1 Linoleic A 0.856** 0.900** 0.43 0.39 0.15 0.891** 0.919** 1 Trans FA 0.01 0.12 0.615** 0.34 0.41 0.26 0.663** 0.41 1 Vit A 0.519* 0.602** 0.691** 0.615** 0.40 0.617** 0.740** 0.712** 0.600** 1 Vit D 0.42 0.498* 0.42 0.25 0.18 0.549* 0.738** 0.622** 0.636** 0.42 1 Vit B6 0.607** 0.698** 0.737** 0.662** 0.40 0.668** 0.812** 0.783** 0.532* 0.693** 0.737** 1 Vit B12 0.18 0.30 0.641** 0.39 0.41 0.36 0.687** 0.477* 0.788** 0.541* 0.612** 0.671** 1 Ash 0.22 0.29 0.604** 0.570* 0.576* 0.26 0.44 0.43 0.41 0.43 0.29 0.625** 0.39 1 Ca -0.15 -0.11 0.35 0.28 0.543* -0.10 0.076 -0.02 0.25 0.01 0.07 0.25 0.20 0.763** 0.562* 1 P 0.06 0.15 0.502* 0.36 0.30 0.17 0.43 0.34 0.523* 0.29 0.40 0.541* 0.511* 0.817** 0.07 0.704** 1 Zn 0.09 0.23 0.903** 0.771** 0.715** 0.20 0.554* 0.43 0.690** 0.614** 0.485* 0.704** 0.717** 0.681** -0.14 0.508* 0.678**
**. Correlation is significant at the 0.01 level (2-tailed); *. Correlation is significant at the 0.05 level (2-tailed). Lipids, protein, carbs, salt, cholesterol, Na, K, Mg, and Fe rows were not presented because correlations were not significant in the entire row. Protein, cholesterol, K, Mg, Fe, and Zn columns were not presented because the correlations were not significant in the entire column.