LCC: SB354-402 UDC: 664.854
EFFECT OF RIPENING STAGE ON THE SOLAR
DRYING KINETICS AND PROPERTIES OF
S. BARTOLOMEU PEARS (Pyrus communis L.)
R.Guinéa *, P.Lopesa, b, M.João Barrocac, D.M. S. Ferreiraa
a
CI&DETS, Polytechnic Institute of Viseu, ESAV
b
Department of Chemistry, University of Aveiro
c
CERNAS, Polytechnic Institute of Coimbra, ESAC (Portugal)
ABSTRACT
Pears of the variety S. Bartolomeu (Pyrus communis L.) have been used over the years in Portugal to produce a traditional dried pear known as “pera passa”. The processing comprehends a solar drying performed at open air, with obvious disadvantages, either concerning the drying efficiency or the sanitary quality of the final product, taking into account that the products are exposed to multiple contamination agents. For these reasons, attempts have been made to study alternative production methodologies, including the use of solar stoves, among others. In the present work pears of the variety S. Bartolomeu (Pyrus communis L.), harvested at three different moments, corresponding to three ripening stages, were dried in a solar stove and their drying kinetics were studied, and the evolution of some properties was monitored along the drying process. From the results obtained it was possible to conclude that the equations used to model the drying kinetics fit with accuracy the experimental data, and that the climatic conditions that occurred in each drying period influenced the drying rate, being essay one clearly faster than the other two essays. On the other hand, considering the evolution of the properties of the pears along drying, it was possible to observe that the pears harvested in the two first dates showed quite similar trends through drying, while the pears harvested at the last date revealed a clear distinct behavior, allowing to deduce that the ripening stage at harvest plays an important role in the drying process.
Key words: Drying kinetics, dried pear, solar drying, solar stove, hardness, total soluble solids, acidity
1. INTRODUCTION
Drying is one of the most widely used methods for preserving foods, based on the removal of water to a level that minimizes microbial spoilage and deterioration reactions (1). Besides preservation, other advantages of drying include lighter weight for transportation and smaller space needed for storage, as well as avoiding the need of expensive refrige-ration systems.
Open-air sun drying has been used since immemorial times to dry grains, vegetables, fruits and other agricultural products. This is a common method used to preserve foods and it is practiced until today in many countries where the combination of solar radiation, temperature and relative humidity is appropriate. However, despite being a cheap method, the open-air natural sun drying is not always applicable to large-scale production (2).
The analysis of the drying processes allows a better understanding of these operations, and eventually the establishment of appropriate operating conditions for further progresses (3).
“Pera Passa de Viseu” denominates a traditional food product produced from pears of the variety S. Bartolomeu (Pyrus communis L.) using a traditional solar drying method, which is based on an open-air exposure (4). Notwithstanding being quite a cheap drying method, making use of the sun as energy source, it has some very important disadvantages, like for example: (1) the process is slow and very much dependent on weather conditions, and (2) the quality of the product is not satisfactorily taking into account factors such as pollution from dust or from animal contamination or other types of infestation and microbial or mould contamination in humid environments (5). Therefore, using a solar stove allows conciliating the cheapness of the method with the improvement in quality by protecting the fruits against external dangers.
As in previous studies the S. Bartolomeu pear have been characterized before and after sun-drying (6,7) the present work aimed to study the effect of ripening stage on the drying kinetics and on some physic and chemical properties along drying. For that three harvest dates were considered: 27th of July (Essay 1), 10th of August (Essay 2) and 20th of August (Essay 3).
e e
W
W
W
W
MR
−
−
=
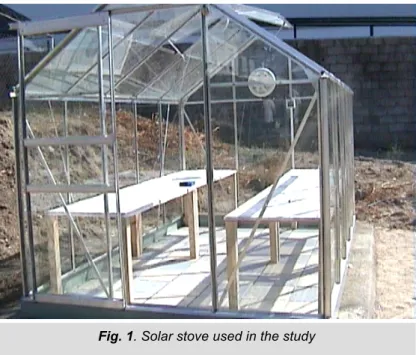
0Fig. 1. Solar stove used in the study 2. EXPERIMENTAL
The solar stove used in this study is a small one (3.2 m long, 1.9 m wide, 2.0 m high in the center and 1.3 m high at the sides). It has a structure made of aluminum that supports the 3 mm greenhouse glass, a door and two roof windows, and the floor is covered with easily washable tiles to facilitate cleaning. The stove has coupled a ventilator to help the air convection, which was operated in the present experiments at the maximum rotating speed of 1700 rotation per minute, corresponding to the extraction of 900 m3/h of air (8).
The drying of pears took place over four tray tables placed inside the drier (2 on one side and 2 on the other side). The tray tables consist of wood structures with 0.5 m high and 1.5 m2 in area (1.5 m long x 0.6 m wide), over which a nylon net was fixed (Figure 1).
Pears of the variety S. Bartolomeu were purchased to a farmer in Oliveira do Hospital, being harvested on three different dates: 27/07/2007, 10/08/2007, 20/08/2007. The pears were dried uncut, after peeling, inside the solar stove, over the nets, and the drying experiments were named essays 1, 2 and 3, according to the harvesting dates. The drying process should be carried out until the moisture content was around 20 % (wet basis) or 25 % (dry basis) (9). A hygrometer (Opus10-Lufft) was placed inside the stove, registering the temperature and relative humidity at 10 minutes intervals. Three samples were removed from the stove everyday at 10:00 h, 14:00 h and 18:00 h, to analyze their moisture content, acidity, total soluble solids and hard-ness.
Moisture content of the pulp was quantified with a Halogen Moisture Analyzer (Mettler Toledo HG53). Total Soluble Solids and acidity was estimated according to previous established methodologies (10). Hardness was measured following the methodology described by Ferreira et al, 2008 (11).
2. MATHEMATICAL MODELING
Simulation models are helpful for the design of new or for the improvement of existing drying systems as well as for the control of the drying operations. The drying kinetics may be fully described through the transport properties of both the material and the drying medium. In the drying of food products, it is typically used the drying constant, K, which combines all the transport properties and may be defined by the thin layer equation (2).
Thin layer equations are equations aimed to describe the drying phenomena in a combined way, despite of the controlling mechanism, and have been used to estimate drying times for several products and to access drying curves. Several thin layer equations, varying widely in nature, are available in the literature and have been used by many investigators to successfully explain the drying of several agricultural products (2,12). The drying kinetics was monitored in terms of evolution of the moisture content along drying, and the data was then expressed in terms of the dimensionless variable moisture ratio, defined as:
(1)
where W is the moisture content at time t, W0 is the initial moisture content and We is the equilibrium moisture
content, all expressed in dry basis. To model the drying kinetics the experimental points (MR, t) were fitted to different empirical kinetic models from literature cited by Baini and Langrish, 2007 (13) and presented in Table 1.
Table 1. Empirical models to represent the drying kinetics.
Model name Equation
Newton MR = exp(- k t)
Page MR = exp(- k tn)
Henderson & Pabis MR = a exp(- k t)
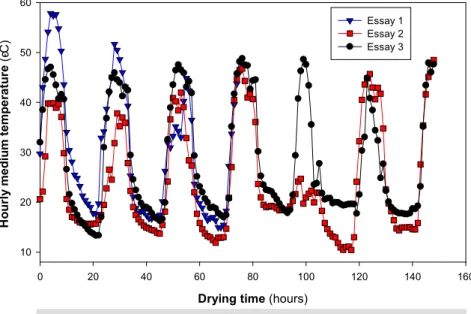
Drying time (hours) 0 20 40 60 80 100 120 140 160 H o u rl y m e d iu m t e m p e ra tu re ( єC ) 10 20 30 40 50 60 Essay 1 Essay 2 Essay 3
Fig. 2. Temperatures inside the stove during the three essays, calculated as a medium for every hour
D rying tim e (hours)
0 20 40 60 80 100 120 140 160 M o is tu re c o n te n t (% w e t b a s is ) 0 20 40 60 80 100 E ssa y 1 E ssa y 2 E ssa y 3 R = 0 .9 8 1 8 R = 0 .9 5 8 7 R = 0 .9 8 8 1
Fig. 3. Variation of wet basis moisture content of the pears along drying, for the three essays
3. RESULTS AND DISCUSSION
In Figure 2 the temperatures inside the stove are represented for the three essays, calculated as a medium of the values registered over an hour period (total of six measurements for each value). It is possible to verify that in essay 1 the drying was quite fast, with the pears reaching the desired fi-nal moisture content (about 20 %) at the 4th day (76 hours), which corres-ponds to approximately half of the drying time of the other two essays (148 hours). This high drying rate ob-served in the first essay could be direc-tly attributed to the very high tempe-ratures that occurred inside the stove in the first two days, reaching almost 60 ºC in the first day and surpassing 50 ºC in the second day.
This can be confirmed in Figure
3, where the variation of the wet basis
moisture content is represented against the drying time, since the slope of the curve for essay 1 is much higher than that of the other two essays. Despite some similarity between essays 2 and 3, it is possible to verify from Figure 3 that the second essay was the slowest. In fact, in essay 3 the temperatures in the first three days reached higher values when compared to essay 2 (see Figure 2), and furthermore in the 5th day a big difference is observed, which corresponded to rainy conditions while essay 2 was proceeding.
The graph in Figure 3 shows that there is a direct relation between the drying time and the moisture of the pears, when expressed in a wet basis (g of water per 100 g of material). The experimental points obtained for the moisture content along drying were fitted to linear functions, being these represented in the graph as straight lines. From the results it becomes once again evident that essay 1 clearly dis-tinguishes from the other two essays, revealing a faster decrease in moisture and consequently a faster drying. As to the data, the correlation coefficient of
the linear fit, R, is lower in essay 2, corresponding to a higher degree of dispersion of the points, attributed to a less regular loss of moisture throughout the drying process, as a consequence of the less stable atmospheric conditions. Figure 4 shows the experimental points of moisture ratio calculated according to Equation (1) for the 3 essays. In the graphs are also shown the fittings corresponding to 4 of the models tested, and which were obtained with software SigmaPlot V8.0, SPSS, Inc. From the figure it can be observed once more that the drying rate is much faster in essay 1 when compared to the other two essays, as previously stated. As to the performance of the different models tested, the four models shown seem to represent quite well the drying behavior of these pears in the three drying essays. However, a clear similarity is observed between the models Newton and Henderson & Pabis, valid for the three essays. As to the models Page and Logarithmic they show slightly different trends, especially for essays 2 and 3.
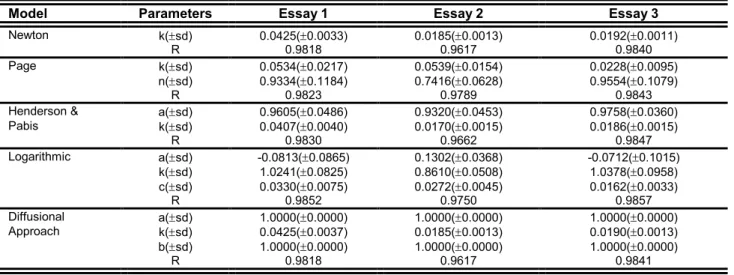
Table 2 resumes the information of the fittings for the 5 models tested, in terms of the values of the model
parameters and their corresponding standard deviations, as well as the regression coefficients for each fit.
The results confirm that the model Henderson & Pabis is very similar to the Newton model, as has been previously affirmed. In fact, in the model Henderson & Pabis the values of the parameter a are very close to 1 and the values of the drying constant, k, are very much like those for the Newton model.
However, despite being similar they are not coincident. As to the Diffusional approach, the fit “fell” into the Newton model, with parameters a and b equal to unity and drying constants like those for that model.
Table 2. Values of the fitted parameters for the models tested.
Model Parameters Essay 1 Essay 2 Essay 3
Newton k(±sd) 0.0425(±0.0033) 0.0185(±0.0013) 0.0192(±0.0011)
R 0.9818 0.9617 0.9840
Page k(±sd) 0.0534(±0.0217) 0.0539(±0.0154) 0.0228(±0.0095)
n(±sd) 0.9334(±0.1184) 0.7416(±0.0628) 0.9554(±0.1079)
R 0.9823 0.9789 0.9843
Henderson & a(±sd) 0.9605(±0.0486) 0.9320(±0.0453) 0.9758(±0.0360)
Pabis k(±sd) 0.0407(±0.0040) 0.0170(±0.0015) 0.0186(±0.0015) R 0.9830 0.9662 0.9847 Logarithmic a(±sd) -0.0813(±0.0865) 0.1302(±0.0368) -0.0712(±0.1015) k(±sd) 1.0241(±0.0825) 0.8610(±0.0508) 1.0378(±0.0958) c(±sd) 0.0330(±0.0075) 0.0272(±0.0045) 0.0162(±0.0033) R 0.9852 0.9750 0.9857 Diffusional a(±sd) 1.0000(±0.0000) 1.0000(±0.0000) 1.0000(±0.0000) Approach k(±sd) 0.0425(±0.0037) 0.0185(±0.0013) 0.0190(±0.0013) b(±sd) 1.0000(±0.0000) 1.0000(±0.0000) 1.0000(±0.0000) Model: Newton Time (hours) 0 20 40 60 80 100 120 140 160 M R = ( W W e )/ (W 0 W e ) 0,0 0,2 0,4 0,6 0,8 1,0 1,2 Essay 1 Essay 2 Essay 3 M odel: Page Time (hours) 0 20 40 60 80 100 120 140 160 M R = ( W W e )/ (W 0 W e ) 0,0 0,2 0,4 0,6 0,8 1,0 1,2 Essay 1 Essay 2 Essay 3 Model: Logarithmic Time (hours) 0 20 40 60 80 100 120 140 160 M R [ (W W e )/ (W 0 W e )] 0,0 0,2 0,4 0,6 0,8 1,0 1,2 Essay 1 Essay 2 Essay 3
Model: Henderson & Pabis
Time (hours) 0 20 40 60 80 100 120 140 160 M R [ (W W e )/ (W 0 W e )] 0.0 0.2 0.4 0.6 0.8 1.0 1.2 Essay 1 Essay 2 Essay 3
Moisture content (g water/g dry solids) 0,0 0,5 1,0 1,5 2,0 2,5 3,0 3,5 4,0 A c id it y ( c m 3 N a O H /1 0 0 g d ry s o lid s ) 0 20 40 60 80 Essay 1 Essay 2 Essay 3
Moisture content (g water/g dry solids)
0.0 0.5 1.0 1.5 2.0 2.5 3.0 3.5 4.0 T S S ( g s o lu b le s o lid s /1 0 0 g d ry s o lid s ) 0 20 40 60 80 Essay 1 Essay 2 Essay 3
Fig. 5. Variation of acidity and TSS (total soluble solids) with moisture content
Therefore, in the present case, this model does not imply a different fit, and that is the reason why it was not represented graphically. When comparing the performance of the models, is possible to say generally that either of the models: Newton, Page, Henderson & Pabis or Logarithmic, can be used to represent the drying kinetics for these pears in the three drying stages, taking in consideration the relatively high values of the regression coefficients. However, for essays 1 and 3 the model Logarithmic is the one that presents the higher value of R, 0.9852 and 0,9857, respectively, whereas for essay 2 the model that presents the highest value of R is Page, corresponding to 0.9789.
Figure 5 shows the variation of acidity and total soluble solids (TSS) along drying, that is to say, as the moisture
content diminishes. From both graphs in Figure 5 is evident that pears harvested in the first dates, corresponding to essays 1 and 2, present quite a similar behavior through drying, while the pears harvested at the last date (essay 3), which were much more ripe, present clear distinct and even opposite contradictory trends. In fact for acidity, which is quite an important sensorial attribute for this kind of product, the pears harvested earlier (essays 1 and 2) show a decrease in acidity along drying, being at first more acid but achieving a low acidity value towards the end of the process, whereas for the pears that were too ripe (essay 3) this property did not change during drying. Therefore, the more ripe pears, despite being less acid before drying, are more acid when dried, if compared to the other two harvests. As to the total soluble solids, once more the difference between essays 1 and 2 and essay 3 is evident. While for the pears of the first two harvests the TSS slightly increases with drying, for the pears of the last harvest, the TSS content decreases with drying. The loss of acidity and increase of TSS along drying observed in essays 1 and 2 is expected since the heat promotes the evaporation of some volatile compounds responsible for the acidity and, on the other hand, the maturation processes proceed during drying, increasing the sugars present. Therefore, when in essay 3 the TSS content of the more ripe pears decreases, this is clearly a result of some degradation of the sugars that takes place during the process. From all that was said, it is legitimate to think that the ripening stage at harvest plays an important role in the subsequent drying operation and sensorial attributes of the end-product.
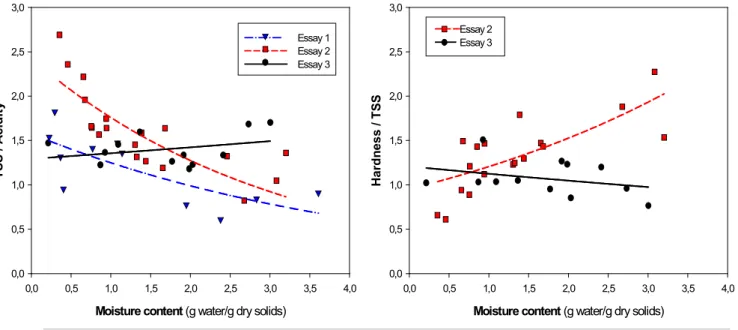
Figure 6 shows how the relations TSS/Acidity and Hardness/TSS change with moisture content. In the first essay
the hardness was not measured and therefore it was not possible to calculate the relation Hardness/TSS for this essay. From the graphs in Figure 6 one can see once more that essay 3 undoubtedly presents a different behavior that the other essays. The ratio TSS/Acidity is used as an indicator of the ripening stage. During the evolution of ripening there is a tendency for this ratio to increase as the fruits become sweeter and less acid (14). As for essays 1 and 2 the relation TSS/Acidity increases, we can infer that along drying the pears are submitted to internal (bio)chemical transformations similar to those that happen during ripening. For essay 3 the behavior is different, and that might be because since the fruit is in an advanced stage of maturation all the internal phenomena that occur in the tissues are closer to those that happen during the senescence stage of fruits, where molecular degradations take place (15,16). For essay 2 the relation Hardness/TSS diminishes along drying, meaning that the pears become softer. As what concerns essay 3, the trends are opposite, and therefore not complying with the desired characteristics that should be developed in drying. In fact in previous work it was shown that the sun-drying process significantly reduced the hardness and fracturability of the tissues that reach a softer and chewy texture (Ferreira et al, 2008).
ACKNOWLEDGEMENT
The authors thank the FCT – Fundação para a Ciência e Tecnologia, for financial support through project PTDC/AGR-ALI/74587/2006
Moisture content (g water/g dry solids)
0,0 0,5 1,0 1,5 2,0 2,5 3,0 3,5 4,0 T S S / A c id it y 0,0 0,5 1,0 1,5 2,0 2,5 3,0 Essay 1 Essay 2 Essay 3
Moisture content (g water/g dry solids)
0,0 0,5 1,0 1,5 2,0 2,5 3,0 3,5 4,0 H a rd n e s s / T S S 0,0 0,5 1,0 1,5 2,0 2,5 3,0 Essay 2 Essay 3
Fig. 6. Variation of the relations TSS/acidity and Hardness/TSS with moisture content
4. CONCLUSIONS
From the results obtained in the present work is possible to conclude that the weather conditions have an important influence on the drying rate, with higher temperatures corresponding to faster drying processes. Furthermore, it was observed that the drying kinetics, expressed in terms of moisture ratio, can be well represented by either of the models: Newton, Page, Henderson & Pabis or Logarothmic, which revealed to fit with relative accuracy the experimental data for the three essays that correspond to three different ripening stages.
As to the variation of some physic and chemical properties of the pears along drying, the results enable us to conclude that the pears harvested in the first dates, corresponding to essays 1 and 2, present quite a similar behavior through drying, while the pears harvested at the last date (essay 3), which were much more ripe, present clear distinct trends. Therefore, it is legitimate to infer that the ripening stage at harvest plays an important role during the drying process, resulting in dried pears with different sensorial attributes. As the acidity and the texture are important aspects for the acceptance of this product by the consumers this work demonstrated that the pears should be harvested in an optimal moment of ripening.
REFERENCES
1. I. Doymaz. The kinetics of forced convective air-drying of pumpkin slices. Journal of Food Engineering 79: 243-248 (2007).
2. I.T. Togrul and D. Pehlivan. Modelling of thin layer drying kinetics of some fruits under open-air sun drying process. Journal of Food Engineering 65: 413-425 (2004).
3. A. Fadhel, S. Kooli, A. Farhat and A. Bellghith. Study of the solar drying of grapes by three different processes. Desalination 185: 535-541 (2005).
4. M.J. Barroca, R.P.F. Guiné, A. Pinto. F.M. Gonçalves and D.M.S. Ferreira. Chemical and microbiological characterization of Portuguese varieties of pears. Food and Bioproducts Processing 84: 109-113 (2006). 5. D. Ferreira, A. Barros, M.A. Coimbra and I. Delgadillo. Use of FT-IR spectroscopy to follow the effect of
6. D. Ferreira, S. Guyot, N. Marnet, I. Delgadillo, C.M.G.C. Renard and M.A. Coimbra. Composition of phenolic compounds in a Portuguese pear (Pyrus communis L. var. S. Bartolomeu) and changes after sun-drying. Journal of Agricultural and Food Chemistry 50: 4537-4544 (2002).
7. R.P.F. Guiné, D.M.S. Ferreira, M.J. Barroca and F.M. Gonçalves. Study of the solar drying of pears. International Journal of Fruit Science 7: 101-118 (2007).
8. R.P.F. Drying kinetics of some varieties of pears produced in Portugal. Food and Bioproducts Processing 83: 273-276 (2005).
9. V.T. Karathanos and V.G. Belessiotis. Sun and artificial air drying kinetics of some agricultural products. Journal of Food Engineering, 31, 35-46 (1997).
10. Association of Official Analytical Chemists (AOAC). Official Methods of Analysis, 15th Ed. ,Arlington, VA (1990)
11. D. Ferreira, J. A. Lopes da Silva, G. Pinto, C. Santos, I. Delgadillo and M.A. Coimbra. Effect of sun-drying on microstructure and texture of S. Bartolomeu pears (Pyrus communis L.). Eur Food Res Technol 226: 1545-1552 (2008).
12. B. Nourhène, K. Mohammed and K. Nabil. Experimental and mathematical investigations of convective solar drying of four varieties of olive leaves. Food and Bioproducts Processing 86: 176-184 (2008).
13. R. Baini and T.A.G. Langrish. Choosing an appropriate drying model for intermittent and continuous drying of bananas. Journal of Food Engineering 79: 330-343 (2007).
14. I. Iglesias and G. Echeverría. Differential effect of cultivar and harvest date on nectarine colour, quality and consumer acceptance. Scientia Horticulturae 120: 41–50 (2009).
15. S. Fonseca, L Hackler Jr., A. Zvara, S. Ferreira, A. Baldé, D. Dudits, M.S. Pais and L.G. Puskás. Monitoring gene expression along pear fruit development, ripening and senescence using cDNA microarrays. Plant Science 167: 457-469 (2004).
16. L.C.O. Lima, B.M. Hurr and D.J. Huber. Deterioration of beit alpha and slicing cucumbers (Cucumis sativus L.) during storage in ethylene or air: Responses to suppression of ethylene perception and parallels to natural senescence. Postharvest Biology and Technology 37: 265–276 (2005).