0 Work Project, presented as part of the requirements for the Award of a Master Degree in
International Finance from NOVA and Economics from Insper
Underpricing in Corporate Bonds: Empirical Evidence from Brazil
Felipe Fernandes Arnone - 39596
A project carried out on the double degree program, under the supervision of: Giorgio Ottonello
Klenio Barbosa
1 Abstract
This work studies the presence of underpricing on corporate bonds in Brazil, and how different factors impact it. The effect can be defined as the difference between the initial public price of the asset offered and its price on the first day of trading. Based on analyses made with over 800 corporate debt issues, we find, using linear regression, evidence that underpricing is present in the Brazilian market, with first trades in the secondary market presenting a premium over-issuance. The tests suggest that during periods of economic stress underpricing is intensified in Brazil; Having a big bank as a lead underwriter is not relevant to explain the effect. Asymmetric information is a relevant driver for underpricing; Liquidity has an impact on pricing, but it is related to the type of instrument instead of the amount issued or traded.
Keywords: Underpricing; Brazil Capital Market; Corporate Debt; Asymmetrical Information
This work used infrastructure and resources funded by Fundação para a Ciência e a Tecnologia (UID/ECO/00124/2013, UID/ECO/00124/2019 and Social Sciences DataLab, Project 22209), POR Lisboa (LISBOA-01-0145-FEDER-007722 and Social Sciences DataLab, Project 22209) and POR Norte (Social Sciences DataLab, Project 22209).
2
Table of contents
1. Introduction... 3
2. Institutional aspects... 5
a) Brazilian debt market ... 5
b) What is a Debenture? ... 6
c) Public offer using regulation CVM n°400 (IN 400) ... 7
d) Public offer using regulation CVM n°476 (IN 400) ... 7
e) Debentures Subsidized ... 8
3. Assessment of the Literature ... 8
a) Underpricing ... 8 b) Bookbuiding process ... 10 c) Asymmetric Information ... 10 d) Liquidity ... 11 e) Market Risk ... 12 4. Database ... 13
a) Collecting the data ... 13
b) First day of negotiation ... 13
c) Outliers ... 14 d) EMBI Index ... 15 e) Leader underwriters ... 16 f) Sample ... 18 5. Methodology ... 19 a) Response variable ... 19 b) Multivariate analysis ... 20 6. Results ... 21 a) Matrix of correlation ... 22 b) Univariate Analysis ... 22 c) Multivariate analysis ... 24
d) Evaluating the results of the final model ... 26
i. Dummy variables ... 26
ii. Continuous variables... 27
e) Evaluating coefficients with different time intervals between issuance and first trade in the secondary market ... 28
f) Testing interaction between variables, evaluating further underpricing in periods of economic stress ... 30
7. Conclusion ... 32
8. References... 33
3 1. Introduction
Underpricing is defined as the act of placing an initial public offering (IPO) at a price lower than its real value in the market. As a result, the new asset closes its first day of trading with prices above the issuing price. Ibbotson (1975) analyze the NYSE’s IPOs for the period between 1960 and 1969 and find the jump in prices of stock from the IPO, and the first day of trade is 11,4%. This phenomenon is costly to issuers since they end up raising less capital than their asset is worth. For instance, a company issues 10% of its shares in exchange for $90. At the end of the first day of trading, the same 10% is valued at $100. This company could have raised an extra $10 for the same shares, leaving money on the table. Due to this negative side of IPOs, a wide range of papers focus on understanding what the causes of underpricing are and how an issuer can minimize them. Usually, studies relate the effect with information problems (Rock (1986)), conflicts between stakeholders (Ibbotson (1975)), market conditions (Rajan and Servaes (2002)) and liquidity of the assets offered (Ellul and Pagano (2006)). If these are the causes of underpricing, we should expect to see it happening with all kinds of assets, not only stocks. Recent studies, like Kelly, Helwege, and Warga (2007), find evidence of underpricing also on corporate debt issues.
This study emerges in a time in which the debt capital market in Brazil is fast changing, with records in the number of debt issues happening in the last two years. Stakeholders can use the findings of this study to support them in their decision-making process. We aim to investigate whether underpricing exists in the Brazilian corporate bond market. If evidence of underpricing is found, we seek to analyze its determinants.
In our analysis, we use data gathered from the website debentures.com and the Bloomberg platform. The first data provider is the biggest database for Brazilian bonds. We use it to collect information about all trades that happened in the secondary market and all bond IPOs for the period between January 2010 and early 2019. Our sample covers over 110.000 trades of 1.518 bonds. The
4 second source is a well-known provider of information that was used to get complimentary information from the issues (e.g. Rating, Private or Public, industry). Our statistics and preliminary tests show that underpricing exists in the corporate debt market.
To conduct our empirical analysis on the determinants of underpricing in the corporate bond market in Brazil, we investigate and use as response variable the difference in price between issuing and first trade on the secondary market, a methodology that was developed and used by Weinstein (1978). This method does not provide the absolute return, but it says a lot about premium and discounts applied. We hereafter refer to this as the DeltaPU Brazil.
First, we do a univariate analysis using a t-test, which confirmed, with 99% confidence, the existence of underpricing in Brazil's corporate debt market. Further, we perform multivariate analysis, using ordinary least squares regression (OLS) method. We execute several tests to remove from the model variables that are not relevant. Results of the final model indicate that asymmetric information has a positive impact on underpricing, increasing the premium as less information is available. Additionally, we find evidence that liquidity can influence underpricing, but this is more related to the specificities of the Brazilian market rather than the issue amount and trade volume. Surprisingly, the underwriter being a large bank is not helpful in explaining underpricing. At last, our findings show that in periods of market stress the effect of underpricing is intensified.
A reader can question whether our results would persist if our analyses focused on a more restrictive period between issue and trade (smaller than 180 days); and if the variables would behave in the same manner during periods of crisis. To address those concerns, we perform additional tests to ensure the results are robust. First, we evaluate how variables behave for different time intervals between issuing and trade. As the time frame reduces, the explanation level
5 of the variables increases, probably because fewer external factors influence it. Even though some determinants lost their relevance, we still have at least one for each of the main theories (liquidity, asymmetric information and market risk), guaranteeing that our previous results are relevant. Secondly, we test a new model containing interactions between each dummy and dummy variable – After 2015 (issues that happened after the year of 2015, the year that the crisis started in Brazil). The model presents a gain on explanatory power represented by its R squared, reinforcing the concept that issues made in crisis periods hold their own nuances. This test confirms that in a crisis period, an investor requires higher premiums, consistent with what was first seen in our analysis.
This paper is organized in the following manner: In Section 2, we explain the institutional aspects, in Section 3, the literature used as reference. Section 4 and 5 features the methodology applied and database used. Results are discussed in Section 6 and the conclusion is presented in Section 7.
2. Institutional aspects
a) Brazilian debt market
In recent years, the issuance of corporate bonds has been an alternative to the traditional loans done by big commercial banks. Based on Anbima reports of June 2018, considering all debt instruments in the first semester of 2018, a total of R$ 105,6bn was raised via capital markets; Debentures (instrument compared to corporate bonds) were the most used ones representing 57% of this amount. The amount raised with debentures has increased in the last couple of years. In 2018, the total value issued was 44% more than in 2017 and 130% more than in 2016. We can relate it with: Decrease in interest rates; Reduction of inventory capacity from big banks; Increasing demand from fixed income funds; and development of independent platforms for small investors. The secondary market is also developing; funds are using those assets as a solution to
6 maintain the levels of return. Additionally, an increased number of brokerage houses are offering debentures as a product for smaller investors.
Graph 1 – Volume of proceeds raised with Debentures in Brazil
Hawkins (2002) points out that banks have a decisive role in bond markets in emerging economies, unlike other markets where underwriting is competitive and dominated by international investment banks (Manconi (2018) and Carbo-Valverde (2016)). In Brazil, the market is known for being concentrated in a few big institutions that hold most of the loans. “Banco Central do Brasil” published that the five biggest banks were responsible for 83,8% of the debt market in 2018. Issuers end up seeing these institutions as the only options to raise funds.
b) What is a Debenture?
Around the world, a bond is known as the debt instrument issued to raise funds. In Brazil, the instrument is called a Debenture, assuming the role a Bond does in all other markets and enabling it to assume different characteristics (e.g. secured, convertible, Perpetuum, junior).
These issuances in Brazil must follow strict rules imposed by CVM (Comissão de Valores Mobiliários), the entity responsible for monitoring and developing the securities market in Brazil.
54,9 63,3 130,7 91,1 136,7 75,7 80,4 96,7 152,1 23,7 R$20 R$40 R$60 R$80 R$100 R$120 R$140 R$160 2010 2011 2012 2013 2014 2015 2016 2017 2018 2019 B ill io ns
7 There are two principal regulations regarding debentures that end up defining the kind of issuance made, CVM 400 and CVM 467.
c) Public offer using regulation CVM n°400 (IN 400)
The traditional way to access the debt capital market is using CVM n° 400. Companies that choose to go to market with this rule are aware that they will need to fill a more significant number of requirements and disclosures (e.g. risk factors, detailed use of proceeds, results from the past three years, previous analysis of CVM). Because of these obligations, these issuances are more costly compared to CVM n°476. On the other hand, they provide more disclosures for investors and do not have restrictions on investment. They can be bought by all investors, they do not have limitations on the number of buyers, and holders can commercialize them on the secondary market following settlement (no lock-up clause). Issuances of this type tend to be more liquid and used by bigger companies that already have disclosure information available.
d) Public offer using regulation CVM n°476 (IN 476)
This law was created in 2009 and has modernized and facilitated access to the debt capital markets. An issuer that chooses to use it has to fill fewer obligations than IN 400, making the process faster and cheaper. In this case, there is no need for previous analysis, registration on CVM, or development of an offer prospectus.
The negative side of this regulation is that it can only be offered to a maximum of 75 investors and only 50 are allowed to invest, which is meant to spur underwriters to sell/offer the title to the right investors. The target market for this law are professional investors, private investors, or institutions that have more than R$ 10 million ($ 2,3 million). Regarding the secondary market, investors are allowed to negotiate, but issuances of this kind have a lock-up period of 90 days, and since they are less transparent and more restricted to invest in, they become more illiquid on the market.
8 The type of issuance (CVM 400 or CVM476) will be used as a variable to evaluate asymmetric information once we have evidence that investors have more disclosures from of the issuers in type CVM400.
e) Debentures Subsidized
Infrastructure debentures (law 12.431) were created in 2011, in support of development projects throughout the country. These debentures have a subsidy from the government that does not charge taxes on personal investments. Recently, many funds have been established with a focus on these debentures that can promote good returns with lower volatility compared to the benchmark. Nevertheless, as the name suggests, only specific issuances can get subsidized, reducing supply.
3. Assessment of the Literature
First, we formulate questions that will guide this work. Secondly, we discuss the main topic of this study, the underpricing effect. Moreover, we will illustrate the process for issuing a debenture.
a) Underpricing
First, it is essential to define what underpricing is and why it occurs. When a company wants to issue any security (e.g. bond, debenture, stock) it needs to define the price it will be sold in the market. The price is relevant because it determines how much the issuer will have to sell to the market in order to receive the expected proceeds. Usually, companies hire underwriters to determine the price of the securities to be sold. These agents try to define the “right” price for the offering, but usually, issuances are underpriced, resulting in a considerable price jump on the first day of trading, from adjustment to true market value. As a result, issuers leave money on the table (Loughran and Ritter (2004)).
9 Over the last 50 years, a wide variety of studies were published about the United States equity market focused on explaining why underpricing happens and what could be done to reduce it. These studies found that investing an IPO, on average, would provide positive returns (Reilly and Hatfield (1969), Stickney (1970), Logue (1973)). In 1975, Ibbotson tested data between 1960 to 1969, from NYSE, and find that IPOs investors have, on average, a positive return of 11,4%. The authors highlight as a viable explanation the possibility of arrangements between underwriters and investors. Underwriters would apply discounts to the valuation in order to compensate for the risk of asymmetric information over the issuers, avoiding any potential lawsuits that could be launched by angry investors.
Even though it is possible to find a vast number of studies regarding underpricing on stocks, research focused on the debt market is limited. Hickman (1958), evaluate that bonds trade with a premium in the secondary market when compared with recently issued debentures. Stolz (1992) observes the same kind of phenomenon in the T-Bills market and concludes that it is possible to profit with this strategy. Kelly, Hekwege, and Warga (2007) decided to expand the research and focus their study on liquidity, the book building process, and information models for bonds. They found evidence that underpricing is not connected to liquidity or subsequent trading, they relate it to informational issues instead.
The literature above, in general, gives us an indication that the price of a bond during its issuing tends to be lower than the actual price on the secondary market. As we could not find research on this theme for the Brazilian debt market, we seek to explore the following question: Can we identify evidence of underpricing in debentures issued in Brazil?
10 b) Bookbuiding process
The bookbuilding process seeks to define the issuing price an asset will be sold for. Usually, underwriters will analyze and advertise estimations of how much the asset should be worth based on related transactions, valuation models and market conditions. With this information, potential investors tell underwriters how much they would buy from the issuer for a range of prices. The lead coordinator will then check what is the best and final price for the issuer, in order to allocate the full amount requested. This process takes place rather quickly, often times in under one week.
c) Asymmetric Information
In the literature, we can find many studies that compare retail banks with investment banks under the duty of lead underwriters for debt and equity issuing. Drucker and Puri (2007) analyze how commercial banks can easily collect information about sectors and customers that are not available to the public and thus have many advantages. Fama (1985) affirms that banks have access to private and confidential information because they work as insiders at the firms, while the rest of the market just has access to the public material. Drucker and Puri (2007) highlight that when these banks have the role of lead underwriter, they can choose to reduce the asymmetry of information.
It is interesting to analyze if the banks have incentives to minimize the asymmetry of information. Kantas and Qi (2003) discuss the trade-offs between economies of scale and the conflicts of interest within commercial banks. A commercial bank that already knows its client, having a long track record with the firm, can certify that they have good credit quality. His improves confidence for investors, and they will feel safer about investing. Alternatively, the bank could omit relevant information from the public, such as a bad loan from the past. Commercial banks usually have to guarantee the demand (underwriting the facility) in order to obtain the mandate. On the other hand, Nagler and Ottonello (2019) argue that as the inventory capacity of
11 underwriters decreases, it creates an incentive to allocate more bonds to relationship investors that push for lower prices at the issuances, increasing underpricing. In summary, the use of a “pure” boutique or investment bank might result in a more independent analysis but it brings the risk of overvalued issuing with no guarantee of demand.
In the famous study “The Market for Lemons,” developed by Akerlof (1970), he analyzes how the quality of goods traded can degrade with the existence of asymmetric information between buyers and sellers. Since buyers are not able to distinguish good products from bad, they will only pay an average price for it, but sellers that know what they have will not agree in selling their quality products for a lower price. Eventually, these good sellers will leave the market and only “lemons” will stay. Spence (1974) tests if signalization, the capability of one party to expose some information about itself to the other player, can reduce the asymmetric information between them and improve market efficiency.
These two studies links with the underpricing effect once firms want to issue their assets for the best value possible, signalizing their qualities and reducing asymmetric information. Investors will interpret information disclosure. Companies they judge to be of higher quality can set more competitive issuing prices, segregating themselves from bad companies and achieving higher values.
d) Liquidity
It is possible to describe liquidity as how easily an asset can be bought or sold in the market at a price that reflects its real value. Essentially, how easy it is to convert something into cash without discounts.
Literature is vast regarding how liquidity may impact the pricing of assets. Ellul and Pagano (2006), say that underpricing is compensation for the risk of illiquidity of a stock after its IPO. In
12 their studies, they measure the impact of underpricing and predict its direction. In contrast, Booth and Chua (1996) argue that high underpricing can discourage IPO investors from trading more, resulting in worse post-IPO liquidity.
For instance, Eleswarapu and Reinganum (1997) investigate the seasonal liquidity premium in asset pricing. Their findings include evidence of reliably positive returns for investments made and held during January, something that does not happen with any other month. This effect is known as the January Effect. Studies attribute this due to tax harvesting, repurchases of assets creating a rally in the market, and changes in the supply and demand of assets during this month. These results go against what was first found by Amihud and Mendelson (1986). They affirm that there is no evidence for positive returns from buying and holding.
e) Market Risk
Norden e Weber (2009) study the relationship between movements in Credit Default Swaps (CDS) and discounts in bond rates. They find that CDS are good predictors for how rates behave. Standard & Poor’s, Moody’s, and Fitch, have a strong correlation between CDS and ratings applied to sovereign and corporate debt issuance. Rajan and Servaes (2002) show that changes in market conditions are responsible for causing underpricing, as windows of opportunity become available for new issues. In the research performed by Fender, Hayo, and Neuenkirch (2012), they find that spreads in the sovereign CDS of emerging markets are more strongly related to international spillover effects during periods of market stress.
Since the impact in pricing is not constant in specific points in time, it seems to make sense that market conditions can affect rates in the Brazilian market. Based on that, we decided to investigate further how changes in market risk influence underpricing.
13 4. Database
In this section, we disclose the process of collecting the data, criteria used to select the sample, and a brief description of how it is composed.
a) Collecting the data
For our database, we use two primary sources of historical information: Website www.debêntures.com.br and the Bloomberg platform. From the website, we extract data regarding all IPOs and seasoned Debentures issued in Brazil since 01 of January of 2010 until 03 of April of 2019. This period was selected because in January of 2009 rules were changed, and the process got facilitated with CVM 476. However, only in 2010 did this type of issue became more frequent. We used the Bloomberg platform to get complimentary information from each issue manually (e.g. if a company is private, has an issuing rating, industry).
Within the database, we eliminated issues with a notional value smaller than R$ 10 million (criteria used for liquidity). After all filters, it yielded 1.267 issues, from 525 companies, corresponding to a total of 12.745 trades in the secondary market. It is essential to have a higher number of facilities than companies to evaluate the significance of asymmetric information for different liabilities released by the same issuer through time. We would expect that with time, investors learn about a company and reduce the asymmetries of information.
b) First day of negotiation
There is no defined rule for how long the first investor must hold the asset that has been purchased. What is known is that some types of facilities face restrictions. Issuances type CVM 476 have 90 days of lock-up period, restricting the debenture from being traded in the regular market. In Graph 2, we can see a concentration of trades happening after 90 days due to this fact. The same rule does not apply for CVM 400, which is traded in all time ranges.
14 In order to evaluate the impact of pricing in a title, we compare the price during issuance with the first trade in the secondary market day. Fung and Rudd (1986) argue that this methodology is the right one to be used. The last filter proposed to the sample is to remove from our base companies those that had first trading only 180 days after the issue date. Since our research focuses on asymmetric information, there is a risk of these deals being affected by other factors. In the end, our database is composed of 803 observations of 339 firms that correspond to all issuances that had a negotiation and followed all filters proposed.
Graph 2 - Histogram representing the quantity of first trading is in the secondary market per day after issuing
c) Outliers
During methodology, we explain that Delta PU is used as a response variable for our model. The value of it is higher than 0 when the first trade in the secondary market has a price higher than the curve price during issuance (premium) and lower than zero for the opposite (discount). For instance, a premium occurs when the secondary market evaluates that the title could have a lower yield, increasing its price and selling with a gain. The same effect happens in the equity market; oftentimes, IPO price is lower than the trade price of a stock. We illustrate how Delta PU is
0 5 10 15 20 25 1 10 25 40 55 70 85 100 115 130 145 160 175 Graph 2 - Number of first trade
Number of days after issuance
N um be r o f tit le s tr ad ed
15 distributed through our sample, in Graph 6 of the appendix. After evaluating the output, it is evident that our database has outliers that could, somehow, disserve our study.
In this context, there are two possible alternatives to control it. The sample could be trimmed with a percentage of each side of the sample selected and removed from the base; alternatively, one could use winsorizing, which consists of limiting extremes, based on a percentage of each tail of the sample, but not removing the observation. Thomas and Ward (2006) find in their studies that the winsorized method is adequate to deal with this kind of situation. Following this methodology, we conduct a 98% Winsorization (1% in each tail) to the response variable (Delta PU) and all other continuous variables in our database. The result of the treatment can be seen in graph 3, which shows a much clearer pattern.
Graph 3 – Scattered plot representing the difference between issuing price and first trade (Delta PU) after Winsorization method
d) EMBI Index
In trying to understand how market risk could impact pricing in the Brazilian debt market, we searched for a market index that would be able to represent Brazilian risk. JP Morgan created, in 1992, a benchmark index to measure the daily performance of debt titles from emerging countries. This one is named EMBI (Emerging Markets Bond Index). It was created to support
-8 -6 -4 -2 0 2 4 6 8 10 0 30 60 90 120 150 180 D el ta P U
Days after issuance
16 investors in their decisions and expose the difference of average daily returns between US treasury (that is a reference for a “risk-free” title).
Graph 4 represents the analyzed period for Brazil EMBI Index. As we look to the average of the period, dashed line, we can notice a in 2015. The behavior of the Market risk in Brazil has changed during the range of time analyzed, facing this fact, we create a variable to reflect if a debenture was issued after the year of 2015 and to check if there is a relevant difference. Even though in February of 2018, Codace (committee responsible for evaluating economic cycles) defined that the period of retraction of Brazil’s economy had ceased in October 2017, its economy has been recovering much slower than what was expected, with a GDP growth close to only 1% in 2017 and 2018.
Graph 4 – Representing the EMBI index for brazil since 2009
e) Leader underwriters
Commercial banks have advantages when monitoring the debt market since they have private information from their clients and investors, enabling them to collect relevant insights about debtors that are not public to investors. Essentially, they face economies of scale once they are more prominent with more information and credibility. Thinking this way, they would have an
0 100 200 300 400 500 600 2009 2010 2011 2012 2013 2014 2015 2016 2017 2018 2019
17 advantage once asymmetric information is reduced, as more issuers would look for them in future deals.
On the other hand, the same bank has institutional investors that expect them to offer good deals. It is essential to banks to maintain a good relationship with those houses, guaranteeing that new issuances will have demand and banks will not keep the liabilities in their books. Thus, commercial banks always face a dilemma when pricing an asset. The data to confirm who is the lead underwriters is available on www.denbenture.com and we double-checked with Bloomberg.
We define a big bank in Brazil, one that has a book equity value of more than 50 billion reais. Using as reference the financial statement of Dec/2018, was selected as such the following banks: Itau S/A (Equity Value: R$ 137bn); Bradesco S/A (Equity Value: R$ 121bn); Banco do Brasil S/A (Equity Value: R$ 100bn); Santander Brasil S/A (Equity Value: R$ 96bn). In Graph 5, we can notice that these represent a significant portion of insurances from our sample. Even though BTG is a relevant issuer we preferred not to include it, following the criteria of minimum book equity value that also results in a smaller capacity of allocation in their inventory.
Graph 5 – Number of issuances per underwriter in the sample
0 50 100 150 200 250 300
BANCO ITAU S/A BANCO BTG PACTUAL S/A BANCO DO BRASIL S/A XP INVESTIMENTOS CCTVM S/A BANCO SAFRA S/A HSBC BRASIL S/A BANCO FATOR S/A BANCO CAIXA GERAL BRASIL S/A BRASIL PLURAL S/A INDUSVAL S/A CTVM
18 f) Sample
The final sample used to examine underpricing consists of 803 observations. From the 1st of January 2010 to 3rd of April 2019, a total of 339 companies issued debentures with issuance value (amount raised) of more than 10 million reais in the Brazilian capital market and had a trade in the secondary market in 180 days after issue. Table 1, below, summarizes the sample and provides further disclosure about the explanatory variables that will be used in our analysis.
Table1 – description of the sample
Complete sample with the first trade just after the issuing of the Debenture. In this table, we present the average, standard deviation, maximum and minimum levels for each attribute.
Sample N° of observations Percentage Average Std. Dev. Min Max
Issued titles 803 100% 0,31 1,68 -6,18 8,43 Companies (Issuers) 339 Issued/Companies 2,37 Dummies variables CVM400 177 22% 0,0670 0,9065 -6,18 8,43 CVM 476 626 78% 0,3849 1,8300 -6,28 8,43 Public company 401 50% 0,0973 1,2395 -6,18 6,57 Private company 402 50% 0,5319 1,9970 -6,18 8,43
Coordinator leader is a big bank 512 64% 0,3231 1,5175 -6,18 8,43
Others 291 36% 0,3000 1,9252 6,18 8,43
Rating assigned during issuing 339 42% 0,4334 1,9778 -6,18 8,43
Non-rated 464 58% 0,1526 1,1216 -6,18 8,43
Two or more debentures issued 653 81% 0,1796 1,4120 -6,18 8,43
First Debenture Issued (debut) 150 19% 0,9037 2,4410 -6,18 8,43
Subsidized Debenture 161 20% 1,1143 2,7799 -6,18 8,43
Normal 642 80% 0,1144 1,1760 -6,18 8,43
After 2015 439 55% 0,4999 1,9462 -6,18 8,43
Before 2015 364 45% 0,0917 1,2414 -6,18 8,43
Issued in Jan 33 4% -0,1664 0,4906 -2,22 0,51
Not Jan or Jan 770 96% 0,3355 1,7052 -6,18 8,43
Control variables
EMBI when issued 250 61 147 465
EMBI during trade 253 65 145 499
Maturity (in days) 2039 1089 243 5830
Amount issued (R$ Million) 349 356 15 1900
19 Analyzing Table 1, we can notice that, on average, each company issued approximately 2,4 titles of debt. The big banks (four players) acted as underwriters’ in 64% of all issuances done during the studied period. Nearly half of the bonds were from private firms. Just a small portion of the samples are Subsidized Debentures (20%); this happens because this kind of incentive is given if the resources raised are used for infrastructure projects. As anticipated, most of the samples (78%) are issuances CVM 476, which is simpler and less costly to issue, and only 22% are CVM 400. The major part of the sample (81%) are related to seasoned offerings. Only a few titles (4%) were issued in January during the period used for our analysis; this low quantity may be linked with a cold market situation, as its holidays and summer vacations in Brazil.
When we analyze the variable After 2015, we notice that 55% of the issuances belong to this period, even though it is a smaller period of the samples. Mostly, it happened because companies started to anticipate their needs for resources as they were facing an adverse scenario of elections for 2018 and an increase of appetite from investors that changed their portfolio from Brazilian government bonds, which the interest rates were decreasing, to corporate credit with higher yields. The table gives us the information that, on average, the titles issued after 2015 have a higher discount. Even though these results have no statistical significance, the values found are aligned with the literature addressed above and may strengthen theories that asymmetric information and market risk are relevant for underpricing in debentures issued in Brazil.
5. Methodology
a) Response variable
To study underpricing, the response variable needed to be related to the comparison of rates between emission and first trade. The quality of corporate bond pricing information is not as good as usually available for equity, lacking much disclosure about prices used during trades. The solution is to use the average percentual price of trade compared to the par value of the title in the
20 curve. In Portuguese, called “Preço unitário na curva” (represented as %PU), this data is provided by debentures.com.
Used in the base of 100%, it represents the fair price of the facility considering all future payments until the present date. If the prices are above 100% investors are paying a premium for it (less yield), and the opposite represents a discount (more yield). We start our analysis calculating the difference on yields during issuance and first trade using the following formula:
𝐷𝑒𝑙𝑡𝑎 𝑃𝑈, % = 𝑃𝑈, % − 100%
(1) In order to preserve the possible negative numbers of Delta PU we decided not to use the logarithms returns. With i = 1,2,3…, x, representing each debenture of the base, the “n” represents the number of days between the issuance (t) and the first trade in the secondary market. Even though this response variable does not provide the absolute return of the investment, it can transmit much information regarding premium and discounts applied in secondary market trades.
b) Multivariate analysis
The idea behind this research is to understand how the determinants are influencing price setting. We propose to evaluate it using the method of multivariate OLS regressions. We use fixed effects at the issuer industry level, and cluster standard errors at the issuer level. Looking to control the average differences across it in any observable or unobservable predictors and for heteroscedasticity. The subsequent model is proposed based on the previous studies covered; we will refer to it as the baseline model:
𝐷𝑒𝑙𝑡𝑎 𝑃𝑈, = 𝛽 + 𝛽 𝐼𝑠𝑠𝑢𝑒𝑅𝑎𝑡𝑖𝑛𝑔_𝐷𝑚𝑦 + 𝛽 𝐵𝑖𝑔𝐵𝑎𝑛𝑘_𝐶𝑜𝑜𝑟𝑑𝑖𝑛𝑎𝑡𝑜𝑟_𝐷𝑚𝑦 + 𝛽 𝑃𝑟𝑖𝑣𝑎𝑡𝑒_𝐶𝑜𝑚𝑝𝑎𝑛𝑦_𝐷𝑚𝑦 + 𝛽 𝑆𝑢𝑏𝑠𝑖𝑑𝑖𝑧𝑒𝑑_𝐷𝑒𝑏_𝐿𝑒𝑖12431_𝐷𝑚𝑦 + 𝛽 𝐷𝑒𝑏_476_𝐷𝑚𝑦 + 𝛽 𝐹𝑖𝑟𝑠𝑡_𝐷𝑒𝑏_𝐺𝑟𝑜𝑢𝑝_𝐷𝑚𝑦 + 𝛽 𝐴𝑓𝑡𝑒𝑟2015_𝐷𝑚𝑦 + 𝛽 𝐼𝑠𝑠𝑢𝑒𝑑_𝐼𝑛_𝐽𝑎𝑛𝑢𝑎𝑟𝑦_𝐷𝑚𝑦 + 𝛽 𝐼𝑠𝑠𝑢𝑎𝑛𝑐𝑒_𝑆𝑖𝑧𝑒 + 𝛽 𝐴𝑚𝑜𝑢𝑛𝑡𝑡𝑟𝑎𝑑𝑒2° + 𝛽 𝐼𝑠𝑠𝑢𝑎𝑛𝑐𝑒_𝐸𝑀𝐵𝐼 + 𝛽 𝑇𝑟𝑎𝑑𝑒_𝐸𝑀𝐵𝐼 + 𝛽 𝑀𝑎𝑡𝑢𝑟𝑖𝑡𝑦 + 𝐸 (2) During the assessment of literature we verify that information problems (Rock (1986)), conflicts between stakeholders (Ibbotson 1975)), market conditions (Rajan and Servaes (2002)) and liquidity of the offered assets (Ellul and Pagano (2006)) are the prominent causes of underpricing. Based on these studies, we propose the determinants for the baseline model.
21 The β_1 is a dummy variable that characterizes when the debenture has a rating assigned during issuance; β_2 is a dummy for coordinator leader is a big bank; β_3 dummy if the issuer is private; β_4 dummy which indicates if debenture has subsidies benefits; β_5 dummy that represents if it follows the regulation CVM476; β_6 dummy represents if it is the first issuance of the firm (debut); β_7 is a dummy variable that reflects if the debenture was issued after the year 2015; β_8 dummy which assumes one in case the debenture was issued in January; β_9 is a continuous variable which represents the total amount raised in millions of reais; β_10 is a continuous variable representing the amount negotiated during the first trade on the secondary market; β_11 is a continuous variable which means what was the basis points of the EMBI index during the moment of issuance; β_12 is a continuous variable that represents what was the basis points of the EMBI index during the first trade on the secondary market; at last, β_13 is a continuous variable representing the tenor, in days, of the debenture.
In order to understand how coefficients behave for different ranges of time between emission and first trade, we will test smaller windows (90, 120 and 180 days) using the baseline model. In the end, we propose the introduction of new variables to the baseline model, which are interactions between dummies variables and after the year 2015, in order to understand if the effects of crises can change variable coefficients and relevance after the shock.
6. Results
In this section, we will present the results obtained for this study and will try to answer the questions raised during the revision of the literature. First, we execute a t-test and ANOVA, to verify if there are signs of underpricing in Brazilian capital markets; Secondly, we run a test using the method of multivariate ordinary least square (OLS) in the baseline model, to evaluate the determinants in a multivariate analysis. Third, we compare the baseline model with different time spans for the number of days between issuing and first trade. At last, we evaluate how the dummy variables for asymmetric information behave in interaction with the variable of crisis in the market, defined before as issues made after the year of 2015.
22 a) Matrix of correlation
Starting our analysis, we look to the matrix of correlation (table 6 on the appendix) for all variables (dummies and continuous). Between the results, we should highlight the weak negative relationship with Rating Assigned and Private companies. We can understand those open companies need to keep a higher level of transparency, having rating agencies evaluating their assets and assigning ratings to their issuances. It is possible to verify a weak relation between Private companies and the First debenture issued by a company; this probably happens due the fact that close companies are less active in the capital market, issuing fewer debt instruments.
Further, we can see a moderate correlation in Subsidized Debentures and Maturity. This happens because the incentivized titles are all related to infrastructure projects that usually have longer tenors due to size and complexity. Another point of weak relationship is among Subsidized Debenture, EMBI at issuing and trade. It can be related to an increase in investor demand for less risky projects in times of crisis. We should also comment that we identify a medium to strong correlation with variable Issued After 2015 and both EMBI variables, in line with the theory that after 2015 the premium for risk in Brazil was higher due the moment of crisis.
b) Univariate Analysis
Next, we evaluate the univariate analysis, which provides us a comparison of Delta PU for each dummy variable individually and shows if this is relevant to explain it.
With Table 2, we can clarify some of the questions raised during the literature analyses, for instance it shows that the price of the first negotiation in the secondary market that happens right after the issuing of the instruments are, on average, 31,49 basis points higher than the price of the curve with a significance level of 1%. Our findings mean that considering the entire sample, which counts for approximately R$ 302,8bn ($ 73.4bn) in money raised, a total of R$ 953m ($ 231m) was left on the table by the issuers, because of underpricing.
23 Table 2 – Univariate Analysis
With these results, we can affirm with 99% confidence that Debentures issued in the Brazilian capital market present yields in the emission higher than the ones used on the secondary market. Therefore, we do have evidence to affirm that there is underpricing in Debentures issued in the Brazilian market.
The table provides the average for Delta PU for all the samples and each sub-sample divided by dummy variables. We run t-tests to check if the averages are equal to 0 and to verify the existence of a difference between the averages inside each subsample, with a significance of
5%
Average % Test T P-Value
Sample Delta PU (%) 0,3149 5,3248 0,0000 Quantity 803 100% Rating Assigned 0,1526 2,5050 0,0127 Quantity 339 42% Non-rated 0,4334 4,7204 0,0000 Quantity 464 58%
Rating Assigned x No Rating 2,3522 0,0189
Big Bank as leader underwriter 0,3231 4,8173 0,0000
Quantity 512 64%
Other financial institutions 0,3004 2,6618 0,0082
Quantity 291 36%
Big Bank x Others -0,1841 0,8540
Private Company 0,5319 5,4301 0,0000 Quantity 402 50% Public traded 0,0973 1,5717 0,1168 Quantity 401 50% Private x Public -3,704 0,0002 Subsidized Debentures 1,1143 5,0863 0,0000 Quantity 161 20% Regular Debentures 1,1143 2,464 0,0140 Quantity 642 80% Subsidized x Regular -6,9689 0,0000 Type 476 0,3849 5,2626 0,0000 Quantity 626 78% Type 400 0,0671 0,9842 0,3264 Quantity 177 22% 476 x 400 -2,8219 0,0049
First debenture issued 0,9037 4,5341 0,0000
Quantity 150 19% Seasoned offer 0,1796 3,2504 0,0012 Quantity 653 81% IPO x SBO -4,8388 0,0000 Issued After 2015 0,4999 5,3813 0,0000 Quantity 439 55% Issued Before 2015 0,0917 1,4097 0,1595 Quantity 364 45% After 2015 x Before 2015 -3,4595 0,0006 Issued in January -0,1664 -1,9479 0,0603 Quantity 33 4%
Issued in other months 0,3355 5,4593 0,0000
Quantity 770 96%
24 In the univariate analysis, we find that the difference between a debenture issued with a Big Bank as a coordinator leader or any other financial institution would not be relevant with 10% of significance. In this case, the theory proposed that Big Banks act on their own could be discarded, but since it is an extensively studied theme and might have a high explanation level for the model, we decided to keep it for the multivariate test. All other proposed variables seem to have a significant difference, confirming the studied literature and allowing us to continue the research.
c) Multivariate analysis
Subsequent, we conduce a multivariate analysis, table 3, which provides substantial evidence that underpricing is related to informational issues, economic environment, and post-offering liquidity. All the significance levels in these tests are computed using robust errors with cluster at the issuer level for heteroscedasticity. Tests are executed using fixed effect by industry, in order to control the average difference between them and unobservable predictors.
We test a total of 13 regressions, with the (12) being the baseline model (complete table available in appendix Table 7). The models between 1 to 8, work as average tests giving support to the results from the univariate test (Table 2). From these tests, we confirm that all variables have explanatory power, presented by R Squared. We can also affirm, with 90% confidence, that the Big Banks variable is not statistically significant and all other dummy variables are relevant individually.
Looking at the baseline, represented by regression (12), we start to understand how all the determinants impact price in the secondary market. After running it, we notice that more variables are not relevant with 90% of confidence, therefore a “cleaning” in the model was conducted, running several regressions removing the variable with the lowest significance level, one at a time. As a result, all variables left in the final model are significant, with 90% confidence. Nevertheless,
25 the following variables were not removed for lack of relevance: Rating Assigned, Big Bank as lead underwriter, Issued After 2015, Amount Issued, and Amount traded in the secondary market.
Table 3– Short version Multivariate Analysis
This table represents the coefficient and the standard deviation of 5 regression with Delta Pu as a dependent variable. Rating assigned is a dummy that assumes the value 1 if the debenture had a rating assigned when it was issued and 0 if it had no public rating. Big Bank as leader underwriter is a dummy variable that assumes 1 for issues that were made by big banks and 0 for all other financial institutions. Private Company is a dummy variable that assumes 1
for the debentures issued by private companies 0 for public traded firms. Subsidized Debenture is a dummy variable that assumes 1 for the debentures that are subsidized, having a fiscal incentive (Law 12.431), and 0 if it not. Type 476 is a dummy variable that assumes 1 for issues that follow the instructions of
CMV476 and 0 if it follows CVM400. First debenture issued assigned is a dummy that assumes the value 1 in case this is the first debenture ever issued by the company or 0 if it is a seasoned debenture issuing. Issued After 2015 is a dummy that assumes the value 1 if debenture was issued after the year of 2015 and 0 for previous years. Issued In January is a dummy that assumes the value 1 if debenture was issued in the month of January and 0 for other months. Issued In December is a dummy that assumes the value 1 if debenture was issued in the month of December and 0 for other months. Issued in January or December is a dummy that assumes the value 1 if debenture was issued in the months of January and December or 0 for other months. Amount issued is a control variable that represents the amount, in millions of reais, raised by the company with the debenture. Maturity is a control variable that represents the time, in number of days, until maturity. Amount traded in secondary mkt. is a control variable that represents how much, in millions of reais, was negotiated in the first day of trade in the secondary market. EMBI of issuing is a control variable that represents the market risk at the moment of issuing and the EMBI during trade in secondary brings market risk in the moment of the first trade in the secondary market. The Statistical significance is indicated by *** / ** / *
for each level 1%, 5% and 10% respectively
Baseline Final
(9) (10) (11) (12) (13)
Rating Assigned -0,0669 -0,0155 -0,0587 -0,0032
(0,1190) (0,1168) (0,1242) (0,1221)
Big Bank as leader underwriter 0,0284 0,0292 0,0317 0,0370
(0,1308) (0,1332) (0,1309) (0,1340) Private Company 0,2124* 0,2130* 0,2182* 0,2185* 0,2198* (0,1206) (0,1236) (0,1221) (0,1239) (0,1237) Subsidized Debenture 0,9051*** 0,4990* 0,8700*** 0,4787* 0,5310** (0,2451) (0,2601) (0,2574) (0,2687) (0,2530) Type CVM 476 0,3885*** 0,4372*** 0,3530** 0,4199** 0,4484*** (0,1469) (0,1654) (0,1574) (0,1683) (0,1669)
First debenture issued 0,4644*** 0,4454*** 0,4714*** 0,4465*** 0,4570***
(0,1680) (0,1604) (0,1686) (0,1606) (0,1583) Issued In January -0,4028*** -0,5531*** -0,3985*** -0,5385*** -0,5667*** (0,1482) (0,1661) (0,1531) (0,1663) (0,1670) Issued After 2015 0,1081 0,1431 (0,1547) (0,1935) Amount issued -0,0001 -0,0002 (0,0002) (0,0002) Maturity 0,0002** 0,0002** 0,0002** (0,0001) (0,0001) (0,0001)
Amount traded in secondary mkt. -0,0003 -0,0003
(0,0010) (0,0010)
EMBI of issuing 0,0048*** 0,0048*** 0,0054***
(0,0016) (0,0016) (0,0015)
EMBI during trade in secondary -0,0046*** -0,0046*** -0,0045***
(0,0014) (0,0014) (0,0014)
Cons 0,3359 -0,8611 -0,3703 -0,8611 -1,0163
26 d) Evaluating the results of the final model
This “Final” model will be the one that we will evaluate and is represented by regression (13) in table 3. Also, it is worth it to compare the R Square of the Baseline model (0,1547) and Final model (0,1528), even after removing four variables, the level of explanation from the model did not fall that much, reinforcing the idea that these are not relevant.
i. Dummy variables
In line with our expectations, with 10% significance, when a company that is Private issues a debenture, on average, it presents a positive impact of 21,98 bps in Delta PU, meaning an increase in underpricing and a monetary loss of R$ 0,2198 for each R$ 100 raised for being not public. It happens because investors require a higher return in order to compensate for the risk of a firm with less disclosure of information, pushing down prices and increasing premium. Subsequently, we can affirm with 95% confidence that if a debenture is subsided, it has a positive impact of 53,10 bps on the Delta PU, on average. This result is aligned with the literature, once specialized funds demand this type of Debentures and are obligated to invest their portfolio with it. Likewise, supply is scarce for those issues since it is not easy to qualify projects for this benefit. Funds culminate in buying these titles on the secondary market with premiums. The type CVM 476 variable also responded as expected, with 99% confidence, it is possible to affirm that, on average, an issuance made with rules for CVM 476 has a positive difference on Delta PU of 44,84 bps. An explanation is that this regulation provides a lower level of disclosure about the issuer and limits access to fewer investors during issuing when compared with CVM 400. The economic magnitude for issuing using CVM 476 would correspond to R$ 0,4848 reais that its losses for each R$ 100,00 raised; this number is relevant as depending on the size of the deal, it might be worth it to use CVM 400 rules. With the model, we can affirm, with 1% significance, that if it is the first debenture issued by a company (debut), it will have a positive impact on Delta PU of 45,70 bps, on average.
27 The literature supports this outcome, as when companies are unfamiliar to investors, they require a premium to acquire its bonds, and again asymmetric information between stakeholders tends to increase underpricing. However, in the following issuances, the company gets closer to investors that no longer require this premium. With 99% confidence, we can affirm that if a debenture is issued in January, it will reduce the difference in Delta PU in 56,75 bps, on average. This result might be related to the low supply in the month and the need for institutional investors to allocate their resources, pushing issuance prices higher and reducing interest rates for debtors.
ii. Continuous variables
Represented by the variable maturity, the table shows us, with 95% confidence, that as the tenor of the deal increases in one day, the Delta PU increases in 0,02 bps on average. This value in the determinant represents a loss, due to underpricing, of R$ 0,0002 for every extra day for each R$100 issued. What is aligned with the theory that good firms prefer to finance themselves with short term loans and face refinancing risk rather than use long term loans. Investors then tend to charge a premium for longer tenors. At first sight, opposite signs for EMBI at issuance and EMBI during the first trade in the secondary market might look wrong. However, with further thought, this could be because the buyer will use it in their favor when trying to obtain the highest yield possible. Therefore, during each phase, they will negotiate with an opposite sign: From a buyer perspective, when they are buying from the issuers, higher yields will be required (increasing underpricing), and in the first trade on the secondary market they will apply discounts because of the market risk. Summarizing, we can affirm, with 99% confidence, that market risk has an impact in underpricing. During issuance Delta PU would increase in average 0,54 bps for each unit of increase in EMBI index. In monetary terms, an increase of one point in the index in a deal of R$ 1.000.000 would represent a cost/loss of R$ 5.400; and during first trade in secondary market, the Delta PU would reduce in 0,45 bps for each unit of increase in the index, with everything else
28 constant. This means the secondary market buyer would save, on average, R$ 4.500 in a R$ 1.000.000 deal for an extra point on the index.
e) Evaluating coefficients with different time intervals between issuance and first trade in the secondary market
The next step in our analysis is to evaluate how variables behave for different time intervals between issuance and trade. First, we believed that the smaller the time range the more likely the model would have a smaller error. To test this hypothesis, we run three regressions (Table 5): First, the baseline within the period until 180 days between issuance and first trade in the secondary market; second within 120 days; third within 90 days.
As we compare each column (on Table 4), we can notice the opposite to what was first assumed, levels of explanation decrease with smaller periods of time. With 120 days, it increased, and some variables lose relevance, probably because fewer externalities are impacting the model for this period. Nevertheless, when we look at only 90 days, much information is lost. We believe this happens because the sample for this period has a high concentration of deals Type CVM 400 (175 out of 184), due to the rules of Lock-Up of CVM 476. The determinant Amount is significant, with 90% confidence, for the 90 day period. This result can be related to a low possibility for small players to acquire Debentures in the primary market; these investors turn out buying it in the secondary market with premium. The coefficient shows us that small purchases in the secondary market tend to have a higher Delta Pu, on average. For each million more bought in the first trade on the secondary market, underpricing is reduced in 0,15 bps. In addition, we find an unexpected behavior for the 90 days interval, the signs of each EMBI variable inverted compared to previous models. A possible explanation for this is an eventual need/obligation of investors in selling their assets at lower prices, in a short range of time, inverting the signs.
29 Table 4 – Time intervals for the first trade
This table has the comparison between baseline with the other subsamples, being time interval between IPO and first trade in the secondary market the difference in the samples for each subsample. Subsamples are divided into 90, 120 and 180 days between IPO and
first trade in the secondary market. The Statistical significance is indicated by *** / ** / * for each level 1%, 5% and 10% respectively.
Baseline 180 days 120 days 90 days
Sample (n° obs.) 803 533 184
Rating Assigned -0,0032 -0,0475 0,1666
(0,1221) (0,1147) (0,1684)
Big Bank as leader underwriter 0,0370 -0,1811 0,0908
(0,1340) (0,1315) (0,2125) Private Company 0,2185* 0,1628 0,1462 (0,1239) (0,1166) (0,1674) Subsidized Debenture 0,4787* 0,4454** 0,0038 (0,2687) (0,2132) (0,1446) Type 476 0,4199** 0,5465*** 0,4684 (0,1683) (0,1404) (0,3755)
First debenture issued 0,4465*** 0,1184 -0,2889
(0,1606) (0,1682) (0,1801) Issued in January -0,5385*** -0,4345* -0,0812 (0,1663) (0,2285) (0,1616) Issued After 2015 0,1431 0,0237 0,0678 (0,1935) (0,1572) (0,2059) Amount issued -0,0002 -0,0002 0,0000 (0,0002) (0,0002) (0,0003) Maturity 0,0002** 0,0002*** 0,0001 (0,0001) (0,0001) (0,0001)
Amount traded in secondary mkt. -0,0003 -0,0005 -0,0015*
(0,0010) (0,0015) (0,0009)
EMBI of issuing 0,0048*** 0,0035* -0,0073*
(0,0016) (0,0019) (0,0038)
EMBI during trade in secondary -0,0046*** -0,0032** 0,0057*
(0,0014) (0,0014) (0,0030)
Cons -0,8611 -0,5656 0,0385
R Squared 0,1547 0,1693 0,1217
At this point, we should remember the results found. First, we could affirm, with 99% confidence, that Brazil’s debt capital market has evidence of underpricing. Debentures issued there, on average, are bought in the first trade in secondary with a premium over the fair price in the curve of 31,49 bps.
We can affirm that asymmetric information impacts the prices of these asset, factors such as 476 type, maturity, if it is private, and if it’s the first issuance of a group (debut) increase underpricing premium, pushing yields higher during issuance; Other evidence found was that liquidity could influence underpricing, but this is more related to specificities of the Brazilian
30 market with Subsided titles and the January Effect promoting it; Different from what was first believed, the underwriter being a big bank is not relevant to evaluate underpricing; At last, it is possible to prove that in periods of market stress the effect of underpricing is intensified, noted by EMBI index variable.
Aligned with the theory assessed, all three key causes of underpricing (liquidity, asymmetric information, and market risk) also seem to impact it in the Brazilian market.
f) Testing interaction between variables, evaluating further underpricing in periods of economic stress
After parsing through the results, we proposed the following question: Is there evidence that during periods of crisis, coefficients of asymmetric information can reduce the difference in prices between issuance and first trade in the secondary market? Past literature indicates that underpricing can changes how it behaves after a period of crisis (Li, R.; Liu, W.; Liu, Y.; Tsai (2008)).
In order to address this matter, we propose a new model (3), which includes interactions between dummy variables and dummy after 2015 (issuances that happened after the year of 2015). The number of variables in the model is high; However, we prefer to concede statistical significance than omit variables. Find below the model:
𝐷𝑒𝑙𝑡𝑎 𝑃𝑈, = 𝛽 + 𝛽 𝐼𝑠𝑠𝑢𝑒𝑅𝑎𝑡𝑖𝑛𝑔 + 𝛽 𝐵𝑖𝑔𝐵𝑎𝑛𝑘_𝐶𝑜𝑜𝑟𝑑𝑖𝑛𝑎𝑡𝑜𝑟_𝐷𝑚𝑦 + 𝛽 𝑃𝑟𝑖𝑣𝑎𝑡𝑒_𝐶𝑜𝑚𝑝𝑎𝑛𝑦_𝐷𝑚𝑦 + 𝛽 𝑆𝑢𝑏𝑠𝑖𝑑𝑖𝑧𝑒𝑑_𝐷𝑒𝑏_𝐿𝑒𝑖12431_𝐷𝑚𝑦 + 𝛽 𝐷𝑒𝑏_476_𝐷𝑚𝑦 + 𝛽 𝐹𝑖𝑟𝑠𝑡_𝐷𝑒𝑏_𝐺𝑟𝑜𝑢𝑝_𝐷𝑚𝑦 + 𝛽 𝐴𝑓𝑡𝑒𝑟2015_𝐷𝑚𝑦 + 𝛽 𝐼𝑠𝑠𝑢𝑒𝑑_𝐼𝑛_𝐽𝑎𝑛𝑢𝑎𝑟𝑦_𝐷𝑚𝑦 + 𝛽 𝐼𝑠𝑠𝑢𝑒_𝑆𝑖𝑧𝑒 + 𝛽 𝐴𝑚𝑜𝑢𝑛𝑡𝑡𝑟𝑎𝑑𝑒2° + 𝛽 𝐼𝑠𝑠𝑢𝑒_𝐸𝑀𝐵𝐼 + 𝛽 𝑇𝑟𝑎𝑑𝑒_𝐸𝑀𝐵𝐼 + 𝛽 𝑀𝑎𝑡𝑢𝑟𝑖𝑡𝑦 + 𝛽 𝐼𝑠𝑠𝑢𝑒𝑅𝑎𝑡𝑖𝑛𝑔_𝐷𝑚𝑦 ∗ 𝐴𝑓𝑡𝑒𝑟2015 + 𝛽 𝐵𝑖𝑔𝐵𝑎𝑛𝑘_𝐶𝑜𝑜𝑟𝑑𝑖𝑛𝑎𝑡𝑜𝑟_𝐷𝑚𝑦 ∗ 𝐴𝑓𝑡𝑒𝑟2015 + 𝛽 𝑃𝑟𝑖𝑣𝑎𝑡𝑒_𝐶𝑜𝑚𝑝𝑎𝑛𝑦_𝐷𝑚𝑦 ∗ 𝐴𝑓𝑡𝑒𝑟2015 + 𝛽 𝑆𝑢𝑏𝑠𝑖𝑑𝑖𝑧𝑒𝑑_𝐷𝑒𝑏_𝐿𝑒𝑖12431_𝐷𝑚𝑦 ∗ 𝐴𝑓𝑡𝑒𝑟2015 + 𝛽 𝐷𝑒𝑏_476_𝐷𝑚𝑦 ∗ 𝐴𝑓𝑡𝑒𝑟2015 + 𝛽 𝐹𝑖𝑟𝑠𝑡_𝐷𝑒𝑏_𝐺𝑟𝑜𝑢𝑝_𝐷𝑚𝑦 ∗ 𝐴𝑓𝑡𝑒𝑟2015 + 𝛽 𝐼𝑠𝑠𝑢𝑒𝑑_𝐼𝑛_𝐽𝑎𝑛𝑢𝑎𝑟𝑦_𝐷𝑚𝑦 (3)
31 In table 5, below, we find the results of the multivariate OLS regression and verify if interactions with dummies have a significant coefficient different from 0 (β14, β15, β16, β17, β18, β19 and β20).
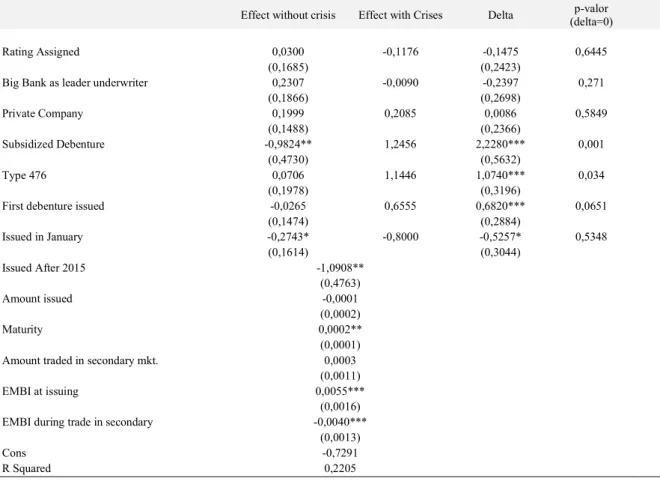
Table 5 – Interaction with the crisis period
This table present the regression of an adapted model, which contains all the baseline variables plus the interaction of the dummies for asymmetric information with variables dummy for after 2015. It presents the coefficients, standard deviations and differences of variables from before 2015 and after 2015 (Δ). The Statistical significance is indicated by *** / ** / * for each level 1%, 5% and 10% respectively. The last column presents the P-value for the test if the difference is relevant for after and before 2015 (Δ ≠ 0) in order to verify if crises is
relevant for underpricing.
Effect without crisis Effect with Crises Delta (delta=0) p-valor
Rating Assigned 0,0300 -0,1176 -0,1475 0,6445
(0,1685) (0,2423)
Big Bank as leader underwriter 0,2307 -0,0090 -0,2397 0,271
(0,1866) (0,2698) Private Company 0,1999 0,2085 0,0086 0,5849 (0,1488) (0,2366) Subsidized Debenture -0,9824** 1,2456 2,2280*** 0,001 (0,4730) (0,5632) Type 476 0,0706 1,1446 1,0740*** 0,034 (0,1978) (0,3196)
First debenture issued -0,0265 0,6555 0,6820*** 0,0651
(0,1474) (0,2884) Issued in January -0,2743* -0,8000 -0,5257* 0,5348 (0,1614) (0,3044) Issued After 2015 -1,0908** (0,4763) Amount issued -0,0001 (0,0002) Maturity 0,0002** (0,0001)
Amount traded in secondary mkt. 0,0003
(0,0011)
EMBI at issuing 0,0055***
(0,0016)
EMBI during trade in secondary -0,0040***
(0,0013)
Cons -0,7291
R Squared 0,2205
This model has a gain on explanatory power represented by R squared; this reinforces the concept that issuances done after 2015, in crisis period, are different from the ones before, and the inclusion of interactions is suitable for the model. Four interactions seem to be relevant for the model, considering a confidence level of 90%: Subsidized Debenture; Type 476; First debenture issued (debut); Issued in January. For the variables of asymmetric information (Type 476 and First
32 debenture issued), the gap increased, what represents a higher underprice in periods of crisis and sustains the theory that investors will demand higher discounts to buy liabilities that they have less information in moments of economic stress. Subsidized Debenture also has a positive gap, with 99% confidence. It can be connected with the scarcity of supply of this type during those periods. These assets are made to finance infrastructure projects that usually require long tenors and significant expenditures, which result in being less executed in periods of crises. Variable Issued in January is the only with a negative gap of 80,00 bps, with 90% confidence, so in these periods, the same result found before is enhanced.
7. Conclusion
This study empirically investigates how prices of Debentures issued in Brazil's debt capital market behave during their first trade in the secondary market. Our analyses suggest that underpricing is present in these markets. Usually, debentures sold in the primary market have yield rates higher than the one requested by the market (prices lower than the market price). We can affirm that asymmetric information influences the effect. Companies that provide less information for the market tend to present higher underpricing in their issuances; primary investors have a propensity to require better yields for lack of information. During moments of intense economic stress, the effect is intensified. Investors in primary and secondary markets require higher returns for the corresponding risk in the market. Some factors of Liquidity can impact pricing, but these are related to specificities of the Brazilian market and not to common factors as amount issued and traded in the secondary market. Underpricing happens in these situations as a result of a lack of supply and non-equal treatment for all primary investors. As we reduce the window of time between issuance and first trade, the explanation level of the variables increases, probably because fewer external factors influence it. Different from the literature studied, the lead underwriter being a big bank in Brazil is not a relevant factor in explaining underpricing.
33 8. References
AKERLOF, Ga. (1970). The market for lemons: Quality and the market mechanism, Journal Economics.
AMIHUD, Yakov; MENDELSON, Haim. (1986). Asset pricing and the bid-ask spread. Journal of Financial Economics. v.17, Issue 2, p. 223-249.
BOOTH, J. R.; CHUA, L. (1996). Ownership Dispersion, Costly Information and IPO Underpricing. Journal of Financial Economics, p.291–310.
CHANG, Eric C. J. PINEGAR, Michael. (1990). Stock Market Seasonals and Prespecified Multifactor Pricing Relations. Journal of Financial and Quantitative Analysis, v.25, Issue 4, p. 517-533.
CONARD, Joseph W.; FRANKENA Mark W. (1969). Yield Spread Between New and Seasoned Corporate Bonds, p. 1952–1963.
DRUCKER, Steven; PURI, Manju. (2007). Banks in Capital Markets. Handbook of Empirical Corporate Finance. v.1, p. 189-232.
ELESWARAPU, Venkat R; REINGANUM, Marc R. (April, 2004). The Journal of Business. v.77, No. 2, p. 275-294.
ELLUL, A.; PAGANO, M. (2006). IPO Underpricing and After-Market Liquidity. Review of Financial Studies. p.381–421.
FAMA, Eugene F. (1985). What's different about banks? Journal of Monetary Economics. v.15, Issue 1, p. 29-39.
34 FENDER, I; HAYO, B Hayo; NEUENKIRCH, M. (2012). Daily pricing of emerging market sovereign CDS before and during the global financial crisis. Journal of Banking & Finance. v.36, Issue 10, p. 2786-2794.
HICKMAN, W. Braddock. (1958). Corporate Bond Quality and Investor Experience, NBER Books, National Bureau of Economic Research, Inc, number hick58-1, Marzo.
IBBOTSON, Roger G. (1975). Price performance of common stock new issues. Journal of Financial Economics. p. 235-272.
KANATAS, George; QI, Jianping. (2003). Integration of Lending and Underwriting: Implications of Scope Economies, Journal of Finance (58), p. 1167-1191.
LI, Rui; LIU, Wei; YOUNG, Liu; TSAI, Sang-Bing. (2018) IPO Underpricing After the 2008 Financial Crisis: A Study of the Chinese Stock Markets. Sustainability, 10, 2844.
LINDVALL, J. R. (1977). New issue corporate bonds, seasoned market efficiency and yield spreads. The Journal of finance, 32(4), p. 1057-1067.
LOGUE, Dennis E. (1973). The Journal of Financial and Quantitative Analysis. v. 8, No. 1. p. 91-103.
LOUGHRAN, T.; RITTER, J. R. (2004). Why has Underpricing Changed Over Time? Financial Management. p. 35–37.
MAXWELL, William F. (1998). The January Effect in the Corporate Bond Market: A Systematic Examination. Financial Management. v.27, No. 2, p. 18-30.
NAGLER, Florian; OTTONELLO, Giorgio. (2019). Inventory Capacity and Corporate Bond Offerings. BAFFI CAREFIN Centre Research Paper No. 2017-48.
35 NIANYUN, Kelly Cai; HELWEGE, Jean; WARGA, Arthur. (2007). Underpricing in the
Corporate Bond Market. The Review of Financial Studies. p.2021–2046.
NORDEN, Lars; WEBER, Martin. (2009). The Co‐movement of Credit Default Swap, Bond and Stock Markets: an Empirical Analysis. European Financial Management, v.15, Issue 3.
RAJAN, R; SERVAES, H. (1995). The effect of market conditions on initial public offerings. London Business School and CEPR.
ROCK, K. (1986). Why New Issues are Underpriced. Journal of Financial Economics. p.187– 212.
SPENCE AM. (1974). Market signaling: Informational transfer in hiring and related screening processes, Harvard Univ Pr.
SPINDT, Paul A.; STOLZ, Richard W. (1992). Are US treasury bills underpriced in the primary market? Journal of Banking & Finance. v.16, Issue 5, p.891-908.
WEINSTEIN, M. I. (1978). The seasoning process of new corporate bond issues. The Journal of Finance, 33(5), 1343-1354.
36 9. Appendix
Graph 6 – Scattered plot representing difference between issuing price and first trade (Delta PU) -200 0 200 400 600 800 1000 0 50 100 150 200
37 6 Table – Matrix of correlation
D el ta P U R at in g A ss ig ne d B ig B an k as le ad er un de rw ri te r Pr iv at e C om pa ny Su bs id iz ed D eb en tu re T yp e 47 6 Fi rs t de be nt ur e is su ed Is su ed A ft er 20 15 Is su ed in Ja nu ar y A m ou nt is su ed M at ur it y A m ou nt tr ad ed in se co nd ar y m kt . E M B I of is su in g E M B I du ri ng tr ad e in se co nd ar y D el ta P U 1, 00 00 R at in g A ss ig ne d -0 ,0 82 8 1, 00 00 B ig B an k as le ad er un de rw ri te r 0, 00 65 0, 05 17 1, 00 00 Pr iv at e C om pa ny 0, 12 98 -0 ,2 86 0 -0 ,1 93 4 1, 00 00 Su bs id iz ed D eb en tu re 0, 23 91 -0 ,0 75 4 0, 04 11 0, 14 56 1, 00 00 T yp e 47 6 0, 07 87 -0 ,2 38 9 -0 ,1 00 9 0, 08 18 -0 ,2 13 9 1, 00 00 Fi rs t de be nt ur e is su ed 0,16 85 -0 ,1 96 2 -0 ,0 57 4 0, 28 06 0, 09 52 0, 14 69 1, 00 00 Is su ed A ft er 20 15 0, 12 13 -0 ,1 33 4 -0 ,0 25 6 -0 ,0 03 9 0, 22 48 0, 24 00 0, 00 64 1, 00 00 Is su ed I n Ja nu ar y -0 ,0 59 5 0, 07 71 0, 06 47 -0 ,0 69 3 0, 03 73 -0 ,1 47 2 -0 ,0 18 7 -0 ,0 50 9 1, 00 00 A m ou nt is su ed -0,0 48 9 0, 16 33 0, 21 49 -0 ,1 07 6 -0 ,1 09 0 -0 ,0 78 6 -0 ,0 78 7 0, 05 42 0, 05 08 1, 00 00 M at ur it y 0, 20 74 -0 ,1 09 0 0, 03 02 0, 08 94 0, 53 84 -0 ,2 31 2 0, 08 38 -0 ,0 58 3 0, 10 40 -0 ,0 15 5 1, 00 00 A m ou nt tr ad ed in se co nd ar y m kt . 0,00 37 0, 07 38 0, 10 38 0, 00 71 -0 ,0 25 2 -0 ,0 51 8 -0 ,0 00 5 -0 ,0 15 8 0, 11 63 0, 27 25 0, 09 12 1, 00 00 E M B I of is su in g 0, 12 47 -0 ,0 85 7 0, 00 50 0, 00 53 0, 25 82 0, 18 32 0, 00 19 0, 71 75 0, 02 55 -0 ,0 27 4 -0 ,0 29 9 0, 00 34 1, 00 00 E M B I du ri ng tr ad e in se co nd ar y 0, 02 61 -0 ,0 94 2 -0 ,0 34 7 0, 03 67 0, 22 49 0, 18 33 0, 01 59 0, 58 54 -0 ,0 14 9 -0 ,0 45 6 -0 ,0 40 1 -0 ,0 06 9 0, 74 21 1, 00 00
38 7 Table– Complete Multivariate Analysis