A Work Project, presented as part of the requirements for the Award of a Master’s degree in Finance from the Nova School of Business and Economics.
VALUATION OF B2B SAAS STARTUPS -
WHAT INFORMATION AND METRICS ARE VALUE RELEVANT?
NICK STODT
MASTER STUDENT NUMBER: 33953
Work project carried out under the supervision of: Assistant Professor Francisco Queiró
Abstract
The valuation of early-stage startups is critical in venture capital. This thesis examines whether metrics, investors apply to assess B2B SaaS startups, can explain the probability of receiving funding and pre-money valuation. Empirical results from 441 fundraising attempts of startups support the key hypothesis that investors consider specific metrics and value information pro-vided by startups. More specifically, this thesis shows that annual recurring revenues, number of patents granted, and technical co-founders significantly and positively affect the probability to receive funding or the valuation. In addition, information disclosed by startups about revenue and burn rate are valued by investors.
Keywords
startup valuation, venture capital, software startups, value relevance
This work used infrastructure and resources funded by Fundação para a Ciência e a Tecnologia (UID/ECO/00124/2013, UID/ECO/00124/2019 and Social Sciences DataLab, Project 22209), POR Lisboa (LISBOA-01-0145-FEDER-007722 and Social Sciences DataLab, Project 22209) and POR Norte (Social Sciences DataLab, Project 22209).
1. Introduction
How to value startups is critical for both early-stage investors and entrepreneurs. From a ven-ture capitalist’s perspective, the valuation is an effective means of aligning the interests between the entrepreneur and investor (De Clercq et al., 2006). From an entrepreneur’s perspective, securing financing through venture capital is crucial to enable rapid growth.
Startups are typically associated with high risks, high cash burn rates, and asymmetric infor-mation and thus difficult to value (Sahlman, 1990; Sievers, Mokwa and Keienburg, 2013). The applicability of commonly used valuation approaches in corporate finance (e.g. discounted cash flow method) is only possible to a limited extent due to strict assumptions and lack of infor-mation. In practice, the valuation of startups assessed by venture capitalists like Capnamic Ven-tures, an early-stage investor based in Cologne, is mainly driven by a holistic assessment based on business-model-specific metrics and relevant information provided by startups. In theory, a gap in the existing literature has been recognized by researchers. Studies of Waldron and Hub-bard (1991), Hall and Hofer (1993) and Gompers (1999) summarize the state of knowledge in startup valuation and suggest more in-depth research. This finding is confirmed by Köhn (2018) in a more recent review of the existing empirical literature regarding startup valuation.
This thesis aims to contribute to this research field by performing an empirical analysis of the impact of metrics, used by investors to assess ventures, on the valuation of business-to-business (B2B), software-as-a-service (SaaS) startups and on their probability of receiving funding. This thesis continues with a theoretical background (chapter 2) on the corporate finance theory and the influence of metrics and information on the valuation of startups. In chapter 3, hypoth-eses are developed on metrics and information which are expected to affect the startup’s valu-ation and probability of receiving funding. Chapter 4 describes the dataset and methodology. The last chapter critically concludes the findings and classifies them in the scientific and prac-tical context. In addition, limitations and suggestions for future research are provided.
2. Theoretical Background
2.1 Valuation Theory
The theory of corporate finance says that the economic value of every investment is the present value of the related future cash flows (Brealey et al., 2012). This present value of future cash flows can be divided into the present value of net assets in place, based on past investments, and the present value of future growth opportunities (Miller and Modigliani, 1961). The im-portance of the individual parts shifts during the company’s life cycle (Myers, 1977). For ex-ample, the value of young firms is mainly a function of the value of growth opportunities, whilst the value of a mature firm is largely attributable to the value of assets in place. This theoretical concept is challenging for the valuation of startups as it requires information that cannot be provided due to low or no revenues, operational losses and short history. Hence, common val-uation methods do not work for startups or yield in unrealistic results (Damodaran, 2009). Economic and strategic management literature provides relevant approaches to predict the firm’s development and value creation. The theory of industrial economics takes into account the structure of the market, in which the firm operates, to project the firm’s performance (Tirole, 1988). In contrast, the resource-based view focuses on resources and competencies available in the firm (Wernerfelt, 1984). This theoretical framework implies that information about the firm’s resources and market opportunities enable the prediction of firm’s performance. This concept provides the basis on which venture capitalists and entrepreneurs negotiate the valua-tion. In this context, the high information asymmetry between entrepreneurs and investors must be considered (Petersen and Rajan, 1995). According to signal theory, startups focus primarily on consciously communicate positive information in order to convey a positive impression.
2.2 Empirical Evidence of Determinants on Startup Valuation
This section presents the most relevant findings and methods used in related studies that provide empirical evidence of determinants for the valuation of startups. Hand (2005) examines the value relevance of financial information for a sample of 204 biotech ventures from the US. The researcher observes that financial statements have a high value relevance for startups financed by venture capital and that their value relevance increases as the firm matures, while the value relevance of non-financial information decreases (Hand, 2005). Armstrong, Davila and Foster (2006) extend the research of Hand (2005) and investigate the relationship between private equity market valuations and financial statement information for a sample of 502 US companies across various industries. Using rank regression analyses, the study shows that costs (e.g. cost of sales, sales, marketing, etc.) incurred by early-stage companies are value enhancing. From a venture capitalists’ perspective costs are considered to be value-enhancing investments to gen-erate future cash flows (Armstrong, Davila and Foster, 2006). Sievers, Mokwa and Keienburg (2013) analyse documents from over 200 investment rounds and 127 companies to examine the relevance of financial (balance sheet and income statement items) and non-financial infor-mation (e.g. team experience or number of patents) for the valuation of startups in venture cap-ital. The study states that both financial and non-financial information are equally meaningful to the pre-money valuation of startups (Sievers, Mokwa and Keienburg, 2013). Based on the strategic management approach in order to predict the value of startups, Miloud, Aspelund and Cabrol (2012) find that the quality of the founders have a positive and significant impact. Fo-cusing on the internal resources of startups, Hsu (2007) examines the influence of entrepreneur-ial experience and human capital of startups on their valuation showing that previous entrepre-neurial experience increases the valuation of the respective startups. Consequently, this thesis aims to contribute to the literature of value relevance of financial and non-financial information for startups and to apply recent findings to a sample of B2B SaaS startups.
3. Hypotheses Development
In this chapter hypotheses are developed on how financial and non-financial information are expected to affect the probability of receiving funding and the valuation of startups. The results of related studies are provided for each determinant and put into the context of fundraising and valuation of B2B SaaS startups by considering best practices of leading venture capitalists.
3.1 Assets in Place 3.1.1 Technology Asset
Intellectual property is important for early-stage investors as it can further reduce asymmetric information (Block et al., 2014; Greenberg, 2013). Armstrong, Davila and Foster (2006) show that the number of patent applications filed and granted is positively related (p < 0.05) to the pre-money valuation of startups. Greenberg (2013) analyses 317 Israeli startups and finds that patent applications are significantly and positively related to firms’ valuations across various industries, while they are not relevant to software startup valuations. In this thesis, a positive correlation between the number of patents granted and the valuation of startups is expected, as it signals validation of past investments and increases the defensibility of technology.
H1a: An increased number of patents granted affects positively the probability of receiving funding.
H1b: An increased number of patents granted has a positive impact on the pre-money valuation.
3.1.2 Human Asset
3.1.2.1 Prior founding experience
From a theoretical point of view, previous entrepreneurial experience seems to be crucial for the performance of a startup, as entrepreneurship is linked to a trial-and-error process. In this way, the knowledge that is essential to build successful startups could be gained from previous entrepreneurial experiences (Brüderl, Preisendörfer and Ziegler, 1992). Hsu (2007) finds that
entrepreneurs experienced in setting up a startup achieve higher valuations (p < 0.05) for their businesses and are more likely to receive venture capital funding (p < 0.01) based on a sample of 149 early-stage technology startups. Wasserman (2017) is in line with these observations and shows the relationship between entrepreneurial experiences and higher valuations (p < 0.05). In contrast, the study by Gompers et al. (2010) shows that successful serial entrepreneurs do not achieve higher valuations for their businesses. To summarize, a certain amount of entre-preneurial experience seems to have a positive impact on the performance of startups.
H2a: Prior entrepreneurial experience affects positively the probability of receiving funding. H2b: Prior entrepreneurial experience has a positive impact on the pre-money valuation.
3.1.2.2 Technical Expertise
In software startups, the technical expertise of the founding team is a decisive success factor, especially in the early stages of product development. In this way, highly qualified teams can convincingly signal the quality of the business, as they have attractive opportunities (Bernstein, Korteweg and Laws, 2017). The researchers show that investors are eager to receive infor-mation about the team (p < 0.05). A survey among 60 venture capitalists conducted by Point Nine (2018), a Berlin-based venture capital fund, shows that the highest rating is assigned to a strong technical co-founder considering early-stage investments. The result shows that venture capitalists are willing to take a high degree of market risk but want to minimize technological risk. Thus, early-stage investors seem to value technical capabilities in software startups. H3a: A technical co-founder affects positively the probability of receiving funding. H3b: A technical co-founder has a positive impact on the pre-money valuation.
3.2 Information Asymmetry
High information asymmetry limits access to traditional financing sources (e.g. bank loans), which is the case for most startups (Petersen and Rajan, 1995). In the context of venture capital, investors usually have incomplete and imperfect information about the startups compared to
entrepreneurs. The signaling theory states that the informed party (e.g. entrepreneurs) provides observable information to the less informed party (e.g. investors) and discloses information about unobservable information to enhance communication (Spence, 1978). In the fundraising process, the pitch deck of a startup is an important document to disclose information. Since startups can decide what information they want to communicate, they are more likely to reveal only positive information in pitch decks. When investment negotiations take place, investors have access to sensitive information as part of the due diligence process. Investors are expected to penalize startups with a lower valuation if relevant metrics are not disclosed in advance. H4a: Undisclosed information affect negatively the probability of receiving funding. H4b: Undisclosed information have a negative impact on the pre-money valuation.
3.3 Financial Information 3.3.1 Revenue
Several related studies reveal a positive correlation between the revenue of a startup and the valuation assigned by early-stage investors. Davila and Foster (2005) observe a positive and significant correlation (p < 0.05) between the change in revenues and change in valuation of startups in the US. Armstrong, Davila and Foster (2006) support this finding and show that there is a positive and significant correlation (p < 0.01) between the level of revenue and level of private equity value in pre-IPO periods. In addition, Sievers, Mokwa and Keienburg (2013) validate for a sample of German startups that revenues are value relevant. The empirical study shows that revenues have a positive and significant impact (p < 0.01) on the valuation.
Venture capitalists, namely Andreessen Horowitz (2015) and Insight Partners (2018) argue that annual recurring revenue (ARR) is a key metric to assess SaaS startups. As higher revenues are related to higher valuations, it is expected to find similar results for B2B SaaS startups.
H5a: Increased ARR affects positively the probability of receiving funding. H5b: Increased ARR has a positive impact on the pre-money valuation.
3.3.2 Burn Rate
Armstrong, Davila and Foster (2006) examine the relationship between financial statement in-formation and private equity market valuations of venture capital backed companies in the US. The researchers find that higher costs, namely sales, marketing, general, and administrative expenses (p < 0.05) and research and development expenses (p < 0.01) lead to higher valuations. This result indicates that venture capitalists consider costs as value-enhancing investments (Armstrong, Davila and Foster, 2006). Sievers, Mokwa and Keienburg (2013) show for a sam-ple of German venture-capital backed startups that research and development expenses have a positive impact (p < 0.10), but selling, general, and administrative expenses have a negative effect (p < 0.05) on the valuation, contrary to the result of Armstrong, Davila and Foster (2006). Early-stage startups do not monitor and report the cost components separately, but in an aggre-gated metric (burn rate). The burn rate, calculated by subtracting operating expenses from rev-enues, shows how much money startups burn (Andreessen Horowitz, 2015; Insight Partners, 2018). As the burn rate includes all costs incurred, a value-enhancing effect is expected. H6a: Increased absolute value of burn rate affects positively the probability of receiving fund-ing.
4. Empirical Analysis
4.1 Dataset and Methodology
In this section, the dataset and applied methodology are illustrated to examine the formulated hypotheses. In the following, the data collection process is outlined, the variables are defined, the dataset is described statistically, and the applied econometric model is explained.
4.1.1 Data Collection
In order to create a dataset of startups with information about financials, metrics, funding rounds, technology assets and human capital, various data sources are used. Financials and specific metrics are the most sensitive data. Thus, Capnamic Ventures’ deal flow tool provides the initial dataset. As Capnamic Ventures is an early-stage investor with a strong focus on B2B SaaS startups, only this kind of startups is considered due to potential selection biases. In order to retrieve the corresponding pitch decks, the following filters are applied. Business is selected as startups’ customer type. In addition, only startups with a subscription-based revenue model are chosen. In a next step, only startups with a SaaS business model are considered. These filters ensure that only B2B SaaS startups are retrieved from the deal flow tool. In total, 679 startups meet these requirements and represent the database as of September 2019.
Relevant data about funding rounds are retrieved from crunchbase.com and pitchbook.com. Since in several cases it is not possible to match the startups with these databases, 238 are excluded. After combining the dataset based on Capnamic Ventures’ deal flow tool and fund-raising data, information on human capital and technology assets are gathered. Prior entrepre-neurial information of founders are collected from LinkedIn profiles. In addition, information about patents are retrieved from espacenet.com1. Finally, the dataset contains information about 441 fundraising attempts based on data of 416 unique B2B SaaS startups.
1 Database offered by the European Patent Office containing data of more than 110 million patent documents globally
4.1.2 Definition of Variables
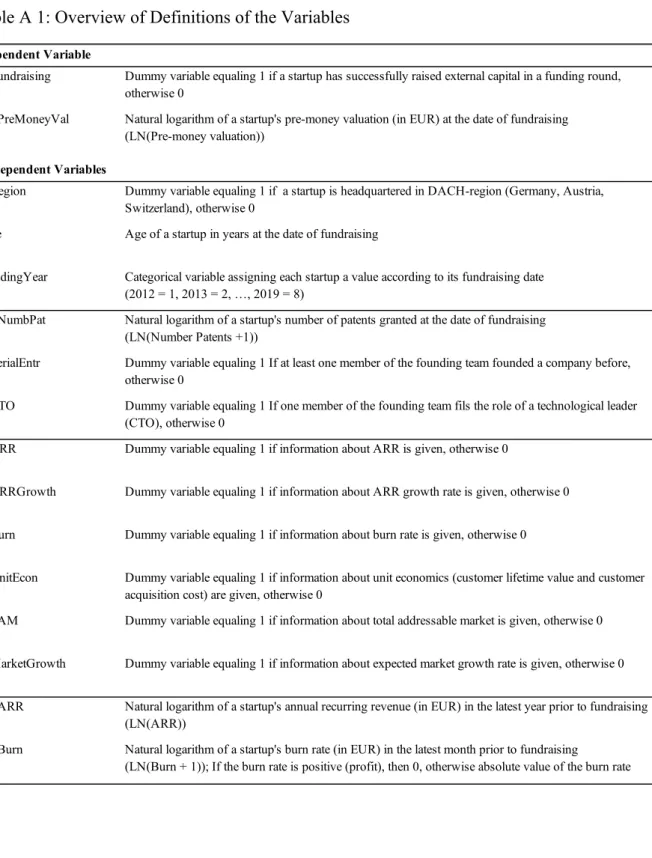
In this section, the dependent and independent variables are defined. Venture capital portfo-lios follow a power law curve, meaning that only a small percentage of venture capitalists’ in-vestments yield the majority of the returns. In order to account for this characteristic, a loga-rithmic transformation is applied to continuous variables. An overview of the summarized definitions of all variables is illustrated in Table A 1 in the appendix.
4.1.2.1 Dependent Variable
This thesis examines the impact of metrics, used by investors to assess startups, on the valuation of B2B SaaS startups and on the probability of receiving funding. From an investor’s perspec-tive, the valuation defines the number of shares for an investment. From an entrepreneur’s point of view, receiving funding ensures liquidity and enables rapid growth.
The dependent variable DFundraising is calculated as a binary variable. The value 0 is set if a startup could not successfully raise external funding and 1 if the startup received external fund-ing. In order to calculate the dependent variable LNPreMoneyVal, the pre-money valuation of the successful funding round is assigned to the startup. In a last step, a logarithmic transfor-mation LN(Pre-money valuation) is applied to reduce the skewed distribution of the dataset.
4.1.2.2 Independent Variables Team & Technology
The human capital variables relate to the founding date of the startup. Thus, entrepreneurial experience gained from operating the startup is not considered. With regards to the technology assets variable, the number of patents granted is related to the fundraising date of the startup. The group of human capital variables contains specific characteristics of the founding team. The dummy variable DSerialEntr is included to examine the impact of prior entrepreneurial experience on the dependent variables. This dummy variable equals 1 if at least one member of the founding team has co-founded a startup before, otherwise 0. In addition, the dummy variable
DCTO indicates whether one member of the founding team fills the role of a technology leader.
Only co-founders with job descriptions containing the words “CTO”, “VP Engineering”, or equivalent are considered. The third variable is related to existing technology assets.
LNNumbPat captures the number of patents granted. These data are highly skewed and thus
require a logarithmic transformation. Since many startups do not have any patents granted in early stages, the natural logarithm LN(number of patents + 1) is applied.
Information Asymmetry
In order to examine the effect of information asymmetry, six dummy variables are introduced, having the value 1 if information are disclosed and 0 if not. The variable DARR shows, if any information about ARR are given. DARRGrowth is related to any indications about the ARR growth rate. DBurn captures any information about the burn rate of the startup. The variable
DUnitEcon considers the disclosure of data about customer lifetime value and customer
acqui-sition costs, showing the attractiveness of the business model. DTAM and DMarketGrowth are related to information about the total addressable market and the market growth, respectively.
Financial Indicators
The variable LNARR is based on the ARR of the latest year in EUR prior to the funding round. In order to account for the high skewness in the data, a logarithmic transformation is carried out by calculating the natural logarithm LN(ARR). The second financial indicator LNBurn is the monthly burn rate in EUR at the time of the funding round. The burn rate is calculated by subtracting operating expenses from revenues. Typically, early-stage startups suffer from low revenues and high expenses, thus reporting a negative value for the burn rate. In order to ac-count for these characteristics, the value 0 was set if the burn rate is positive. In a second step, the absolute value of the burn rate enables a logarithmic transformation in order to reduce the skewed distribution. For this purpose, the natural logarithm LN(Burn rate + 1) is used.
Control Variables
The study of Houlihan Valuation Advisors and VentureOne (1998) examines the influence of startup characteristics on the pre-money valuation and finds that the location of a startup is significantly correlated with the valuation. This dataset is potentially biased towards the Ger-man-speaking countries as Capnamic Ventures is based in Cologne and has a strong focus on startups operating in the DACH-region (Germany, Austria and Switzerland). Thus, the dummy control variable DRegion is added to account for potential differences between startups based in the DACH-region and those headquartered in non-German speaking countries. In addition, the control variable Age is included and defined as the years of existence of the startup at fund-raising. The reason is that older startups tend to have competitive advantages due to a broader set of resources, valuable experience and established relationships (Finkle, 1998). In order to control for potential time effects, the variable FundingYear is included. For each startup a value on a scale from 1 for 2012 to 8 for 2019 is assigned according to the year of fundraising.
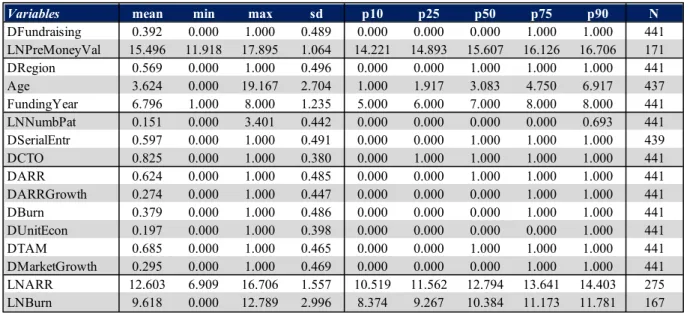
4.1.3 Descriptive Statistics of the Dataset
The characteristics of the dataset are summarized and statistically described. Table 1 shows the summary statistics of the dependent variables, control variables and independent variables. In this dataset, the mean of DFundraising is 0.39, referring to the distribution of 268 failed and 173 successful external financing rounds. Thus, 39.2% of the observed fundraising attempts were successful. The pre-money valuations of the startups range from a minimum of EUR 0.15m2 to a maximum of EUR 59.12m3 with a median of EUR 6.00m4. In contrast, US based software companies in early-stages had a median valuation of USD 25.00m in 2018, indicating the advanced nature of the venture capital market in the US (Pitchbook Data, Inc., 2019).
2 The value of EUR 0.15m is calculated by 𝑒"".$"%
3 The value of EUR 59.12m is calculated by 𝑒"&.%$'
With respect to the general characteristics of the startups, 56.9% of the fundraising startups are located in the DACH-region which is mainly due to the fact that Capnamic has a strong network in German speaking countries. Considering the variable Age, the 10th percentile shows that in at least 10% of the fundraising attempts, the startups were not more than one year old, whereas the 90th percentile indicates that at least 10% were 6.92 or more years old. The median of the
FundingYear implies that at least 50% of the fundraising attempts in this sample took place in
2018 (coded as year 7) or 2019 (coded as year 8), showing the increased attractiveness of this business model for venture capitalists in recent years.
Considering technology asset, the 75th percentile of LNNumbPat implies that in at least 75% of the fundraising attempts, the startups do not have any patents granted. According to human capital, 59.7% of the founding teams consist of at least one serial entrepreneur, whereas 82.5% have a technical co-founder. The rows 10 to 15 in the Table 1 statistically describe the distri-bution of information disclosed in the pitch decks of the startups. Overall, in 62.4% of the pitch decks the ARR is reported, while in only 27.4% information about the ARR growth rate is communicated. Considering the financial situation and profitability, 37.9% of the pitch decks contain numbers about the burn rate and 19.7% about the unit economics (customer acquisition costs and customer lifetime value). Information about the market size are disclosed in 68.5% of the pitch decks, whereas only 29.5% have information about the respective market growth rate included.
The ARR range from a minimum of EUR 1.00k5 to a maximum of EUR 18.00m6 with a median of EUR 360.05k7, based on 275 pitch decks. While the maximum burn rate is EUR 358.25k8, the minimum natural logarithm value of 0 shows that at least one startup had a positive EBITDA.
5 The value of EUR 1.00k is calculated by 𝑒(.$)$
6 The value of EUR 18.00m is calculated by 𝑒"(.&)(
7 The value of EUR 360.05k is calculated by 𝑒"*.&$+
Table 1: Descriptive Statistics of Variables
sd = standard deviation, p10 = 10th percentile, p25 = 25th percentile, p50 = 50th percentile/median, p75 = 75th per-centile, p90 = 90th percentile, N = number of observations
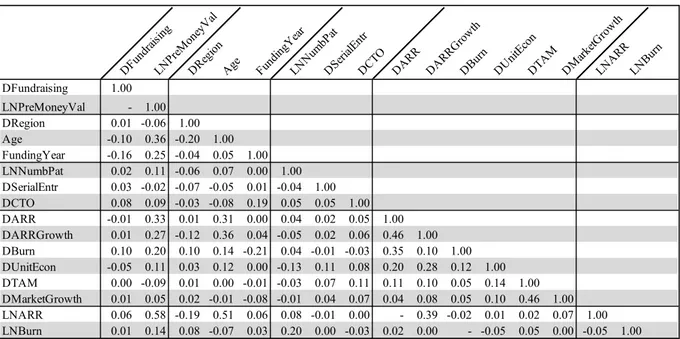
As presented in the Table A 2 in the appendix, the variable LNARR is highly and positively correlated with Age, implying that older startups are more likely to have a higher ARR. This is in line with the typical life cycle of firms, showing increased revenues from early-stage to ma-turity. In addition, the missing values indicate the derivation of the dummy information varia-bles from the financial variavaria-bles. In order to account for this multicollinearity, the regression is conducted in separate specifications.
4.1.4 Econometric Model
The derived hypotheses are empirically tested based on the previously described variables and the dataset. Two linear regression models are conducted in order to assess which metrics and information affect the dependent variables LNPreMoneyVal and DFundraising individually.
𝐷𝐹𝑢𝑛𝑑𝑟𝑎𝑖𝑠𝑖𝑛𝑔6 = 𝛽) + 𝛽"𝑋"6+ ⋯ + 𝛽<𝑋<6+ 𝜀6 𝐿𝑁𝑃𝑟𝑒𝑀𝑜𝑛𝑒𝑦𝑉𝑎𝑙6 = 𝛽)+ 𝛽"𝑋"6+ ⋯ + 𝛽<𝑋<6 + 𝜀6
𝐷𝐹𝑢𝑛𝑑𝑟𝑎𝑖𝑠𝑖𝑛𝑔6= 𝑖FG 𝑜𝑏𝑠𝑒𝑟𝑣𝑎𝑡𝑖𝑜𝑛 𝑜𝑓 𝑡ℎ𝑒 𝑑𝑒𝑝𝑒𝑛𝑑𝑒𝑛𝑡 𝑣𝑎𝑟𝑖𝑎𝑏𝑙𝑒 𝐷𝐹𝑢𝑛𝑑𝑟𝑎𝑖𝑠𝑖𝑛𝑔 (𝑖 = 1, … , 441)
𝐿𝑁𝑃𝑟𝑒𝑀𝑜𝑛𝑒𝑦𝑉𝑎𝑙6= 𝑖FG 𝑜𝑏𝑠𝑒𝑟𝑣𝑎𝑡𝑖𝑜𝑛 𝑜𝑓 𝑡ℎ𝑒 𝑑𝑒𝑝𝑒𝑛𝑑𝑒𝑛𝑡 𝑣𝑎𝑟𝑖𝑎𝑏𝑙𝑒 𝐿𝑁𝑃𝑟𝑒𝑀𝑜𝑛𝑒𝑦𝑉𝑎𝑙 (𝑖 = 1, … , 171)
𝛽)= 𝑖𝑛𝑡𝑒𝑟𝑐𝑒𝑝𝑡/𝑐𝑜𝑛𝑠𝑡𝑎𝑛𝑡
Variables mean min max sd p10 p25 p50 p75 p90 N
DFundraising 0.392 0.000 1.000 0.489 0.000 0.000 0.000 1.000 1.000 441 LNPreMoneyVal 15.496 11.918 17.895 1.064 14.221 14.893 15.607 16.126 16.706 171 DRegion 0.569 0.000 1.000 0.496 0.000 0.000 1.000 1.000 1.000 441 Age 3.624 0.000 19.167 2.704 1.000 1.917 3.083 4.750 6.917 437 FundingYear 6.796 1.000 8.000 1.235 5.000 6.000 7.000 8.000 8.000 441 LNNumbPat 0.151 0.000 3.401 0.442 0.000 0.000 0.000 0.000 0.693 441 DSerialEntr 0.597 0.000 1.000 0.491 0.000 0.000 1.000 1.000 1.000 439 DCTO 0.825 0.000 1.000 0.380 0.000 1.000 1.000 1.000 1.000 441 DARR 0.624 0.000 1.000 0.485 0.000 0.000 1.000 1.000 1.000 441 DARRGrowth 0.274 0.000 1.000 0.447 0.000 0.000 0.000 1.000 1.000 441 DBurn 0.379 0.000 1.000 0.486 0.000 0.000 0.000 1.000 1.000 441 DUnitEcon 0.197 0.000 1.000 0.398 0.000 0.000 0.000 0.000 1.000 441 DTAM 0.685 0.000 1.000 0.465 0.000 0.000 1.000 1.000 1.000 441 DMarketGrowth 0.295 0.000 1.000 0.469 0.000 0.000 0.000 1.000 1.000 441 LNARR 12.603 6.909 16.706 1.557 10.519 11.562 12.794 13.641 14.403 275 LNBurn 9.618 0.000 12.789 2.996 8.374 9.267 10.384 11.173 11.781 167
𝛽" / 𝛽<= 𝑐𝑜𝑒𝑓𝑓𝑖𝑐𝑖𝑒𝑛𝑡 𝑜𝑓 𝑡ℎ𝑒 1XF / 𝑘FG 𝑖𝑛𝑑𝑒𝑝𝑒𝑛𝑑𝑒𝑛𝑡 𝑣𝑎𝑟𝑖𝑎𝑏𝑙𝑒
𝑋"6 / 𝑋<6= 𝑖FG 𝑜𝑏𝑠𝑒𝑟𝑣𝑎𝑡𝑖𝑜𝑛 𝑜𝑓 𝑡ℎ𝑒 1XF / 𝑘FG 𝑖𝑛𝑑𝑒𝑝𝑒𝑛𝑑𝑒𝑛𝑡 𝑣𝑎𝑟𝑖𝑎𝑏𝑙𝑒
𝜀6= 𝑒𝑟𝑟𝑜𝑟 𝑡𝑒𝑟𝑚 𝑓𝑜𝑟 𝑡ℎ𝑒 𝑖FG 𝑜𝑏𝑠𝑒𝑟𝑣𝑎𝑡𝑖𝑜𝑛
𝑘 = 𝑛𝑢𝑚𝑏𝑒𝑟 𝑜𝑓 𝑖𝑛𝑑𝑒𝑝𝑒𝑛𝑑𝑒𝑛𝑡 𝑣𝑎𝑟𝑖𝑎𝑏𝑙𝑒𝑠 (𝑖𝑛𝑐𝑙𝑢𝑑𝑖𝑛𝑔 𝑐𝑜𝑛𝑡𝑟𝑜𝑙 𝑣𝑎𝑟𝑖𝑎𝑏𝑙𝑒𝑠)
In order to account for the nature of the binary dependent variable DFundraising and thus to verify the results of the respective linear regression, a logit regression model is applied. Based on the variance inflation factor (VIF) values in the various regressions (see Table A 3 in appen-dix), multicollinearity is not affecting these regressions as the values are below the acceptable maximum value of 10 (Freund, Wilson and Sa, 2006). As heteroskedasticity cannot be excluded in these models, robust standard errors are applied.
Furthermore, the formulated hypotheses are tested in a hierarchical regression approach. In a first step, the control variables are included. In a second step, the variables LNNumbPat,
DSe-rialEntr and DCTO, representing the human capital and technology assets, are introduced to
the model. The different variable sets of the startups’ financial and market information are sep-arately added to the model, resulting in two different specifications for each of the two depend-ent variables. In the first specification (A) the variables, capturing the effect of the disclosure of information about financials and market data, namely DARR, DARRGrowth, DBurn,
DUn-itEcon, DTAM, DMarketGrowth are entered. The second specification (B) considers the sample
of startups, which provide data about ARR and burn rate, in order to assess the impact on the probability of fundraising and the pre-money valuation. Thus, the variables LNARR and
4.2 Empirical Results
The results of the hierarchical multiple linear regressions with the dependent variables
DFund-raising and LNPreMoneyVal including the two different specifications are summarized in Table
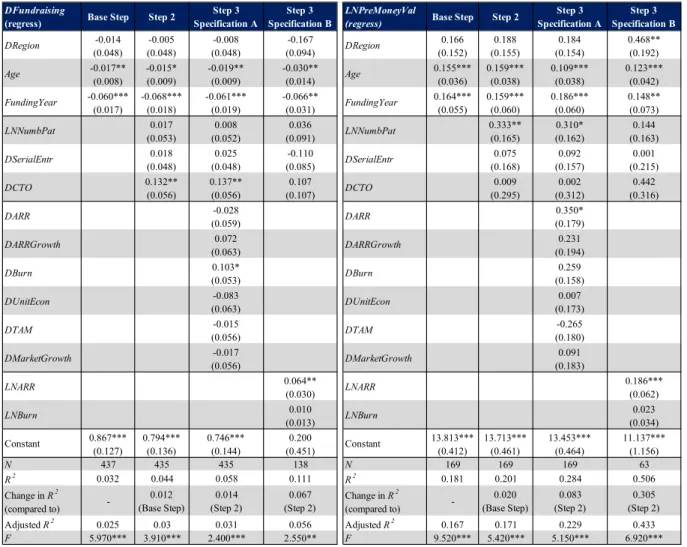
2. Table A 4 in the appendix shows the results of the logit regressions in form of the average marginal effects for the binary dependent variable DFundraising.
Considering the Base Steps in Table 2, which exclusively consider control variables, both mod-els show a low statistical significance with a 𝑅* of 0.032 at p < 0.01 (F = 5.970) and an adjusted
𝑅* of 0.025 for DFundraising-Model and a 𝑅* of 0.181 and an adjusted 𝑅* of 0.167 at p < 0.01
(F = 9.520) for LNPreMoneyVal-Model. These 𝑅* values imply that control variables explain
3.2% of the variation in DFundraising and 18.1% of the variation in LNPreMoneyVal.
B2B SaaS startups based in DACH-region seem to be less likely to receive funding but achieve higher pre-money valuations compared to those headquartered outside this region. The coeffi-cients of DRegion are negative in all regressions of DFundraising-Model (hierarchical regres-sions and in both specifications), but the coefficients are positive in all regresregres-sions of
LNPreMoneyVal-Model. Considering the statistical significance of the control variables, the
coefficients of DRegion do not show statistical significance in both models, except the Speci-fication B in LNPreMoneyVal-Model. The control variable Age indicates a negative relation-ship between startup’s age at date of fundraising and the probability to receive funding, whereas it positively impacts pre-money valuation. In DFundraising-Model, the coefficients of Age are negative in all steps and significant at the 5% and 10% level. With regards to LNPreMoneyVal-Model, the coefficients are positive in all steps and statistically significant at the 1% level. The year of fundraising, captured in control variable FundingYear, affects the dependent variable
DFundraising negatively, but dependent variable LNPreMoneyVal positively. The coefficients
are statistically significant in all steps of both models at the 1% and 5% significance level, with respective positive (LNPreMoneyVal-Model) and negative (DFundraising-Model) signs.
Table 2: Linear Regression Models
This table shows the coefficient estimates from the linear regressions. Robust standard errors are in parentheses. Statistical significance on the 1% (5%, 10%) level is denoted by *** (**, *) (two-tailed t-test). See Section 4.1.2 or Table A 1 in the appendix for the definition of the variables.
Introducing human capital and technology asset variables to both models in Step 2, namely
LNNumbPat, DSerialEntr and DCTO, 𝑅* rises by 0.012 to 0.044 at p < 0.01 (F = 3.910) for
DFundraising-Model and 𝑅* rises by 0.020 to 0.201 at p < 0.01 (F = 5.420) for
LNPreMoney-Val-Model. Considering variable LNNumbPat, coefficients are positive in both models and all
steps, but merely statistically significant at the 5% and 10% level in LNPreMoneyVal-Model in Step 2 and Specification A, indicating a positive effect on pre-money valuation of B2B SaaS startups. However, the coefficients do not keep their significance level throughout all steps and specifications in LNPreMoneyVal-Model. Thus, hypothesis H1a, assuming a positive relation-ship between number of patents and probability of receiving funding, cannot be confirmed. But
DFundraising
(regress) Base Step Step 2
Step 3 Specification A
Step 3 Specification B
LNPreMoneyVal
(regress) Base Step Step 2
Step 3 Specification A Step 3 Specification B DRegion -0.014 (0.048) -0.005 (0.048) -0.008 (0.048) -0.167 (0.094) DRegion 0.166 (0.152) 0.188 (0.155) 0.184 (0.154) 0.468** (0.192) Age -0.017** (0.008) -0.015* (0.009) -0.019** (0.009) -0.030** (0.014) Age 0.155*** (0.036) 0.159*** (0.038) 0.109*** (0.038) 0.123*** (0.042) FundingYear -0.060*** (0.017) -0.068*** (0.018) -0.061*** (0.019) -0.066** (0.031) FundingYear 0.164*** (0.055) 0.159*** (0.060) 0.186*** (0.060) 0.148** (0.073) LNNumbPat 0.017 (0.053) 0.008 (0.052) 0.036 (0.091) LNNumbPat 0.333** (0.165) 0.310* (0.162) 0.144 (0.163) DSerialEntr 0.018 (0.048) 0.025 (0.048) -0.110 (0.085) DSerialEntr 0.075 (0.168) 0.092 (0.157) 0.001 (0.215) DCTO 0.132** (0.056) 0.137** (0.056) 0.107 (0.107) DCTO 0.009 (0.295) 0.002 (0.312) 0.442 (0.316) DARR -0.028 (0.059) DARR 0.350* (0.179) DARRGrowth 0.072 (0.063) DARRGrowth 0.231 (0.194) DBurn 0.103* (0.053) DBurn 0.259 (0.158) DUnitEcon -0.083 (0.063) DUnitEcon 0.007 (0.173) DTAM -0.015 (0.056) DTAM -0.265 (0.180) DMarketGrowth -0.017 (0.056) DMarketGrowth 0.091 (0.183) LNARR 0.064** (0.030) LNARR 0.186*** (0.062) LNBurn 0.010 (0.013) LNBurn 0.023 (0.034) Constant 0.867*** (0.127) 0.794*** (0.136) 0.746*** (0.144) 0.200 (0.451) Constant 13.813*** (0.412) 13.713*** (0.461) 13.453*** (0.464) 11.137*** (1.156) N 437 435 435 138 N 169 169 169 63 R2 0.032 0.044 0.058 0.111 R2 0.181 0.201 0.284 0.506 Change in R2 (compared to) -0.012 (Base Step) 0.014 (Step 2) 0.067 (Step 2) Change in R2 (compared to) -0.020 (Base Step) 0.083 (Step 2) 0.305 (Step 2) Adjusted R2 0.025 0.03 0.031 0.056 Adjusted R2 0.167 0.171 0.229 0.433 F 5.970*** 3.910*** 2.400*** 2.550** F 9.520*** 5.420*** 5.150*** 6.920***
hypothesis H1b, implying that the number of patents granted positively impacts pre-money valuation of B2B SaaS startups, can cautiously be supported. The coefficient of LNNumbPat, for instance in Step 2 of the LNPreMoneyVal-Model, indicates that a 10% increase in number of patents increases the pre-money valuation by 3.2%9 on average, holding all other variables constant. The coefficients of variable DSerialEntr are positive in both models, except Specifi-cation B in DFundraising-Model. However, as the coefficients appear to be insignificant, hy-potheses H2a and H2b cannot be verified. Hence, no systematic effect of founders’ prior entre-preneurial experience on the probability of fundraising or the pre-money valuation is found, considering this sample of B2B SaaS startups. Regarding the variable DCTO, the coefficients are found to be positive in both models and all steps, but only statistically significant at the 5% significance level in Step 2 and Specification A of the DFundraising-Model. Hence, hypothesis H3a can cautiously be supported, implying that a technical co-founder tends to positively im-pact the probability of fundraising of B2B SaaS startups. This result is in line with industry practice of leading early-stage investors (Point Nine, 2018). Furthermore, these findings are consistent with the results from the logit regression. According to Step 2 of DFundraising-Model, a technical co-founder increases the probability of B2B SaaS startups to receive funding by 13.2 percentage points on average, holding all other variables constant.
Adding the information dummy variables to the Base Steps yields Specification A. The intro-duction of these variables increases 𝑅* by 0.014 to 0.058, while the adjusted 𝑅* rises to 0.031
at p < 0.01 (F = 2.400) for DFundraising-Model and increases 𝑅* by 0.083 to 0.284 with an
adjusted 𝑅* of 0.229 at p < 0.01 (F = 5.150) for LNPreMoneyVal-Model. Regarding the
coef-ficients, only DBurn shows statistical significance at the 10% level in DFundraising-Model, whereas DARR shows statistical significance at the 10% level in LNPreMoneyVal-Model. Thus, partial support is provided for hypotheses H4a and H4b, indicating that undisclosed financial
information about burn rate and ARR have a negative impact on the probability of fundraising and the valuation of B2B SaaS startups, respectively. These findings are consistent with those from the logit regression. The coefficient of DBurn in Specification A in DFundraising-Model indicates that B2B SaaS startups disclosing information about the burn rate have on average a 10.3 percentage points higher probability of receiving funding, holding all other variables con-stant. Considering the coefficient of DARR in Specification A in LNPreMoneyVal-Model, B2B SaaS startups disclosing information about ARR have on average a 41.9%10 higher pre-money valuation, holding all other variables constant.
Adding variable LNARR and LNBurn to the regressions in Specification B increases the 𝑅* by
0.067 to 0.111 with an adjusted 𝑅* of 0.056 at p < 0.05 (F = 2.550) for DFundraising-Model
and increases the 𝑅* by 0.305 to 0.506 with an adjusted 𝑅* of 0.433 at p < 0.01 (F = 6.920) for
LNPreMoneyVal-Model. The coefficients of LNARR are found to be positive and significant at
the 1% and 5% level in both models, respectively. These findings confirm the hypotheses H5a and H5b, indicating that increased ARR positively affect the probability of receiving funding and the pre-money valuation of B2B SaaS startups. Furthermore, these findings are consistent with the results from the logit regression. According to Specification B in DFundraising-Model, an ARR increase of 10% increases the probability of receiving funding by 0.6%11 on average, holding all other variables constant. Considering the LNPreMoneyVal-Model, the co-efficient of LNARR implies that a 10% increase in ARR increases the pre-money valuation by 1.8%12 on average, holding all other variables constant. The coefficients of the variable LNBurn are positive in both models, but they appear to be insignificant. Hence, the hypotheses H6a and H6b cannot be confirmed. In consequence, no systematic effect of the burn rate on the proba-bility of fundraising or pre-money valuation is found for B2B SaaS startups.
10 The percentage value of 41.9% is calculated by 𝑒).\') − 1
11 The percentage value of 0.6% is calculated by 0.064 𝑥 ln (1.1) 12 The percentage value of 1.8% is calculated by 𝑒)."%( ] ^_ (".")− 1
5. Discussion
5.1 Classification of Results
As outlined in chapter 2.2, related studies examine the effect of financial and non-financial information on the pre-money valuation. Most of the studies are based on samples of U.S. startups across varies industries, whereas the majority of venture capitalists are focused on spe-cific industries or business models across various countries. Thus, this study contributes to prior research as it examines the impact of information and metrics on the probability of receiving funding and the pre-money valuation of startups with a B2B SaaS model. Hence, metrics, ven-ture capitalists like Capnamic Venven-tures apply in order to assess software startups, are validated. The results presented in section 4.2 show statistically significant determinants for the probabil-ity of B2B SaaS startups to receive funding. Namely, the variables DCTO, DBurn and LNARR appear to positively and significantly impact DFundraising. In addition, the variables
LNNumbPat, DARR and LNARR appear to positively and significantly impact LNPreMoney-Val. Considering both models, DSerialEntr, DARRGrowth, DUnitEcon, DTAM, DMarket-Growth and LNBurn show no statistical significance. Whereas the observed effects of LNARR
correspond to the formulated hypotheses, further findings must be considered separately. The variable LNNumbPat cautiously confirms the hypothesis, that the number of patents granted has a positive impact on the pre-money valuation of B2B SaaS startups. Thus, support-ing the research by Armstrong, Davila and Foster (2006). Patents signal validation of past in-vestments and thus increase the defensibility of a startup’s technology. Concerning fundraising, the number of patents does not show a statistically significant impact on the probability of re-ceiving funding of B2B SaaS startups. Thus, venture capitalists do not seem to consider patents granted as a necessary requirement for early-stage B2B SaaS startups. With regards to variable
DSerialEntr, prior entrepreneur experience does not show a statistically significant impact on
record of serial entrepreneurs should be considered in more detail as the study by Gompers et al. (2010) presents. Variable DCTO confirms the hypothesis, that technical co-founders have a positive impact on probability of fundraising. Thus, it indicates that filling key positions by the founding team is a distinct advantage for early-stage software startups in the fundraising pro-cess, but not value-enhancing to investors.
Considering the dummy variables of information disclosed in pitch decks, early-stage investors seem to value information about current traction (DARR) and investment rate (DBurn), but do not care too much about the profitability of the business model (DUnitEcon) as well as market data (DTAM and DMarketGrowth). A possible explanation could be that venture capitalists do not rely on startups’ ability to calculate the profitability of their business and to size the market correctly. Thus, these information are considered to be the least verifiable in pitch decks. In contrast to the result of Armstrong, Davila and Foster (2006), the burn rate is not considered to be value-enhancing for B2B SaaS startups in this sample. As the study of Armstrong, Davila and Foster (2006) is based on a sample of U.S. startups, cultural differences could potentially explain the deviating observations. Thus, venture capitalists in Europe seem to value capital efficiency more than the investment character of high burn rates. This idea is partially supported by Sievers, Mokwa and Keienburg (2013), who show for German startups a positive impact of research and development expenses and a negative impact of selling, general and administrative expenses on the valuation.
5.2 Limitations
While this thesis provides insights about the determinants of the probability of fundraising and the pre-money valuation of B2B SaaS startups, there are some constraints that need to be con-sidered. One potential restriction is that information about revenues and burn rates are based on pitch decks and thus not validated by 3rd parties. Information derived from pitch decks are
unregulated and have a “sales” character meaning that all facts stated can be biased towards the goal of the startup. In consequence, this dataset could be skewed due to information asymmetry. Secondly, data about the founding team from LinkedIn could be a limitation. Information on LinkedIn are self-reported and thus these data could be overstated, incomplete or false. In addition, this dataset shows gaps for some variables as not every variable is observable for every startup. Thus, the number of observations in the different regression model varies from 63 to 437, which lies in the range of related studies. Nevertheless, a larger sample size could increase the representativeness of the sample and the significance of the results.
Lastly, this thesis is based on B2B SaaS startups that approached a German venture capitalist. Hence, the results cannot be generalized across industries, business models and geographies.
5.3 Future Research
Due to limited access to information about startups and in particular validated data, various aspects could not be covered in this thesis. Thus, an extension of this study could provide ad-ditional insights for both venture capitalists and entrepreneurs.
In order to address the problem of partly not validated financials, the dataset could be enlarged with data from other venture capitalist to ensure a large and verified dataset of startups, which successfully raised capital from external investors. This approach could not only increase the accuracy of the data, but also the representativeness of the study. As this thesis suggests, early stage investors have a strong focus on information about the current financials, traction, the founding team and the technology in order to derive to the pre-money valuation. Thus, future research could include more specific metrics, e.g. investment expenditures, total revenue in the sales pipeline, churn- and retention rates, team composition, etc. Sending surveys to other B2B SaaS early-stage investors would be one approach to address this challenge, but a low response rate due to the sensitivity of these information has to be critically considered.
Similar to previously mentioned issues, information about the founding team and in particular the technical leader could be obtained by sending questionnaires to founders in order to retrieve accurate and enhanced data on prior educational, entrepreneurial and professional experiences.
6. Conclusion
This thesis examines, which metrics and information, venture capitalists apply to assess B2B SaaS startups, have an impact on the probability of receiving funding and the pre-money valu-ation. Thus, it contributes to the literature of value relevance of financial and non-financial information for startups. Relevant findings are often based on studies observing U.S. startups across various industries. This work examines the relevance of these results for a sample of 441 fundraising attempts of B2B SaaS startups that approached a German venture capitalist. By having access to pitch decks not publicly available, sensitive metrics and information are eval-uated.
Based on the empirical study of 441 fundraising attempts from 416 B2B SaaS startups, various metrics and information are found to significantly impact the fundraising probability and valu-ation. Considering the assets in place, venture capitalists value patents and a technical co-founder. Both metrics give an indication of the defensibility of the technology, which is crucial for venture capitalists assessing B2B SaaS startups. Overall, early-stage investors penalize startups for not disclosing information in their pitch decks about the traction and financial sit-uation, captured by revenue and burn rate. The results indicate that the ARR is value relevant for early-stage startups, showing a first validation of the business model to investors.
All in all, this thesis serves as a guideline to venture capitalists and entrepreneurs, indicating which metrics and information are value relevant for early-stage B2B SaaS startups.
References
Andreessen Horowitz. 2015. “16 Startup Metrics.” Accessed September 2019. https://a16z.com/2015/08/21/16-metrics/
Armstrong, Chris, Antonio Davila, and George Foster. 2006. "Venture-backed private equity valuation and financial statement information." Review of Accounting Studies 11 (1): 119-154. Bernstein, Shai, Arthur Korteweg, and Kevin Laws. 2017. "Attracting early‐stage investors: Evidence from a randomized field experiment." Journal of Finance 72 (2): 509-538.
Block, Joern H., Geertjan De Vries, Jan H. Schumann and Philipp Sandner. 2014. "Trademarks and venture capital valuation." Journal of Business Venturing 29 (4): 525-542.
Brealey, Richard A., Stewart C. Myers, Franklin Allen and Pitabas Mohanty. 2012. Principles of corporate finance. New York: Tata McGraw-Hill Education.
Brüderl, Josef, Peter Preisendörfer, and Rolf Ziegler. 1992. "Survival chances of newly founded business organizations." American Sociological Review: 227-242.
Damodaran, Aswath. 2009. “Valuing young, start-up and growth companies: estimation issues and valuation challenges.”
Davila, Antonio, and George Foster. 2005. "Management accounting systems adoption deci-sions: evidence and performance implications from early-stage/startup companies." Account-ing Review 80 (4): 1039-1068.
De Clercq, Dirk, Vance H. Fried, Oskari Lehtonen and Harry J. Sapienza. 2006. "An entrepre-neur's guide to the venture capital galaxy." Academy of Management Perspectives 20 (3): 90-112.
Finkle, Todd A. 1998. "The relationship between boards of directors and initial public offerings in the biotechnology industry." Entrepreneurship Theory and Practice 22 (3): 5-29.
Freund, Rudolf. J., William J. Wilson and Ping Sa. 2006. Regression Analysis: Statistical Mod-eling of a Response Variable. Amsterdam: Academic Press.
Gompers, Paul A. 1999. “A note on valuation in entrepreneurial ventures.” Harvard Business School Background Note 298-082: 1-17.
Gompers, Paul A., Anna Kovner, Josh Lerner and David S. Scharfstein. 2010. "Performance persistence in entrepreneurship." Journal of Financial Economics 96 (1): 18-32.
Greenberg, Gili. 2013. "Small firms, big patents? Estimating patent value using data on Israeli start‐ups’ financing rounds." European Management Review 10 (4): 183-196.
Hall, John, and Charles W. Hofer. 1993. "Venture capitalists' decision criteria in new venture evaluation." Journal of Business Venturing 8 (1): 25-42.
Hand, John RM. 2005. "The value relevance of financial statements in the venture capital mar-ket." Accounting Review 80 (2): 613-648.
Houlihan Valuation Advisors and VentureOne Study. 1998. "The pricing of successful venture capital backed high tech and life sciences companies.” Journal of Business Venturing 13 (5): 333-351.
Hsu, David H. 2007. "Experienced entrepreneurial founders, organizational capital, and venture capital funding." Research Policy 36 (5): 722-741.
Insight Partners. 2018. “The 10 Most Important SaaS Metrics for High-growth SaaS Compa-nies.” Accessed September 2019. https://www.insightpartners.com/blog/the-10-most-im-portant-saas-metrics-for-high-growth-saas-companies/
Köhn, Andreas. 2018. "The determinants of startup valuation in the venture capital context: a systematic review and avenues for future research." Management Review Quarterly 68 (1): 3-36.
Miller, Merton H., and Franco Modigliani. 1961. "Dividend policy, growth, and the valuation of shares." Journal of Business 34 (4): 411-433.
Myers, Stewart C. (1977). “Determinants of corporate borrowing.” Journal of Financial Eco-nomics 5 (2): 147-175.
Miloud, Tarek, Arild Aspelund, and Mathieu Cabrol. 2012. "Startup valuation by venture cap-italists: an empirical study." Venture Capital 14 (2-3): 151-174.
Petersen, Mitchell A., and Raghuram G. Rajan. 1995. "The effect of credit market competition on lending relationships." Quarterly Journal of Economics 110 (2): 407-443.
PitchBook Data, Inc. 2019. “VC Valuations – 1H 2019.” Retrieved from Pitchbook database https://pitchbook.com/
Point Nine. 2018. “What does it take to raise capital, in SaaS, in 2018?” Accessed September 2019. https://medium.com/point-nine-news/what-does-it-take-to-raise-capital-in-saas-in-2018-204d0a46cb23
Sahlman, William A. 1990. "The structure and governance of venture-capital organizations." Journal of Financial Economics 27 (2): 473-521.
Sievers, Soenke, Christopher F. Mokwa, and Georg Keienburg. 2013. "The relevance of finan-cial versus non-finanfinan-cial information for the valuation of venture capital-backed firms." Euro-pean Accounting Review 22 (3): 467-511.
Spence, Michael. 1978. "Job market signaling." Uncertainty in economics. Academic Press: 281-306.
Tirole, Jean. 1988. The theory of industrial organization. Cambridge and London: MIT press. Waldron, Darryl, and Carl M. Hubbard. 1991. "Valuation methods and estimates in relationship to investing versus consulting." Entrepreneurship Theory and Practice 16 (1): 43-52.
Wasserman, Noam. 2017 "The throne vs. the kingdom: Founder control and value creation in startups." Strategic Management Journal 38 (2): 255-277.
Wernerfelt, Birger. 1984. "A resource‐based view of the firm." Strategic Management Journal 5 (2): 171-180.
Appendix
Table A 1: Overview of Definitions of the Variables
Dependent Variable
DFundraising Dummy variable equaling 1 if a startup has successfully raised external capital in a funding round, otherwise 0
LNPreMoneyVal Natural logarithm of a startup's pre-money valuation (in EUR) at the date of fundraising (LN(Pre-money valuation))
Independent Variables
DRegion Dummy variable equaling 1 if a startup is headquartered in DACH-region (Germany, Austria, Switzerland), otherwise 0
Age Age of a startup in years at the date of fundraising
FundingYear Categorical variable assigning each startup a value according to its fundraising date (2012 = 1, 2013 = 2, …, 2019 = 8)
LNNumbPat Natural logarithm of a startup's number of patents granted at the date of fundraising (LN(Number Patents +1))
DSerialEntr Dummy variable equaling 1 If at least one member of the founding team founded a company before, otherwise 0
DCTO Dummy variable equaling 1 If one member of the founding team fils the role of a technological leader (CTO), otherwise 0
DARR Dummy variable equaling 1 if information about ARR is given, otherwise 0
DARRGrowth Dummy variable equaling 1 if information about ARR growth rate is given, otherwise 0 DBurn Dummy variable equaling 1 if information about burn rate is given, otherwise 0
DUnitEcon Dummy variable equaling 1 if information about unit economics (customer lifetime value and customer acquisition cost) are given, otherwise 0
DTAM Dummy variable equaling 1 if information about total addressable market is given, otherwise 0 DMarketGrowth Dummy variable equaling 1 if information about expected market growth rate is given, otherwise 0 LNARR Natural logarithm of a startup's annual recurring revenue (in EUR) in the latest year prior to fundraising
(LN(ARR))
LNBurn Natural logarithm of a startup's burn rate (in EUR) in the latest month prior to fundraising (LN(Burn + 1)); If the burn rate is positive (profit), then 0, otherwise absolute value of the burn rate
Table A 2: Correlation Matrix of the Variables DFundr aising LNPr eMone yVal DRegi on Age Fundi ngY ear LNNum bPat DSeri alEntr DCT O DARR DARR Grow th DBur n DUnit Econ DTAM DM arke tGrow th LNAR R LNBur n DFundraising 1.00 LNPreMoneyVal - 1.00 DRegion 0.01 -0.06 1.00 Age -0.10 0.36 -0.20 1.00 FundingYear -0.16 0.25 -0.04 0.05 1.00 LNNumbPat 0.02 0.11 -0.06 0.07 0.00 1.00 DSerialEntr 0.03 -0.02 -0.07 -0.05 0.01 -0.04 1.00 DCTO 0.08 0.09 -0.03 -0.08 0.19 0.05 0.05 1.00 DARR -0.01 0.33 0.01 0.31 0.00 0.04 0.02 0.05 1.00 DARRGrowth 0.01 0.27 -0.12 0.36 0.04 -0.05 0.02 0.06 0.46 1.00 DBurn 0.10 0.20 0.10 0.14 -0.21 0.04 -0.01 -0.03 0.35 0.10 1.00 DUnitEcon -0.05 0.11 0.03 0.12 0.00 -0.13 0.11 0.08 0.20 0.28 0.12 1.00 DTAM 0.00 -0.09 0.01 0.00 -0.01 -0.03 0.07 0.11 0.11 0.10 0.05 0.14 1.00 DMarketGrowth 0.01 0.05 0.02 -0.01 -0.08 -0.01 0.04 0.07 0.04 0.08 0.05 0.10 0.46 1.00 LNARR 0.06 0.58 -0.19 0.51 0.06 0.08 -0.01 0.00 - 0.39 -0.02 0.01 0.02 0.07 1.00 LNBurn 0.01 0.14 0.08 -0.07 0.03 0.20 0.00 -0.03 0.02 0.00 - -0.05 0.05 0.00 -0.05 1.00
Table A 3: The Variance Inflation Factor Values for the Linear Regression Models
DFundraising
Variable VIF 1/VIF VIF 1/VIF VIF 1/VIF
DRegion 1.05 0.952 1.08 0.926 1.13 0.885 Age 1.06 0.943 1.27 0.787 1.64 0.610 FundingYear 1.04 0.962 1.09 0.917 1.08 0.926 LNNumbPat 1.01 0.990 1.04 0.962 1.10 0.909 DSerialEntr 1.01 0.990 1.03 0.971 1.04 0.962 DCTO 1.05 0.952 1.08 0.926 1.10 0.909 DARR 1.49 0.671 DARRGrowth 1.46 0.685 DBurn 1.22 0.820 DUnitEcon 1.15 0.870 DTAM 1.31 0.763 DMarketGrowth 1.28 0.781 LNARR 1.51 0.662 LNBurn 1.08 0.926 Mean VIF 1.04 1.21 1.21 LNPreMoneyVal
Variable VIF 1/VIF VIF 1/VIF VIF 1/VIF
DRegion 1.10 0.909 1.16 0.862 1.21 0.826 Age 1.12 0.893 1.37 0.730 1.89 0.529 FundingYear 1.19 0.840 1.25 0.800 1.34 0.746 LNNumbPat 1.01 0.990 1.07 0.935 1.08 0.926 DSerialEntr 1.05 0.952 1.10 0.909 1.09 0.917 DCTO 1.19 0.840 1.28 0.781 1.28 0.781 DARR 1.60 0.625 DARRGrowth 1.53 0.654 DBurn 1.31 0.763 DUnitEcon 1.15 0.870 DTAM 1.34 0.746 DMarketGrowth 1.35 0.741 LNARR 1.72 0.581 LNBurn 1.17 0.855 Mean VIF 1.11 1.29 1.35
Step 2 Specification A Specification B
Table A 4: Logit Regression Model
This table shows the average marginal effects of the logit regressions. Robust standard errors (estimated by the delta method) are in parentheses. Statistical significance on the 1% (5%, 10%) level is denoted by *** (**, *). See Section 4.1.2 or Table A 1 in the appendix for the definition of the variables.