PORTUGUESE JOURNAL OF MANAGEMENT STUDIES, VOL. XI/, N. Q 1, 2007
W
School of Economics and ManagementTECHNICAl UNIVERSITY OF LISBON G
THE COST OF EQUITY OF PORTUGUESE PUBLIC FIRMS:
A DOWNSIDE RISK APPROACH
Ricardo Pereira
Abstract
University of Cambridge (PhD student) ramgp2@cam.ac.uk
The most important asset pricing models consider that an investor's utility function is completely defined by mean and variance, which requires the normality of the stock's return distribution (or that stock returns are not skewed). However, not all stocks or markets have normal returns (e.g.: emerging markets and small public firms). The higher-order moments of stock return distributions (such as skewness and kurtosis) are valued by investors and need to be incorporated in the asset pricing models. In this article we analyse the normality and symmetry of a sample of Portuguese stocks and estimate their cost of equity (or the investors' required return on equity) using several measures of downside risk.
JEL:Gl2,G31
Keywords: Asymmetric Returns; Cost of Equity; Downside Risk Models.
1.
INTRODUCTION
Under the standard discounted cash flows framework, the value of an asset (an investment project or a firm) is estimated by discounting to the present its future free cash flows using an appropriate discount rate. Traditional litera-ture (see Brealey and Myers (2002)) defines the discount rate or the investor's opportunity cost as a weighted average of the cost of debt and the cost of equity. The cost of equity depends on the risk of the assets where the funds are applied and on the equity holder's portfolio of assets.
The equity holder's portfolio of assets defines his exposure to the different types of risk. The asset pricing model used to estimate the cost of equity (or shareholders required return) must consider these aspects and the investor's
PORTUGUESE JOURNAL OF MANAGEMENT STUDIES, VOL. XI/, N. g 1, 2007
utility function. The most important (and controversial) asset pricing model is the Sharpe-Lintner Capital Asset Pricing Model (CAPM). In CAPM, an investor's utility function is completely defined by the mean and variance of portfolio returns. This is consistent with the Von Neumann-Morgenstern quadratic util-ity functions, and the application of this mean-variance equilibrium framework requires the normality of the stock return distribution. However, not all stocks have normal returns. For example, Peir6 (1999) and Aparicio and Estrada (2001) reject the normality of daily stock returns of European securities mar-kets. The higher-order moments of a stock's return distributions (such as skew-ness and kurtosis) are important and valued by investors, meaning that they must be integrated in the asset pricing models.
Besides this, the CAPM assumes that all investors are diversified and, thus, systematic risk (the beta) is the only measure of risk that is valuable. Once again, this is not always true. Some investors like entrepreneurs or the stockholders of internet firms, who invest a substantial proportion of their wealth in their businesses, are not able to create a diversified portfolio and they are therefore exposed to both non-diversifiable and diversifiable risk. Within total risk there is downside risk and upside risk. Investors prefer upside risk and avoid downside risk. Stocks with positive skewness have more upside risk, and as Arditti (1975) argues, investors are willing to pay a premium for this skewness.
The main purpose of this article is to estimate the cost of equity of a sample of public Portuguese firms, using the downside risk models. This goal is achieved by the discussion and application of some asset pricing models that incorporate the effect of skewness on valuation. Since these models imply asymmetric returns, we begin by analysing the normality of stocks' return dis-tributions, concluding that they are not normal. However, non-normality does not necessarily imply asymmetry of returns. So, we test the asymmetry of stocks' returns, concluding that skewness is significant. Given this, we apply the asset pricing models in the estimation of the cost of equity. Total risk is significantly related to stock mean returns, even more than systematic risk measures, which means that diversifiable risk is priced. On the other hand, the explanatory power of systematic skewness measures and systematic risk measures are very similar, which means that market index return distribution is symmetric. We also conclude that equity holders of sample companies are risk-loving and not risk averse.
Finally, we underline that the choice of the right risk measure to estimate the cost of equity is a function of an investor's risk exposure and of the returns distribution features of owned asset(s).
Section 2 provides an overview of downside risk models. Section 3 de-scribes the data and methodology applied in this study. Section 4 reports the
PORTUGUESE JOURNAL OF MANAGEMENT STUDIES, VOL. XI/, N. 2 1, 2007
results and the empirical evidence, and finally section 5 presents the main conclusions.
2. OVERVIEW OF DOWNSIDE-RISK MODELS
Traditional literature considers that investors have a mean-variance be-havior (which is consistent with the expected utility maximization) meaning either one of two conditions: (i) that an investor's utility function is quadratic; or (ii) that returns are normally distributed. Markowitz (1952) developed his theory assuming that for some utility functions, the mean-variance approxima-tion is so good that there is virtually no room for improvement, and this is confirmed by Tsiang (1972), Levy and Markowitz (1979), Markowitz (1991) and Estrada (2004). Nevertheless, Kraus and Litzenberger (1976) conclude that investors have an aversion to variance and have a preference (and price) for positive (systematic) skewness. The authors question the validity of qua-dratic utility functions and reinforce the evidence that most investors have concave utility functions, displaying decreasing absolute risk aversion. An in-vestor with a quadratic utility function displays increasing absolute risk aver-sion, meaning that he tends to invest less in risky assets as his wealth in-creases, which does not seem to be a very plausible assumption. Brennan (1979) also discusses this aspect and shows that if the market index rate of return has constant mean and volatility, the average investor has a power utility function.
Furthermore, the normality of returns is questioned by many empirical studies (e.g.: Peir61 (1999), Machado-Santos and Fernandes (2005), Aparicio and Estrada (2001)), mainly with data from emerging markets. Estrada (2004) argues that the standard deviation is an appropriate measure of risk only when the underlying distribution of returns is symmetric and normal, otherwise it must be adapted. The author proposes semi-standard deviation as a measure of risk when the asset's distribution of returns is skewed and shows that mean-semi standard deviation behavior is an approximately-correct criterion to maxi-mize the expected utility function.
In our opinion, when the market indexes or stocks have skewed return distributions, we cannot use mean-standard deviation models. Moreover, Markowitz (1952) had already verified this reality and argued that semi-vari-ance seems more plausible than varisemi-vari-ance as a measure of risk. A growing
1 Peir6 (1999) refers to several authors that propose different statistical distributions for price changes of
financial assets. All of these distributions reflect high kurtosis in the empirical distribution of returns (more peaked and with fatter tails than the normal distribution).
PORTUGUESE JOURNAL OF MANAGEMENT STUDIES, VOL. XI/, N.Q 1, 2007
number of academics and practitioners are claiming that standard deviation and beta are not relevant measures of risk for many investment situations because they do not capture "what is at stake", principally, for low capitaliza-tion markets or stocks (e.g.: Sortino and VanderMeer (1991 ), Harlow (1991), Marmer and Louis (1993), Harvey (1995), Leland (1999), Nawrocki (1999)), and that is why in the last decade several authors developed models that capture the skewness in financial returns. Godfrey and Espinosa (1996) rec-ommend two adjustments to CAPM, when used to estimate cost of equity for investments in emerging markets: add a spread to the risk free rate; and use an adjusted beta (it is defined as 60% of the ratio between an emerging market's standard deviation and the standard deviation of returns in U.S. market). Of course, these adjustments do not seem very linear and possible in all markets. Erb, Harvey and Viskanta (1995, 1996) propose a model to estimate the cost of equity in emerging markets based on a country's credit ratings because they verify that these measures are significantly related to stock returns. In our opinion, this procedure does not seem relevant to corporate finance, since credit risk is not the major source of risk for stockholders. Damodaran (2001) develops a framework to estimate the beta of a company based on its funda-mental variables. This framework could be applied to private firms as well as to emerging markets. Although academics consider the issue of skewness more relevant in emerging markets, Harvey and Siddique (2000) show that system-atic skewness explains some of the cross-sectional variation of expected re-turns and is economically important in the U.S. stock market. A further analy-sis of downside risk models within the context of funds performance evalua-tion is in Machado-Santos (1998).
We present some of the models that capture the skewness in financial returns, and we employ them in the estimation of the cost of equity of Portu-guese firms. The first two models capture the downside risk of the stocks (they should be used by an investor who holds an undiversified portfolio) while the last two models capture the systematic component of skewness (they should be used by an investor who holds a diversified portfolio when assets returns are skewed). We use these models because, in our opinion, from those avail-able (e.g.: Hogan and Warren (197 4), Harlow and Rao (1989)), they are the most complete inside the scope of this work. We do not use VAR models because their main concern is near catastrophe events.
2.1. Lower Partial Moment
Lower Partial Moment (LPM) was developed by Bawa (1975) and Fishburn (1977), and it encompasses a significant number of the known Von
PORTUGUESE JOURNAL OF MANAGEMENT STUDIES, VOL. XII, N. 0 1, 2007
Morgenstern utility functions. It allows the use of all risk aversion coefficients. Given an investor risk aversion value,
a,
the LPM is defined as:I K
LPM(a,t)= K
T~ax.[O,(t-
RT)]a
(1)where t is the target return (which can be zero, the mean return or any other
threshold considered relevant by the investor), K is the number of observations
and
Rr
is the return for the asset during time periodT, T =1, ... , K.
Whena
=
1, the investor is neutral toward risk. The investor is risk-averse if a > 1 and risk-loving ifa
< 1. Obviously, the critical parameter of this measure is theparameter a. The LPM values are largely dependent on the degree of skewness
in the distribution returns. LPM values are greater when the skewness in the asset return distributions is negative for a risk-averse investor, and are lower for a risk-loving investor. In our opinion, this is the most perfect measure of risk because, like stochastic dominance, it does not make any distributional as-sumptions and assumes a very general set of utility functions.
2.2. Semi-Standard Deviation
Semi-Standard deviation (SSD) is computed as
For all RT
<
s
(2)
where sis the set value (defined as tin equation 1). When
s
= t and a = 2 thesquare root of LPM becomes SSD. Several authors, like Harlow (1991), Sortino and Forsey (1996), Estrada (2000) and Plantinga and Groot (2001), focus on SSD as a measure of downside risk and use it in asset allocation, performance measurement or estimation of the cost of equity.
2.3.
Leland's BetaLeland (1999) argues that lognormal distribution is more satisfactory as a description of asset returns than the normal since it has zero probability of negative values and positive skewness. The author says that the average in-vestor must have a power utility function (this utility implies skewness prefer-. ence) and he develops his work based on the equilibrium equation presented
PORTUGUESE JOURNAL OF MANAGEMENT STUDIES, VOL. X/1, N. 0 1, 2007
Po= E{(l + Rr)Po} -A.p {(1 + Rr)Po, -(1 + RMrb}cr:(I+R,,Jrol (3)
l+Rr
where, P0 is the price of an asset; RfJ' RM are the portfolio p and market portfolio M returns, respectively, over a time period; p {x, y} is the correlation coefficient between
x and
y;
E(.) is the expectation operator; anda
is theA.=cr(,+R"r"/E{(l+RMrb} standard deviation. Since this equation must also
hold for the market portfolio, dividing both sides of equation (3) by
P
0 and rearranging terms, we getE(RP)=rr +BP{E(RM)-rr}. (4)
The term
BP
is the modified beta, resulting from:(5)
Rubinstein (1976) shows that b can be defined as:
b
=
ln {E (1+
RM)} -ln (1+
rr)2
0' ln(l+RM)
(6)
and is therefore related to the market excess return when market returns fol-low a lognormal distribution. If we compare the traditional beta ({3) equation with the
BP
equation, we find that the risk measures are related to each other. It is interesting to note that the information necessary to computeBP
is basi-cally the same used to compute {3.2.4. Downside CAPM
Estrada (2002) proposes the Downside CAPM (D-CAPM). This is an al-ternative pricing model for diversified investors, which is based on an alterna-tive measure of risk for diversified investors, the downside beta, [3d. The
prin-ciple behind D-CAPM is the same as for CAPM2 but the measure of systematic
risk, {3, is changed to incorporate skewness. The [3d is defined as:
2 Investors' demand for a rate of return that equals the risk free rate plus a risk premium proportional to assets
systematic risk. 12
PORTUGUESE JOURNAL OF MANAGEMENT STUDIES, VOL. XI/, N. g 1, 2007
E {Min[(R. -~-t.l],O].Min[(RM -~AM), OJ}
~d= I I
E {Min[(~ -~-tM),O]Z}
(7)
where
R
and f.1 represent returns and mean returns, respectively. The Downside beta is a measure of systematic downside risk, thus it is the measure of risk to a diversified investor, who owns assets with asymmetric returns distribution.3.
DATA AND METHODOLOGY
The data used in this study consist of daily returns (where the returns are computed by natural logarithm differences), adjusted for dividends and stock splits, from the Portuguese Stock Index PSI 20 and a sample of stocks traded on this market. PSI 20 is used as the market proxy and we choose a total of 31 stocks, which include those in the PSI 20. Summary statistics of the data about these stocks and PSI 20 are provided in Table 1. Returns used through-out the article are daily returns, ranging from the first transaction day until August 2000.
To apply downside risk models, we need to prove: first, the stocks' return distributions are non-normal and therefore it is not correct to use mean-vari-ance models; second, the stocks' return distributions are skewed.
Table 1 reports the results of statistical normality tests (Studentized Range and the Jarque-Bera statistics3). The kurtosis, skewness, Studentized Range
and Jarque-Bera statistics indicate, for almost all stocks, a clear rejection of the normality of daily returns4
• Aparicio and Estrada (2001) conclude the same
for European securities markets. Only for PT Multimedia is the Jarque-Bera statistic not statistically significant at a 90% level.
Nevertheless, the presence of asymmetry is not yet clearly proven be-cause the rejection of normality does not imply the rejection of symmetry. Thus, it seems important to verify whether there is asymmetry around the mean. As a preliminary analysis, we divided each stock sample period in two sub-periods with equal number of observations5. The results suggest that
skew-ness is not time-varying, since the skewskew-ness does not change significantly from one period to the other, while other descriptive statistics, such as kurtosis
3 The Jarque-Bera statistic asymptotically follows a x2 distribution with two degrees of freedom.
' We also employ BestFit to perform a further robustness check of the previous results under other assump-tions. We conclude that, at a 5% confidence level, the normal distribution is clearly rejected relatively to the whole sample. The Kolmogorov-Smirnov and Anderson-Darling ranking tests position most and all of the stocks and the market index in the alternative logistic distribution (which allows for some asymmetry and therefore the downside risk models used). The results are available upon request.
...
,l::o. TABLE 1
Summary Statistics (daily euro returns)
No. Mean Return t-stat. Mean Return Standard Kurtosis Skewness SK stand. error Studentized Jarque-Bera Start (daily) (year) Deviation range Statistic v -value
BANfF I 899 0.0000 0.0824 0.9% 31.0% 8.561 0.292 0.0562 14.12
..
2474...
0.0000 Jan-93 BCP I 578 0.0005 1.335 I 12.6% 23.6% I 1.721 -0.402 0.0617 15.59..
5043.
..
0.0000 Apr-94 BES I 899 0.0004 1.2492 10.6% 23.5% 19.114 -0.916 0.0562 18.69..
20811.
..
0.0000 Jan-93 BPA I 824 0.0004 0.8037 10.5% 35.5% 60.166 4.087 0.0574 21.50..
253439. ..
0.0000 Feb-93 BPI 1158 0.0007 1.0825 17.2% 34.1% 65.850 -3.850 0.0720 21.91..
193454...
0.0000 Dec-95 BPSM 1286 0.0011 2.1593 27.8% 29.2% 7.373 1.001 0.0683 12.22..
1239...
0.0000 Jun-95 Brisu 685 0.0008 1.4196 20.5% 24.0% 1.974 0.474 0.0936 8.48..
56.
..
0.0000 Nov-97 BTA 1899 0.0003 0.6044 7.1% 32.6% 67.662 2.905 0.0562 28.04..
333503.
..
0.0000 Jan-93 C. Amorim 1899 0.0005 0.9968 11.5% 31.8% 5.984 0.505 0.0562 I 1.81..
785.
..
0.0000 Jan-93 Cimpor 1522 0.0007 1.7933 16.4% 22.5% 46.636 -2.543 0.0628 22.25..
122391...
0.0000 Jul-94 C/N I 899 0.0006 1.3016 14.5% 30.7% I 3.470 -0.263 0.0562 17.08..
8695...
0.0000 Jan-93 CPP 1899 0.0003 0.6047 6.3% 28.9% 12.589 1.121 0.0562 14.42..
7673...
0.0000 Jan-93 EDP 799 0.0002 0.3425 5.2% 27.1% 4.734 0.404 0.0867 I 1.21..
122...
0.0000 Jun-97 Engil 1339 0.0002 0.3973 5.5% 31.8% 57.473 3.498 0.0669 23.36..
168282.
..
0.0000 Apr-95 !mpt!rio I 156 0.0003 0.5554 8.6% 33.4% 10.259 0.709 0.0720 13.93..
2635. ..
0.0000 Jan-96 M. Conjiam;a I 899 0.0010 1.4592 24.0% 45.3% 28.970 -0.990 0.0562 22.03..
53675. ..
0.0000 Jan-93Mode/a Continente I 156 0.0009 1.5404 21.8% 30.5% 8.958 -0.322 0.0720 12.42
..
1730.
..
0.0000 Jan-96Mota& Camp. I 899 0.0000 0.0934 1.1% 33.4% 21.394 -0.932 0.0562 18.31
..
27045...
0.0000 Jan-93Mundicenter I 899 0.0006 1.2781 15.5% 33.5% 8.872 0.405 0.0562 12.60
..
2780. ..
0.0000 Jan-93 Parurede 292 0.0033 1.1699 82.9% 76.6% 18.466 2.839 0.1433 10.43..
3302...
0.0000 Jul-99 Portucel 1282 0.0002 0.4536 5.8% 28.8% 5.352 0.480 0.0684 12.20..
345...
0.0000 Jun-95 PT 1298 0.001 I 1.9399 26.9% 31.6% 3.496 -0.270 0.0680 8.90..
29...
0.0000 Jun-95 PT Mu/timridia 195 0.0005 0.1553 12.9% 73.6% 2.874 -0.246 0.1754 7.45..
2 0.3503 Nov-99 SAG 530 -0.0003 -0.3835 -8.7% 33.1% 6.184 0.414 0.1064 11.36..
239...
0.0000 Jul-98 Semapu 1261 0.0009 1.8386 22.3% 27.2% 6.546 -0.428 0.0690 12.22..
699...
0.0000 Jul-95Soares da Costa 1656 -0.0008 -1.3777 -19.3% 36.0% 10.127 0.167 0.0602 16.31
..
3513...
0.0000 Dec-93Sanae IndUstria 1673 0.0003 0.4287 6.8% 41.1% 36.000 0.067 0.0599 24.87
..
75914...
0.0000 Nov-93Sanae !nvestimentos I 899 0.0012 2.5095 29.4% 32.3% 5.674 0.299 0.0562 12.29
..
594...
0.0000 Jan-93Soporcel 1899 0.0009 1.9004 22.4% 32.5% 26.782 2.051 0.0562 19.22
..
46084. ..
0.0000 Jan-93Telecel 922 0.0012 1.3451 30.9% 44.1% 3.102 0.187 0.0807 9.46
..
5.8.
0.0556 Dec-96Unicer 1832 0.0006 1.7494 15.6% 24.1% 22.13 I 1.783 0.0572 18.53
..
28909. ..
0.0000 Jan-93PS/20 I 899 0.0007 2.93 I I 18.3% 17.2% 9.249 -0.755 0.0562 15.17
..
3271...
0.0000 Jan-93Skewness = m
3 1 s3; Kurtosis = m, Is'; Studentized range = [max. (R1) -min. (R,ll Is ; and Jarque-Bera = T* (Skewness
216 + (Kurtosis- 3)2124); where m, = ~ (R
1 -11J21 (T-1}, Tis
the number of observations and 11 is the mean return. Standard errors of the coefficients of skewness (SK stand. error) under the null hypothesis of normality where computed as (6 I T)'12•
* Confidence level at 10%; **Confidence level at 5%; ***Confidence level at 1%.
Jl :n
i
6-§j ~ Sfi ~ ii ~ iii <: -. (/)J
p
~--"'
"'--8
' IPORTUGUESE JOURNAL OF MANAGEMENT STUDIES, VOL. XI/, N. g 1, 2007 and variance, do. We therefore continue to reject the null hypothesis of nor-mality of daily returns for both sub-periods because the sign of the skewness does not change from the first to the second sub-period. As a result, it seems that downside risk is a relevant measure of risk, independent of the time pe-riod considered .
Following the procedure proposed by Peir6 (1999) and Machado-Santos and Fernandes (2005), we created two sub-samples for each series6
• If
re-turns are symmetric (around the mean), these two sub-samples should have the same distribution. To test the hypothesis of significant differences between the two sub-samples, we carry out the parametric F-test and the non-paramet-ric Kruskai-Wallis rank test. The main difference between these tests is the assumption of the nature of the distributions to check for different mean values among various populations. The F-test for K population means is used to test the null hypothesis that the K samples came from K populations with the same mean. The Kruskai-Wallis, which assumes similar distributions among the populations, is used to test the null hypothesis that all K population distri-bution functions are identical or, alternatively, the K populations have equal means. The results of these tests are shown in Table 2. The results suggest the rejection of null hypothesis of equality between positive and negative excess returns for almost all individual stocks (except for Modelo Continente, PT Multimedia and Telecel) and the acceptance for the market index (PSI 20), at a 5% significant level, by the F-test and Kruskai-Wallis test. It seems that the Portuguese stock skewness is diversifiable. This was already demonstrated by Levy and Markowitz (1979) and Kroll, Levy and Markowitz (1984) for other markets, and supported their thesis that quadratic utility function can be used to maximize investor's utility. Peir6 (1999) also finds weak signs of asymme-try in most international market indexes' daily financial returns.
These results support the arguments against the use of CAPM or mean-variance models on the estimation of the cost of equity. On the other hand, the observed asymmetry of stock return distributions favours the use of downside models.
Any required return can be thought of as having two components: a risk free rate and a risk premium. To estimate an investor's required return (or a firm's cost of equity) we apply section 2 downside risk measures in the following equation7
:
6 One of the series is formed by negative excess returns in absolute values, 1 R·l = {~-t-R, I R, < ~-t}, and the
other is formed by positive excess returns, I R• I = {I-t -R, I R, > ~-t}.
7 For instance, for LPM (2, ~-tl equation (8) becomes:
K = r + (R -r) [ r_!_--;~;-M.-a-x.[-0,(-p-,--Rr-ll-'/ _!_ ~Max.[O,(JI.u-Rrl]']
1, e r M I K T=l K r.,1
where 11, and 11M represent stock iand market (proxied by PSI20) mean return, respectively, computed using the same time period.
PORTUGUESE JOURNAL OF MANAGEMENT STUDIES, VOL. XI/, N. 0 1, 2007
TABLE 2
F- Test and Kruskaii-Wallis {KW) Tests for Differences Between Positive and Negative Returns
F-stat P value Fcrit.S% Fcrit.I% KW-stat P value rzcrit. 5% x ... zcrit.l%
BAN IF 146.2528 0.00000 3.8464 6.6483 341.8889 0.000 3.841 6.635 BCP 4.0545 0.04422 3.8474 6.6510 3.9075 0.048 3.841 6.635 BES 43.0401 0.00000 3.8464 6.6483 111.4495 0.000 3.841 6.635 BPA 34.6300 0.00000 3.8466 6.6489 106.0127 0.000 3.841 6.635 BPI 29.2861 0.00000 3.8495 6.6568 6.6606 0.010 3.841 6.635 BPSM 20.4886 0.00001 3.8487 6.6547 14.3091 0.000 3.841 6.635 Brisa 9.2776 0.00241 3.8551 6.6722 5.3329 0.021 3.841 6.635 BTA 10.7240 0.00108 3.8464 6.6483 25.8990 0.000 3.841 6.635 Cimpor 6.2818 0.01228 3.8464 6.6483 16.5641 0.000 3.841 6.635 GIN 144.4689 0.00000 3.8476 6.6516 350.4355 0.000 3.841 6.635 Corticeira Amorim 27.3416 0.00000 3.8464 6.6483 38.5321 0.000 3.841 6.635 CPP 63.3852 0.00000 3.8464 6.6483 162.3672 0.000 3.841 6.635 EDP 11.6395 0.00068 3.8532 6.6668 7.2075 0.007 3.841 6.635 En gil 39.0062 0.00000 3.8484 6.6539 92.6042 0.000 3.841 6.635 Imperio 30.8117 0.00000 3.8495 6.6569 66.1606 0.000 3.841 6.635 M. Confiam;a 43.3150 0.00000 3:8464 6.6483 149.7062 0.000 3.841 6.635 Modelo Continente 0.8749 0.34981 3.8495 6.6569 2.7090 0.100 3.841 6.635
Mota & Companhia 185.7268 0.00000 3.8464 6.6483 486.6554 0.000 3.841 6.635
Mundicenter 190.9443 0.00000 3.8464 6.6483 413.4011 0.000 3.841 6.635 Pararede 7.1962 0.00773 3.8737 6.7231 3.6188 0.057 3.841 6.635 Portucel 7.6950 0.00562 3.8487 6.6548 7.9552 0.005 3.841 6.635 PT 3.9684 0.04657 3.8486 6.6544 8.4598 0.004 3.841 6.635 PT Multimedia 0.0839 0.77244 3.8901 6.7680 0.0597 0.807 3.841 6.635 SAG 4.2559 0.03960 3.8591 6.6831 12.2125 0.000 3.841 6.635 Semapa 9.1071 0.00260 3.8489 6.6551 28.7593 0.000 3.841 6.635 Soares da Costa 11.6647 0.00065 3.8471 6.6502 73.8674 0.000 3.841 6.635 Sanae IndUstria 20.6888 0.00001 3.8470 6.6501 40.2152 0.000 3.841 6.635 Sanae lnvestimentos 7.9431 0.00488 3.8464 6.6483 8.5920 0.003 3.841 6.635 Soporcel 101.5479 0.00000 3.8464 6.6483 210.7107 0.000 3.841 6.635 Tefecef 3.3604 0.06711 3.8516 6.6625 1.9828 0.159 3.841 6.635 Unicer 30.7136 0.00000 3.8465 6.6487 63.9889 0.000 3.841 6.635 PSI20 0.3359 0.56227 3.8464 6.6483 2.3853 0.1225 3.841 6.635
(8)
where
Ki.e
is the cost of equity of firm i,r,
is the risk free rate,R
M is the market rate of return, DRMi is the downside risk measure of firm, and DRMM is the downside risk measure of the market for the same period of firm i.Besides downside risk measures, we also use the traditional beta (from CAPM) and the total risk (TR- measured by standard deviation) in the estima-tion of a firm's cost of equity. The LPM and SSD are estimated with respect to the mean of stock returns. The risk aversion coefficient of LPM measure,
a,
is set to 0.5, 1, 2 and 3 (the increase ofa
means an increase of risk aversion).In this sense, specific risk measures should be used in particular circum-stances:
16
I. Traditional beta when the investor is diversified and stock and market returns distribution are symmetric;
II. TR when the investor is not diversified and stock and market returns distribution are symmetric;
PORTUGUESE JOURNAL OF MANAGEMENT STUDIES, VOL. XI/, N. 2 1, 2007
Ill. Leland's beta when the investor is diversified but the stock return distributions are skewed and the market return distribution is lognor-mal;
IV. Downside beta (/3d) when the investor is diversified but the stocks and market return distributions are skewed;
V. LPM and SSD when the investor is not diversified and stock return distribution is skewed.
4. EMPIRICAL EVIDENCE
In this section, we analyse the importance of downside risk models in the estimation of the cost of equity and compare them to standard models. This analysis is done in two ways: first, we regress several risk measures with mean returns to identify the important ones; second, we estimate the compa-nies' cost of equity.
Table 3 presents the estimates of each of the eight risk measures for each of the stocks in the sample, computed over the whole sample period consid-ered for each stock.
The correlation matrix between the mean returns and the risk measures (Table 4) provides a preview of some results of this study. We observe a high correlation between the mean return and LPM 0.5 and TR, which suggests that the investors that hold our sample companies' stocks are both risk-loving and do not hold a diversified portfolio. The high correlation between TR and all LPM measures suggests that an important component of total risk is related to the negative skewness of the stocks' return distributions (see Table 1 ). The low correlation between the measures of TR/LPM and the measures of systematic risk (Leland's beta, traditional beta and downside beta) contradicts the con-clusions of Beedles (1979), who argues for the high correlation between tradi-tional beta and skewness. Rather, it seems to indicate that idiosyncratic risk represents an important fraction of total risk/downside risk. The high correla-tion between the measures of systematic risk points towards a low level of stocks' systematic skewness and that the return distribution of the market index is symmetric (see Table 2). The low correlation between the mean return and LPM 3 suggests that investors are not risk-averse.
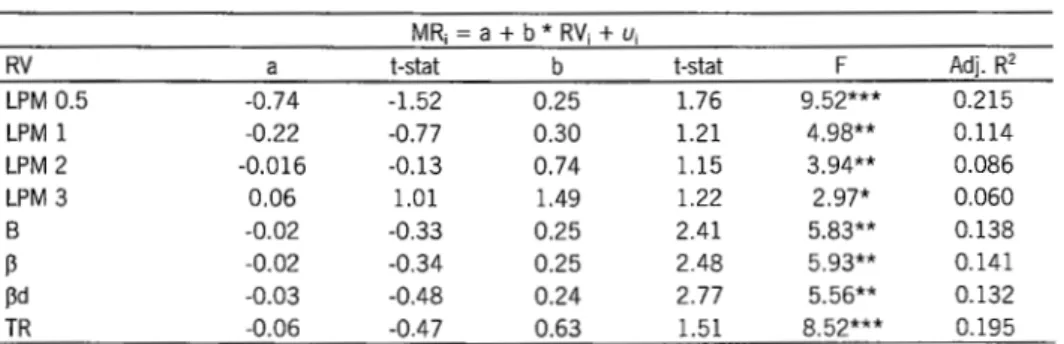
A regression analysis provides a more detailed analysis about the rela-tionship between the risk measures and stock returns. In Table 5, we make a cross-sectional simple linear regression model relating mean returns (MR) to the defined risk variables (RV).
The results shown in Table 5 are corrected for heteroskedasticity. Firstly, it should be noted that all regressions are statistically significant according to
PORTUGUESE JOURNAL OF MANAGEMENT STUDIES, VOL. XI/, N.0 1, 2007
TABLE 3
Risk Measures (daily euro returns)
Stock A-D Rank Mean Return LPM B pd p TR
(year) 0.5 1 2 (or SOD) 3
IBANIF Logistic 0.9% 320% 118% 21% 5% 0.48 (32.7) 0.54 (14.1) 0.46 (11.6) 31.0% ~CP Logistic 12.6% 327% 109% 17% 4% 0.81 (73.2) 0.84 (32.8) 0.82 (31.7) 23.6% ~ES Logistic 10.6% 319% 104% 17% 4% 0.81 (87.8) 0.86 (33.8) 0.80 (31.9) 23.5% ~PA Logistic 10.5% 339% 118% 21% 5% 0.63 (37.4) 0.62 (16.8) 0.62 (13.6) 35.5% ~PI Lognormal 17.2% 355% 128% 26% 11% 0.27 (14.5) 0.46 (8.7) 0.29 (5.81 34.1% ~PSM Logistic 27.8% 354% 121% 19% 4% 0.64 (43.4) 0.71 (22.4) 0.64 (16.5) 29.2% ~risa Logistic 20.5% 354% 118% 16% 3% 0.53 (28.1) 0.50 (17.0) 0.54 (16.1) 24.0% ~TA Logistic 7.1% 344% 121% 21% 6% 0.71 (92.9) 0.66 (18.3) 0.72 (17.9) 32.6% . Amorim Logistic 11.5% 360% 128% 21% 5% 0.77 (223.5) 0.83 (24.5) 0.75 (19.3) 31.8% impor Logistic 16.4% 318% 103% 17% 5% 0.65 (62.0) 0.68 (23.0) 0.65 (23.3) 22.5% IN Logistic 14.5% 333% 116% 22% 6% 0.39 (70.81 0.41 (10.4) 0.39 (9.71 30.7% pp Logistic 6.3% 326% 111% 19% 4w lo 0.64 (174.3) 0.65 (20.7) 0.64 (17.9) 28.9% DP Logistic 5.2% 358% 122% 18% 4% 0.71 (39.6) 0.69 (23.4) 0.72 (21.7) 27.1% ngil Logistic 5.5% 340% 117% 19% 4% 0.45 (26.4) 0.53 (14.5) 0.44 (9.81 31.8% mperio Logistic 8.6% 354% 125% 22% 5% 0.77 (46.6) 0.80 (20.7) 0.76 (17.3) 33.4% ~-Conlianca Logistic 24.0% 366% 138% 33% 13% 0.86 (49.0) 0.75 (12.6) 0.87 (15.3) 45.3%
~ode/o Continente Logistic 21.8% 349% 124% 22% 5% 0.93 (68.7) 1.07 (31.8) 0.91 (25.2) 30.5%
~ota & Comp. Logistic 1.1% 299% 111% 24% 8% 0.35 (42.1) 0.43 (9.51 0.34 (7.91 33.4%
~undicenter Logistic 15.5% 338% 119% 23% 6% 0.17 (37.8) 0.27 (6.5) 0.18 (4.01 33.5%
loararede Logistic 82.9% 439% 178% 41% 13% 1.01 (9.61 0.97 (5.9) 1.00 (4.61 76.6%
loortuce/ Logistic 5.8% 356% 125% 19% 4% 0.70 (48.6) 0.71 (21.4) 0.71 (19.0) 28.8%
lor Logistic 26.9% 360% 130% 23% 5% 1.26 (106.41 1.38 (47.5) 1.27 (42.1) 31.6%
lor Multimedia Logistic 12.9% 450% 202% 52% 17% 1.05 (8.91 0.86 (3.81 1.08 (4.91 73.6%
~AG Logistic ·8.7% 356% 133% 23% 5% 0.65 (8.4) 0.68 (13.9) 0.64 (11.9) 33.1%
~emapa Logistic 22.3% 348% 120% 20% 4% 0.75 (57.5) 0.87 (27.1) 0.72 (21.1) 27.2%
~oares da Costa Logistic -19.3% 356% 134% 25% 6% 0.46 (23.21 0.49 (10.9) 0.45 (9.4) 36.0%
~onae Industria Logistic 6.8% 370% 137% 28% 10% 1.02 (49.0) 1.08 (23.2) 1.00 (19.6) 41.1%
~onae lnvestimentos Logistic 29.4% 362% 130% 22% 5% 1.15 (322.61 1.19 (38.6) 1.17 (35.0) 32.3%
~oporcel Logistic 22.4% 351% 121% 21% 5% 0.43 (89.2) 0.43 (11.7) 0.43 (10.2) 32.5%
Telecel Logistic 30.9% 400% 157% 30% 7% 1.26 (57.5) 1.34 (29.0) 1.25 (24.5) 44.1%
Unicer Logistic 15.6% 330% 107% 15% 3% 0.40 (28.31 0.45 (16.91 0.40 (12.7) 24.1%
loS/ 20 (market proxy) Logistic 18.3% 305% 95% 13% 2% 1 I 1 17.2%
A-D Rank: Anderson-Darling Ranking for goodness-of-fit; SSD: Semi-standard deviation (equal to LPM when a ; 2}: B: leland's Beta; fl:
Traditional beta (from CAPMI: f><l: Downside beta; TR: Total Risk. (!-statistics are provided in parenthesis).
TABLE 4
Cross-Section Analysis: Correlation Matrix
Mean Rctum LPM 0.5 LPM I LPM 2 LPM3 B Mean Return LPM 0.5 0.52 LPM 1 0.40 0.96 LPM2 0.36 0.83 0.94 LPM3 0.32 0.68 0.80 0.93 B 0.41 0.57 0.52 0.40 0.25 I ll 0.41 0.58 0.53 0.41 0.27 1.00 lld 0.40 0.46 0.40 0.27 0.25 0.96 TR 0.49 0.86 0.93 0.96 0.87 0.39
8: Leland's Beta; ~:Traditional beta (from CAPM); ~d: Downside beta; TR: Total Risk.
p !ld lR
0.96
0.40 0.39
the F statistic and that LPM 3 is the risk measure with the lowest explanatory power, which reinforces the idea that investors who hold our sample stocks are not risk-averse. All risk measures enter the regressions with the expected signs. Only the measures of systematic risk (8, ~. ~d) are statistically
PORTUGUESE JOURNAL OF MANAGEMENT STUDIES, VOL. XI/, N.Q 1, 2007
cant, at the 1 percent confidence level, but their explanatory power is relatively low. On the other hand, the measures of total risk and LPM are not statistically significant, at the 1 percent confidence level, but their explanatory power is rela-tively high. Regressions with LPM 0.5 and TR have high explanatory power. Estrada (2000) reports similar results. The author finds that TR is significantly related to stock returns •. which, combined with the lack of explanatory power of systematic risk, implies that in emerging markets diversifiable risk is priced.
Table 6 reports the results, corrected for heteroskedasticity, of multiple regressions in which returns are jointly related with two risk variables8
. These
results differ only slightly from the previous ones. LPM measures, when inves-tor is risk neutral and averse (a =1, 2, 3), remain not statistically significant, with low explanatory power. The measures of systematic skewness and sys-tematic risk, when combined with the measures of total risk or LPM, remain statistically significant and the explanatory power of the regressors increase. This means that these measures seem to explain different parts of the variabil-ity of the mean returns. It is worth noting that when one of the risk variables of the regression is TR, regression explanatory power increases significantly. This means that TR explains part of the variability in mean returns not considered by the other measures.
We estimate the cost of equity of the companies using all risk measures. As stated previously, the right model to estimate the cost of equity is a function of the investor's risk exposure and of the return distribution features of owned asset(s).
TABLE 5
Cross-Section Analysis: Simple Regressions
MR; =a+ b * RV; + U;
RV a !-stat b t-stat F Adj. R2
LPM 0.5 -0.74 -1.52 0.25 1.76 9.52*** 0.215 LPM 1 -0.22 -0.77 0.30 1.21 4.98** 0.114 LPM 2 -0.016 -0.13 0.74 1.15 3.94** 0.086 LPM 3 0.06 1.01 1.49 1.22 2.97* 0.060 B -0.02 -0.33 0.25 2.41 5.83** 0.138 13 -0.02 -0.34 0.25 2.48 5.93** 0.141 j3d -0.03 -0.48 0.24 2.77 5.56** 0.132 TR -0.06 -0.47 0.63 1.51 8.52*** 0.195
MR: Mean Return; RV: Risk Variable; 8: Leland's Beta; P: Traditional beta (from CAPM); Pd: Downside beta; TR: Total Risk. * Confidence level at 10%; **Confidence level at 5%; ***Confidence level at 1%.
8 From the analysis of Table 4 we can conclude that we will have problems of multicollinearity if we relate
returns with two perfect or almost perfect correlated risk variables. As Gujarati (1988) says" ... we do not have one unique method of detecting or measuring the strength of multicollinearity" (p. 298), so we consider that when the correlation coefficients between the regressors is in excess of 0.8, multicollinearity could be a serious problem and we do not combine these regressors.
PORTUGUESE JOURNAL OF MANAGEMENT STUDIES, VOL. XI/, N. 2 1, 2007
TABLE 6
Cross-Section Analysis: Multiple Regressions MR; = a + b1 * RV1; + b2 * RV2; + V;
RVI I RV2 a !-stat bl !-stat b2 !-stat F Adj. R2
LPM 0.5 I LPM 3 -0.898 -1.865 0.303 2.206 -0.356 -0.424 5.22** 0.22 LPM 0.5 I 8 -0.719 -1.169 0.227 1.187 0.101 1.125 5.67*** 0.237 LPM 0.5 I~ -0.716 -1.148 0.226 1.164 0.100 1.087 5.65*** 0.237 LPM 0.51 ~d -0.743 -1.275 0.227 1.255 0.125 1.493 6.07*** 0.253 LPM 1 I 8 -0.233 -0.734 0.211 0.738 0.165 1.942 3.86** 0.16 LPM 1 I~ -0.229 -0.714 0.208 0.714 0.166 1.941 3.87** 0.16 LPM 1 I ~d -0.274 -0.907 0.234 0.864 0.174 2.241 4.17** 0.174 LPM 2 I 8 -0.102 -0.681 0.516 0.740 0.190 2.718 3.79** 0.157 LPM 2 I~ -0.100 -0.668 0.507 0.717 0.190 2.792 3.79** 0.157 LPM 2 I ~d -0.134 -0.902 0.596 0.881 0.199 2.982 4.12** 0.172 LPM 3 I 8 -0.068 -0.661 1.153 0.883 0.211 2.890 3.85** 0.16 LPM 3 I~ -0.067 -0.653 1.127 0.855 0.211 3.005 3.85** 0.16 LPM 3 I ~d -0.095 -0.900 1.344 1.029 0.222 3.092 4.17** 0.174 8/TR -0.143 -0.982 0.154 2.216 0.542 1.136 6*** 0.25 ~/TR -0.142 -0.970 0.154 2.218 0.539 1.119 6.01 *** 0.25 ~d ITR -0.178 -1.230 0.179 2.741 0.574 1.262 6. 71 *** 0.276
MR: Mean Return; RV: Risk Variable; B: Leland's Beta; P: Traditional beta (from CAPM); Pd: Downside beta; TR: Total Risk. * Confidence level at 10%; **Confidence level at 5%; ***Confidence level at 1%.
Table 7 shows the Portuguese cost of equity based on each of the risk measures considered, as well as on a risk free rate of 4% and a market risk premium of 5.5%9.
As expected, the cost of equity based on measures of systematic risk or systematic skewness is the lowest of all, and the values are identical, which, once again, reiterates the inexistence of systematic skewness and the symme-try of market index. Investors should use these measures when they have a diversified portfolio.
By contrast, we have the cost of equity based on TR. As expected, the cost of equity based on this measure is one of the highest (only when the investor becomes more risk averse,
a
>
2, do we find even higher values). Investors should use this measure when they have a non-diversified portfolio and asset and market return distributions are symmetric. The problem with this measure is that standard deviation gives the same weight to downside and upside risk, but only the downside risk is relevant. Thus, when we have a symmetric market return distribution and we are estimating the cost of equity of an asset with a right (left) skewed return distribution, the TR overestimates (underestimates) this value. For these reasons we disagree with Damodaran (2001) when he says that 'the owner of a private firm generally has the bulk of9 Damodaran (2000) says that the particular period, the risk free asset, the periodicity of the quotations, etc,
condition the market risk premium. Therefore, we assume that 5.5% is a fair market risk premium for the Portuguese market, which is usually assumed by several academics.
BAN IF BCP BES BPA BPI BPSM Brisa BTA C. Amorim Cimpor CIN CPP EDP Engil Imperio M. Confiam;a Modelo Continente Mota & Comp. Mundicenter Pararede Portucel PT PT Multimedia SAG Semapa Soares da Costa Sonae Industria Sanae lnvestimentos Soporcel Telecel Unicer
Cost of Equity Avg.
PORTUGUESE JOURNAL OF MANAGEMENT STUDIES, VOL. XI/, N.g 1, 2007
TABLE 7
Portuguese Firms Cost of Equity
LPM B TR 0.5 2 (or SSD) 3 9.77% 10.83% 12.88% 17.75% 6.63% 6.96% 6.55% 13.90% 9.80% 10.18% 11.19% 11.33% 8.48% 8.60% 8.49% 11.20% 9.75% 10.02% 11.19% 15.00% 8.47% 8.71% 8.43% 11.50% 10.11% 10.83% 12.88% 17.75% 7.44% 7.42% 7.40% 15.24% 10.24% 10.90% 13.53% 24.17% 5.48% 6.54% 5.58% 13.39% 10.28% 10.72% 11.46% 9.69% 9.59% 9.18% 11.33% 7.55% 7.92% 7.52% 12.41% 9.50% 6.90% 6.73% 6.96% 9.65% 10.20% 11.01% 12.88% 20.50% 7.91% 7.63% 7.95% 14.40% 10.47% 11.33% 12.88% 13.17% 8.21% 8.58% 8.11% 13.78% 9.73% 9.96% 11.19% 17.75% 7.59% 7.74% 7.55% 11.18% 10.00% 10.72% 13.31% 20.50% 6.15% 6.26% 6.14% 13.80% 9.88% 10.43% 12.04% 15.00% 7.52% 7.59% 7.50% 13.22% 9.84% 9.83% 9.82% 11.33% 7.89% 7.78% 7.93% 10.46% 10.03% 10.57% 11.46% 11.33% 6.48% 6.89% 6.41% 13.34% 10.22% 10.74% 12.07% 13.17% 8.24% 8.40% 8.17% 13.19% 10.60% 11.99% 17.96% 39.75% 8.75% 8.11% 8.80% 18.46% 10.13% 10.69% 12.07% 13.17% 9.11% 9.89% 9.00% 12.38% 9.39% 10.43% 14.15% 26.00% 5.94% 6.36% 5.89% 14.65% 10.10% 10.89% 13.73% 20.50% 4.94% 5.49% 4.99% 14.69% 11.21% 12.98% 20.11% 39.75% 9.53% 9.32% 9.52% 25.30% 10.30% 10.94% 11.46% 10.39% 11.22% 13.04% 11.33% 7.84% 7.90% 7.89% 12.28% 13.17% 10.93% 11.58% 10.96% 13.16% 11.13% 13.34% 20.82% 35.17% 9.78% 8.72% 9.92% 22.01% 9.55% 10.10% 11.03% 10.88% 7.58% 7.75% 7.55% 11.74% 10.15% 10.60% 11.86% 11.33% 8.12% 8.79% 7.98% 11.78% 10.34% 11.60% 14.58% 15.00% 6.52% 6.67% 6.50% 15.06% 10.61% 11.85% 15.85% 22.33% 9.61% 9.94% 9.50% 16.69% 10.53% 11.53% 13.31% 10.33% 11.01% 12.88% 10.73% 11.85% 14.31% 9.95% 10.26% 10.35% 17.75% 10.33% 10.57% 10.45% 14.30% 17.75% 6.37% 6.34% 6.36% 14.38% 16.83% 10.93% 11.37% 10.90% 14.98% 12.25% 6.22% 6.47% 6.19% 11.67% 10.18% 10.93% 13.08% 17.82% 7.85% 8.03% 7.84% 14.01% SSD: Semi-standard deviation (equal to LPM when a ~ 2); B: Leland's Beta; P: Traditional beta (from CAPM); Pd: Downside beta; TR: Total Risk.
PORTUGUESE JOURNAL OF MANAGEMENT STUDIES, VOL. XI/, N.Q 1, 2007
his or her wealth invested in the business. Consequently, he or she cares about the total risk in the business rather than just the market risk' (p. 86).
In our opinion, the best measure of risk for the owner of a private or public firm or an entrepreneur is a downside risk measure, except if asset and market return distributions are symmetric.
The cost of equity based on downside risk, which takes into account only the volatility that investors seek to avoid is, as expected, between the cost of equity based on systematic risk or systematic skewness and TR. Not surprisingly, when we increase the value of
a
(i.e. the investor becomes more risk averse), the average cost of equity increases to a value higher than that given by TR.Given the fact that LPM 2 (or semi-standard deviation) is the only mea-sure of all downside risk meamea-sures perceived favourably by Markowitz (1952, 1991) and that Estrada (2004) demonstrates that mean-semi standard devia-tion behavior is an approximately-correct criterion to maximize the expected utility function, in our opinion this is the right risk measure for the average non-diversified investor. Nevertheless, if an investor has a well defined pattern of risk tolerance, he could use one of the other measures.
5. CONCLUSIONS
There are loads of data proving that stock return distributions are not always normal and are often skewed. Given that investors dislike downside risk, i.e., they price and have a preference positive skewness, asset pricing models must consider other moments, like skewness, and not only mean and variance. We started by describing some downside risk measures and testing the hypothesis of normality and symmetry of the most important Portuguese stocks and of the market index. We concluded that none of the sample asset return distributions was normal and that almost all were skewed (although the market index return distribution was symmetric, which means that the asymme-try of the stocks' returns was diversifiable). These facts sustain the applicabil-ity of downside risk measures. We then used these measures as explanatory variables and analysed their explanatory power of mean returns. TR was sig-nificantly related to stock returns and the regression explanatory power in-creased when TR was one of the variables, which means that diversifiable risk is priced. The systematic skewness measures (B and ~d) and systematic risk
measure(~) were very similar. In fact, the empirical evidence presented in this paper did not allow us to draw conclusions about the usefulness of systematic skewness measures, because the market index return distribution was sym-metric. Still, in our opinion, these measures are very useful for the estimation of required return when the investor is diversified and market index return
PORTUGUESE JOURNAL OF MANAGEMENT STUDIES, VOL. XI/, N.Q 1, 2007
distribution is asymmetric. When the investor is not diversified, it is the choice of risk measure that becomes important.
Finally, it is difficult to say what is the rightmeasure to use on the estima-tion of cost of equity and if these values reflect the real risk taken on by inves-tors. However, empirical evidence (presented both here and in several other papers) does seem to support the use of downside risk measures more than the traditional measure of systematic risk.
Furthermore, it is obvious that the differences in the required return (based on the several risk measures) are relevant and could have an important impact on company value and even explain why investors value the same asset differ-ently. As a suggestion for future research, we could apply these measures in the evaluation of the performance of portfolios with options and model the evaluation like a dynamic model. Besides this, we also think that it will be very important to develop asset pricing models that consider other higher-order moments, like kurtosis, and extreme events, like bankruptcy.
PORTUGUESE JOURNAL OF MANAGEMENT STUDIES, VOL. XI/, N. Q 1, 2007 References
Aparicio, F. and Estrada, J. (2001 ). Empirical Distributions of Stock Returns: European Securities Markets, 1990-95. European Journal of Finance, 7, 1-21.
Arditti, F. D. (1975). Skewness and Investors' Decisions: A Reply. Journal of Financial and
Quanti-tative Analysis, 10, 173-176.
Bawa, V. S. (1975). Optimal Rules for Ordering Uncertain Prospects. Journal of Financial
Econom-ics, 2, 95-121.
Beedles, W. L. (1979). Return, Dispersion and Skewness: Synthesis and Investment Strategy. The
Journal of Financial Research, 2, 71-80.
Brealey, R. and Myers S. (2002). Principles of Corporate Finance. McGraw Hill.
Brennan, M. (1979). The Pricing of Contingent Claims in Discrete Time Models. Journal of Finance, 24, 53-68.
Damodaran, A. (2000). Estimating Equity Risk Premiums. Working Paper, New York University, New York.
Damodaran, A. (2001). The Dark Side of Valuation: Valuing Old Tech and New Econmy Companies. Upper Saddle River, Prentice Hall.
Erb, C., Harvey C. and Viskanta, T. (1995). Country Risk and Global Equity Selection. Journal of
Portfolio Management, 7 4-83.
Erb, C., Harvey C. and Viskanta, T. (1996). Expected Returns and Volatility in 135 Countries.
Journal of Portfolio Management, 46-58.
Estrada, J. (2000). The Cost of Equity in Emerging Markets: A Downside Risk Approach. Emerging
Markets Quarterly, 19-30.
Estrada, J. (2002). Systematic risk in emerging markets: The D-CAPM. Emerging Markets Review, 3, 4, 365-379.
Estrada, J. (2004), Mean-Semivariance Behavior: An Alternative Behavioral Model. Journal of
Emerg-ing Market Finance, 3, 3, 231-248.
Fishburn, P. (1977). Mean-Risk Analysis with Risk Associated with Below-Target Returns. American
Economic Review, 67, 116-126.
Godfrey, S. and Espinosa, R. (1996). A Practical Approach to Calculating Costs of Equity for Invest-ment in Emerging Markets. Journal of Applied Corporate Finance, 80-89.
Gujarati, D. N. (1988). Basic Econometrics. McGraw-Hill.
Harlow, W. V. (1991). Asset Allocation in a Downside-Risk Framework. Financial Analysts Journal, 47, 28-40.
Harlow, W. V. and Rao, R. (1989). Asset Pricing in a Generalized Mean-Lower Partial Moment Framework: Theory and Evidence. Journal of Financial and Quantitative Analysis, 24, 285-311.
Harvey, C. (1995). Predictable Risk and Returns in Emerging Markets. Review of Financial Studies, 773-816.
Harvey, C. and Siddique, A. (2000). Conditional Skewness in Asset Pricing Test. Journal of Finance, 55, 1263-1295.
Hogan, W. and Warren, J. (197 4). Toward the Development of an Equilibrium Capital Market Model based on Semivariance. Journal of Financial and Quantitative Analysis, 9, 1-11.
Kraus, A. and Litzenberger, R. (1976). Skewness Preference and the Valuation of Risky Assets.
Journal of Finance, 31, 1085-1100.
Kroll, Y., Levy, H. and Markowitz, H. (1984). Mean Variance versus Utility Maximization. Journal of
Finance, 39, 47-61.
Leland, H. F. (1999). Beyond Mean-Variance: Performance Measurement in a Nonsymmetrical World. Financial Analysts Journal, 55, 27-36.
Levy, H. and Markowitz, H. M. (1979). Approximating Expected Utility by a Function of Mean and Variance. American Economic Review, 69, 308-317.
PORTUGUESE JOURNAL OF MANAGEMENT STUDIES, VOL. XI/, N.Q 1, 2007
Machado-Santos, C. ( 1998). On the Performance of Portfolios of Stocks Hedged with Options, PhD Thesis, University of Minho.
Machado-Santos, C. and Fernandes, A. C. (2005). Skewness in Financial Returns: Evidence from the Portuguese Stock Market. Czech Journal of Economics and Finance, 55, 460-469. Markowitz, H. M. (1952). Portfolio Selection. Journal of Finance, 8, 77-91.
Markowitz, H. M. (1991). Foundations of Portfolio Theory. Journal of Finance, 46, 469-477. Marmer, H. S. and Louis, F. K. (1993). Mean-Semivariance Analysis of option-Based Strategies: A
Total Asset Mix Perspective. Financial Analysts Journal, 47-54.
Nawrocki, D. N. (1999). A Brief History of Downside Risk Measures. Journal of Investing, 8, 9-23. Plantinga, A. and Groot, S. (2001). Risk Adjusted Performance Measures and Implied
Risk-Atti-tudes. Working Paper, www.ssrn.com.
Peir6, A. (1999). Skewness in Financial Returns. Journal of Banking and Finance, 23, 847-862. Rubinstein, M. (1976). The Valuation of Uncertain Income Streams and the Pricing of Options. Bell
Journal of Economics, 7, 407-425.
Sortino, F. A. and VanderMeer, R. (1991). Down-Side Risk. Journal of Portfolio Management, 17, 27-31.
Sortino, F. A. and Forsey, H. J. (1996). On the Use and Misuse of Down-Side Risk. Journal of Portfolio Management, 22, 35-42.
Tsiang, S. (1972). The Rationale of the Mean-Standard Deviation Analysis, Skewness Preference and the Demand for Money. American Economic Review, 62, 354-371.
Resumo
Os modelos tradicionais de avaliagao de actives tem como principal pressuposto o conceito de que a curva de utilidade dos investidores e completamente definida pela mediae pela variancia da distribuigao de rendibilidade dos actives. Este pressuposto requer a normalidade ou a simetria destas distribuig6es de rendibilidade. Na pratica, este pressuposto raramente se verifica e diversos estudos demonstram que os investidores tem em consideragao os mementos mais elevados das distribuig6es de rendibilidades. Neste artigo, analisamos a normalidade e a simetria das distribuig6es de rendibilidade de uma amostra de empresas portuguesas e estimamos o seu custo do capital proprio utilizando um conjunto de medidas de downside risk.
JEL:Gl2,G31
Palavras-chave: Distribuig6es de Rendibilidade Assimetricas; Gusto do Capital Proprio; Modelos de